Quantifying Electroplated Nickel Layer Thickness on Copper Substrates
Electroplated nickel thickness on copper substrates is reliably quantified using calibrated XRF per ASTM B568, verified via coulometric stripping per ASTM B504.

Bath
Electrodeposition of nickel onto copper interconnects depends on the precise regulation of cathodic current density, ionic mass transport, and surfactant thermodynamics within the electrolyte solution. High-current battery busbars and pouch cell terminal tabs rely on this protective metal layer to prevent oxidation, reduce contact resistance, and ensure laser or ultrasonic weld integrity. Small fluctuations in electrolyte balance or thermal state disrupt nucleation kinetics, yielding uneven thickness across the substrate surface.
Deposition Kinetics on High Conductivity Copper Alloys
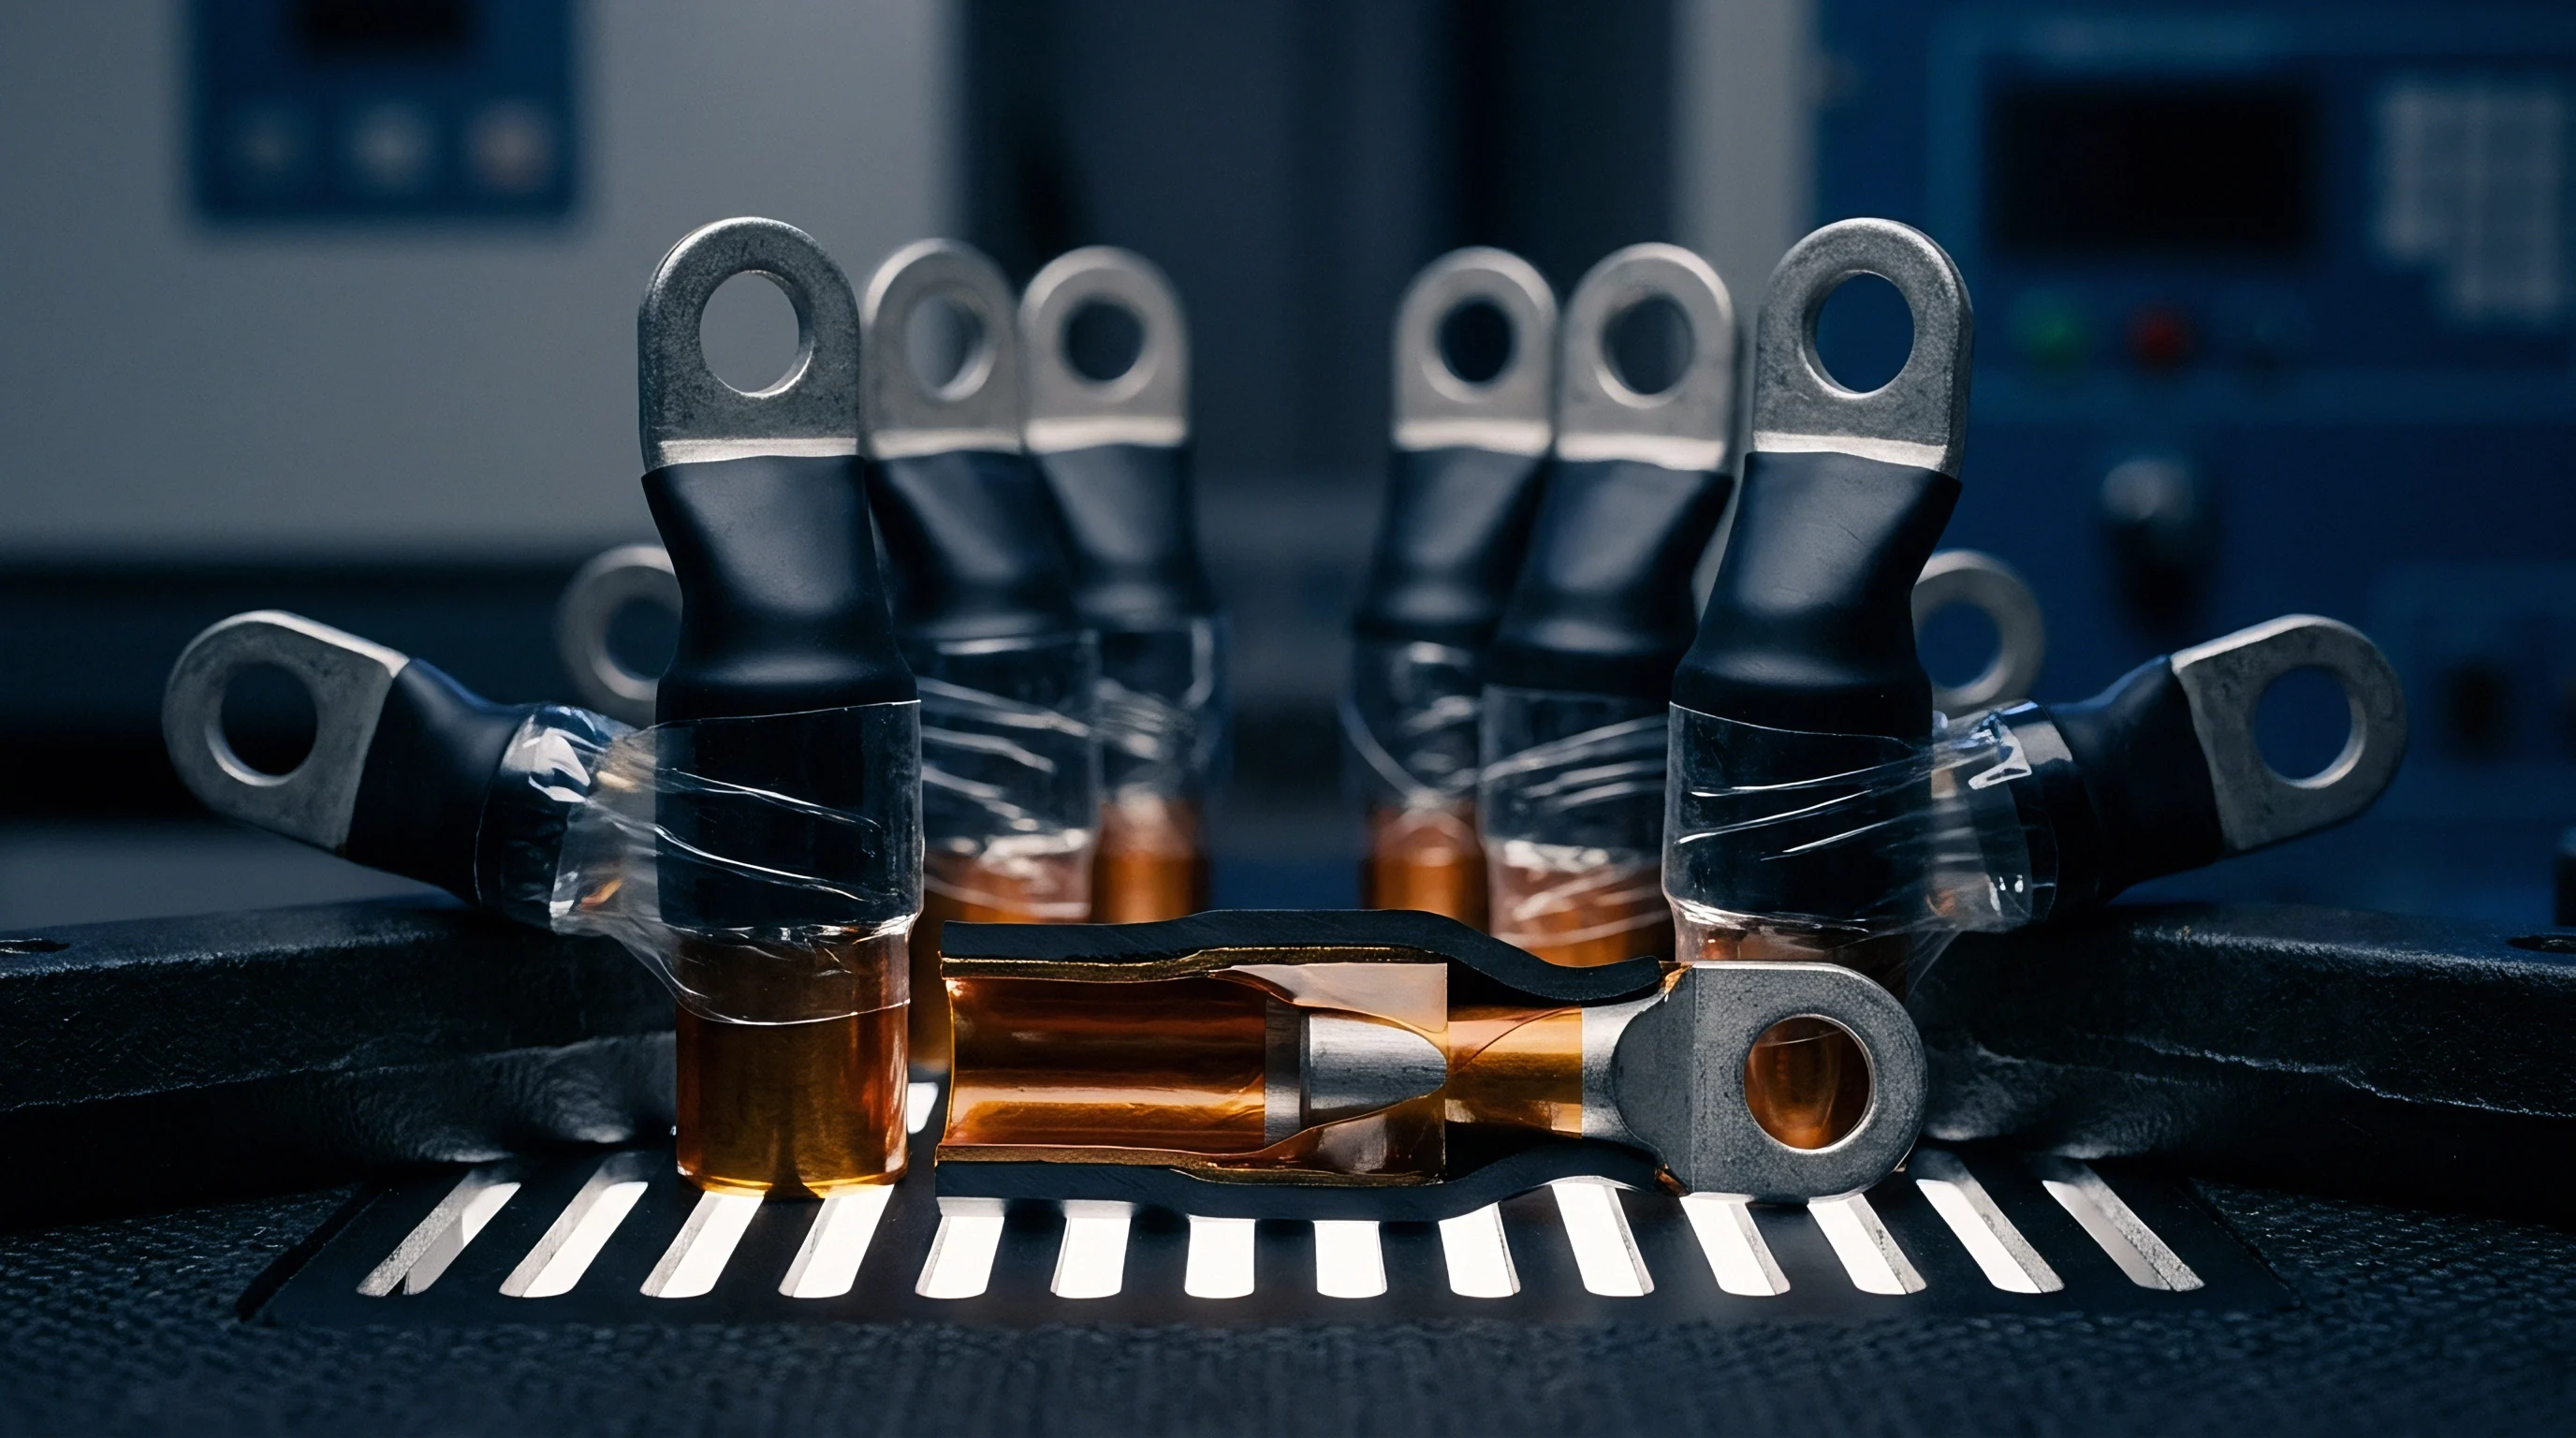
Pure electrolytic copper substrates, including oxygen-free C10200 and high-conductivity C11000 formulations, present native oxide barriers that impede initial metallic nucleation. Without complete removal of cuprous and cupric oxides through acid pickling and micro-etching, electrodeposited nickel ions fail to establish direct metallic bonding. The deposition process initiates when divalent nickel cations migrate through the cathodic boundary layer under an applied electric field.
Current density dictates thickness.
Plating bath drift destroys yield. Localized variations in current density occur naturally near sharp corners, punched hole geometries, and strip edges due to electric field concentration. In continuous reel-to-reel tab plating, edge-effect buildup creates thick ridges while central web regions remain thin.
Primary current distribution models predict this geometry-driven variance, but actual coating profile depends on secondary current distribution, which incorporates activation overpotential and charge-transfer resistance at the cathode interface.
Surfactants like sodium lauryl sulfate lower surface tension to prevent hydrogen gas bubbles from clinging to the copper surface. Retained hydrogen bubbles cause deep microscopic pits through the plating layer, creating direct paths to the underlying substrate. Regulating cathodic efficiency above 95 percent minimizes hydrogen evolution, ensuring dense, pore-free metallic accumulation across the entire active area.
Chemical Formulations and Current Density Gradients
Commercial electroplating lines select between Watt’s formulations and nickel sulfamate solutions depending on required internal stress, throughput velocity, and microstructural ductility. Watt’s baths combine nickel sulfate, nickel chloride, and boric acid to deliver cost-effective coatings, though high chloride content generates elevated tensile stress in the deposit. Sulfamate chemistry produces low-stress coatings superior for components undergoing post-plating stamping, bending, or ultrasonic tab folding.
| Bath Chemistry | Nickel Concentration (g/L) | Current Density (A/dm²) | Deposition Rate (µm/min) | Internal Stress State (MPa) |
|---|---|---|---|---|
| Watt’s Nickel Solution | 70 – 90 | 3.0 – 6.0 | 0.6 – 1.2 | 120 – 200 Tensile |
| Nickel Sulfamate | 75 – 105 | 4.0 – 15.0 | 0.8 – 3.2 | 0 – 50 Tensile |
| Fluoroborate Nickel | 70 – 100 | 5.0 – 12.0 | 1.0 – 2.5 | 80 – 150 Tensile |
| Chloride-Free Sulfamate | 80 – 110 | 2.0 – 10.0 | 0.4 – 2.0 | 10 – 30 Compressive |
Boric acid serves as a buffering agent, keeping local pH at the cathode boundary within 3.8 and 4.4. When cathodic pH rises above 5.0 due to excessive hydrogen evolution, nickel hydroxide precipitates directly into the micro-structure, forming brittle, dark deposits with compromised electrical conductivity.
Tooling geometry alters throwing power. Bath additives like organic brighteners alter crystal growth kinetics, producing refined grain structures that increase optical reflectivity and hardness. Excessive organic brighteners increase internal electrical resistance across terminal contact interfaces and embrittle the layer during cell module assembly.
In aqueous electroplating solutions, uniform cathode geometry matters more for edge thickness control than minor adjustments to surfactant concentration.
Agitation velocity through eductor nozzles or continuous fluid sparging flattens the diffusion boundary layer thickness from roughly 100 µm down to under 15 µm. This rapid ionic replenishment permits operating at higher current densities without causing dendrite formation or powdery burnt edges on copper strip limits. Thermal regulation holds the bath within a 50°C to 60°C window to balance ionic conductivity against solution evaporation and drag-out losses.
The plating vendor attributes local thickness variations along the strip edge to unpreventable solution agitation turbulence across the rack fixtures.


Gage
Non-destructive verification of surface coating dimensions demands precise spectral calibration and alignment of primary X-ray beam spot sizes. Quantifying thin film layers on high-conductivity metallic substrates presents severe measurement challenges due to backscatter interference, fluorescence emission overlap, and instrument drift. Quality control protocols combine non-destructive optical techniques with destructive chemical stripping to validate thickness across incoming production lots.
Photonic and Electromagnetic Measurement Modalities
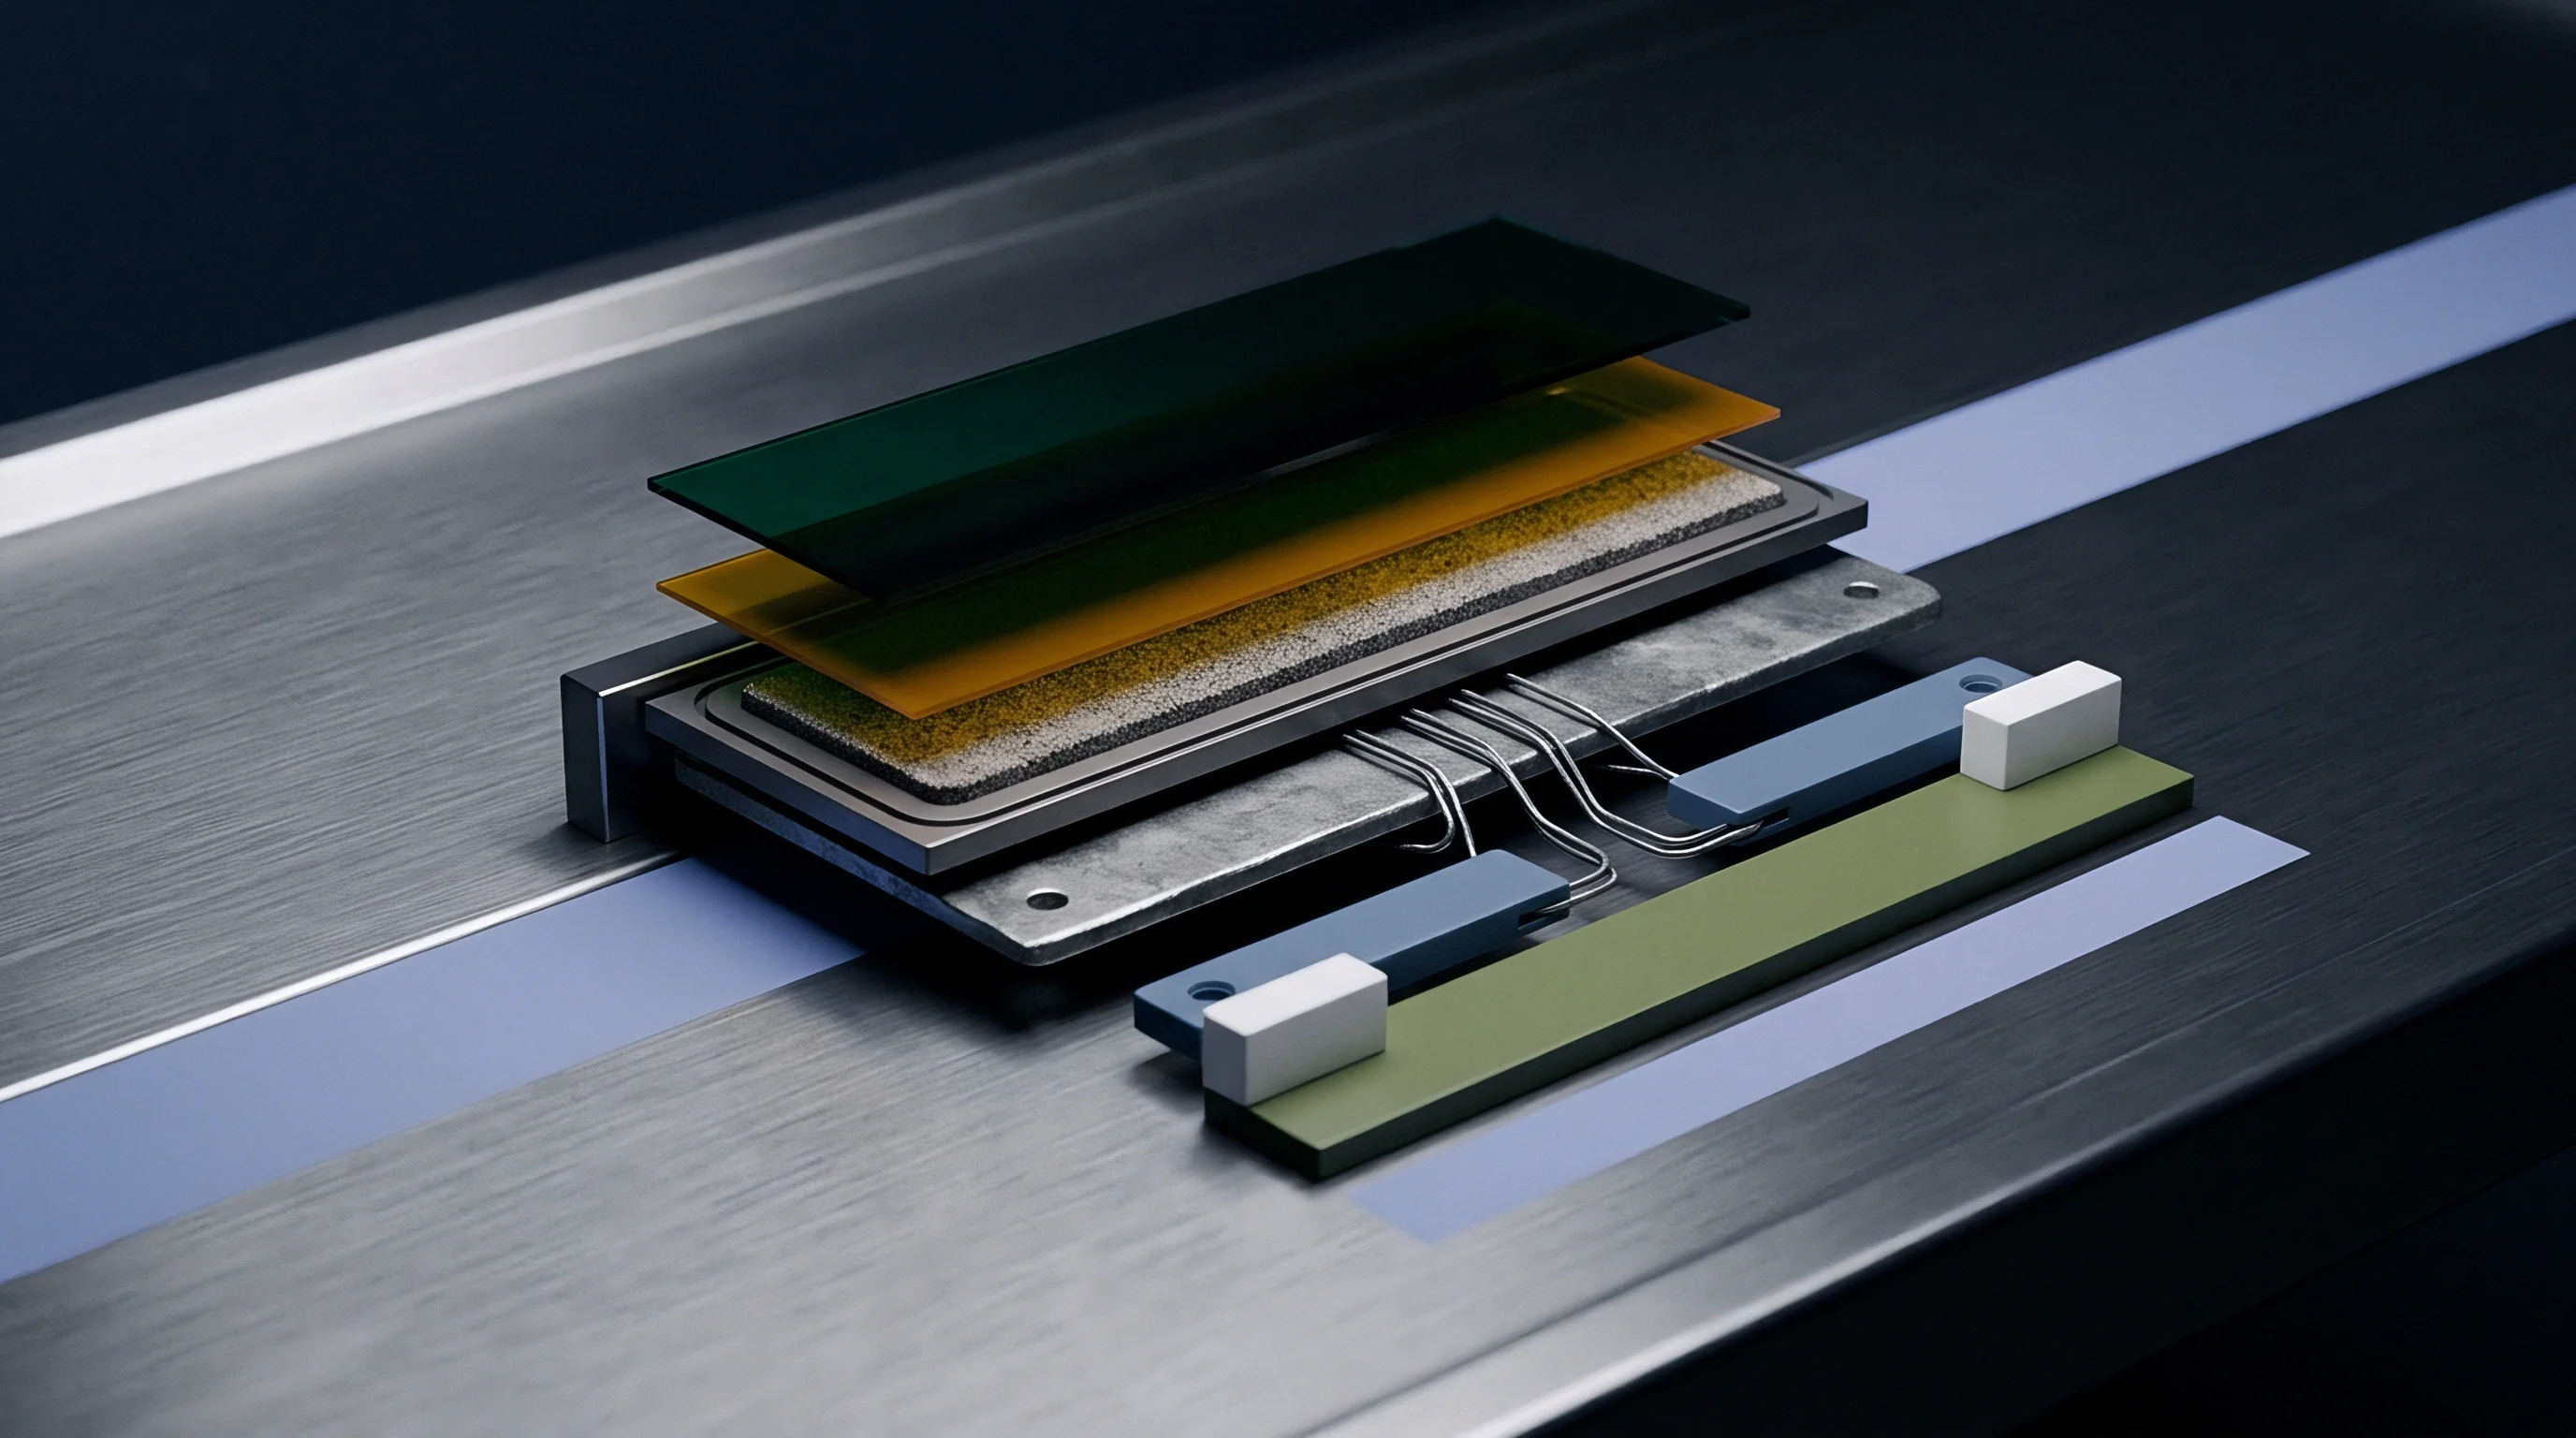
Energy-dispersive X-ray fluorescence spectroscopy relies on measuring the intensity of secondary characteristic X-rays emitted when high-energy incident photons excite electrons in the nickel layer. An X-ray tube bombard the sample, generating characteristic K-alpha photon emissions at 7.47 keV for nickel and 8.04 keV for copper. Software algorithms calculate layer thickness by analyzing the attenuation of copper substrate signal alongside the emission intensity of the primary nickel peak.
Substrate roughness shifts readings. XRF beams demand calibration. Secondary standards prevent drift.
Uncompensated drift ruins calibration. When nickel thickness falls below 0.5 µm, the characteristic emission intensity scales linearly with coating mass per unit area. Above 10 µm, signal saturation occurs as secondary photons generated deep within the layer suffer self-absorption before reaching the SDD detector assembly.
Magnetic induction and eddy current gage heads offer portable, non-destructive alternatives for shop-floor thickness checking on heavy copper busbars. Magnetic methods require non-magnetic coatings over ferromagnetic substrates, limiting direct application on copper unless multi-frequency phase-sensitive eddy current instruments are specified. These electromagnetic gages measure skin-depth impedance changes, but remain vulnerable to variations in copper substrate electrical conductivity, alloy temper, and substrate thickness changes below 0.5 mm.
- Substrate Alloy Backscatter Shift occurs when high-purity copper backscatters secondary photons into the nickel energy window, distorting peak integration algorithms if uncorrected.
- Collimator Spot Size Divergence causes primary X-ray beam spillover beyond strip sample boundaries, diluting secondary emission counts and underreporting peak layer depth.
- Calibration Foil Oxidation degrades reference standards over time, shifting baseline intensity ratios during daily instrument spectral normalization protocols.
- Infinite Thickness Saturation occurs when coatings exceeding 20 µm absorb backscattered primary emissions completely, blinding fluorescent detection to deeper substrate interfaces.

Destructive Metallographic and Coulometric Dissolution Controls
Verification of non-destructive spectral measurements proceeds through physical cross-sectioning and chemical stripping methods that isolate atomic transport layers. Coulometric anodic dissolution measures total charge consumed while electrolytically stripping a defined surface area bounded by a rubber gasket seal. Applying a constant current while tracking cell voltage spikes identifies the transition point where the underlying copper substrate becomes exposed.
| Measurement Method | Standard Reference | Typical Range (µm) | Precision Error (%) | Destructive Class |
|---|---|---|---|---|
| X-Ray Fluorescence (XRF) | ASTM B568 | 0.05 – 50.0 | ± 2.5 | Non-destructive |
| Coulometric Dissolution | ASTM B504 | 0.20 – 50.0 | ± 1.5 | Destructive |
| Cross-Sectional SEM | ASTM B487 | 0.50 – 100.0 | ± 1.0 | Destructive |
| Magnetic Induction | ISO 2178 | 1.00 – 100.0 | ± 5.0 | Non-destructive |
Cross-sectional metallography involves mounting sample cuts in resin, grinding with silicon carbide papers, polishing with diamond suspensions down to 0.05 µm, and inspecting under scanning electron microscopy. Etching the polished cross-section with an ammonium hydroxide and hydrogen peroxide solution reveals the discrete boundary interface between copper and nickel, eliminating edge rounding artifacts under high magnification.
Non-compliance with ASTM B568 spectral isolation limits invalidates XRF thickness certifications and transfers re-inspection costs to the plating vendor.
Cross sections reveal true depth. Optical microscopy cross-sectioning under ASTM B487 struggles with layer thicknesses below 1.5 µm due to light diffraction limits. SEM measurement eliminates optical diffraction bounds, delivering spatial resolutions capable of resolving sub-micron strike layers with nanometric precision.
Section 8.2 of ISO 3497 mandates dual-reference calibration curves for layered metallic substrates, forcing suppliers to absorb additional standard foil certification costs prior to lot release.


Pore
Continuity defects within the electrodeposited nickel matrix create micro-galvanic cells that accelerate localized corrosion of underlying copper substrates when exposed to elevated humidity. Sub-micron voids, micro-cracks, and pinholes undermine the protective barrier, leading to green copper carbonate bloom and contact resistance spikes during long-term life testing. Coating thickness directly correlates with pore reduction, but bath cleanliness and substrate preparation dictate absolute continuity.

Which Non-Destructive Test Correctly Maps Micro-Porosity Pinholes?
Optical imaging coupled with high-resolution scanning acoustic microscopy isolates structural void channels down to single-micron cross-sections without damaging the tab surface. High-frequency ultrasonic transducers (100 MHz to 300 MHz) reflect acoustic waves off the nickel-copper interface, detecting acoustic impedance drops caused by sub-surface delamination or unplated microscopic pinholes.
Pinholes accelerate galvanic attack. Chemical verification relies on ferroxyl gel testing or sulfur dioxide exposure per ASTM B735. In ferroxyl testing, an reagent-impregnated paper pressed against the plated copper substrate develops distinct blue spots where underlying copper ions react through microscopic coating pores.
- Intermetallic Phase Voiding develops at elevated temperatures as copper diffuses faster into nickel than nickel into copper, creating sub-surface Kirkendall voids that trigger layer delamination.
- Micro-Pinhole Galvanic Attack occurs at coating discontinuity sites where exposed copper corrodes preferentially in humid environments, pushing copper oxide plumes up through the plating.
- Ultrasonic Bond Shearing happens when non-uniform nickel layers cause irregular acoustic energy attenuation during tab welding, yielding erratic joint shear strength.
- Contact Resistance Spikes emerge when copper oxide bleeds through porous nickel networks, raising terminal tab interface impedance and driving localized thermal runaway during high-rate discharge.

Thermal Aging and Intermetallic Interdiffusion Rates
Exposure to elevated operational temperatures drives atomic movement across the nickel-copper interface, generating brittle intermetallic compounds that alter electrical contact resistance. At temperatures above 125°C, mutual solid-state diffusion forms intermetallic phase bands, predominantly Cu3Ni or Cu5Ni5, depending on local stoichiometric concentration and thermal dwell times. Micro-cracks degrade shear strength.
Thermal stress causes delamination.
Diffusional transport follows Fick’s laws, where interdiffusion coefficients scale exponentially with operating temperature. Thin nickel coatings under 1.0 µm fully convert to copper-nickel intermetallic solutions after extended thermal cycling, stripping away the inert surface layer and exposing copper directly to atmospheric oxidation.
A nickel layer thickness of 2.5 µm on C11000 copper exhibits an electrical contact resistance below 0.12 mΩ under a 50 N clamp force after 1,000 thermal shock cycles.
Laser weldability depends heavily on maintaining uniform nickel thickness across joint interface zones. Variations in nickel coating depth alter optical absorption coefficients at near-infrared laser wavelengths (1070 nm), altering laser keyhole stability and spatter generation during tab-to-busbar joining operations.
Sub-micron layer deficits allow copper diffusion to reach the tab surface during thermal cycling, degrading ultrasonic weld shear strength and triggering pack recall liability.


Arithmetic
Electrochemical mass deposition obeys strict stoichiometry governed by charge transport efficiency and current distribution across the submerged cathode area. Calculating theoretical mass accumulation against actual XRF-measured thickness provides direct operational insight into bath health, cathode efficiency, and web line speed calibration. Discrepancies between theoretical mass gain and measured depth highlight unrecorded current leakage, rack shadowing, or fluid circulation stagnation.

Faradaic Yield and Line Speed Calculations
Mass accumulation of electrodeposited nickel per unit area scales linearly with total charge delivered according to Faraday’s law of electrolysis. Faraday laws govern deposition. Thicker coatings increase cost.
To derive theoretical thickness, calculate total current passed, cathode efficiency, deposit density, and active submerged area. Assume a continuous roll-to-roll double-sided copper strip plating line running C11000 copper strip with a width of 50 mm (0.05 m). The target nickel thickness on each side is 2.5 µm (2.5 × 10⁻⁴ cm).
The nickel plating bath operates at a total current density of 5.0 A/dm² (500 A/m²) with a cathode current efficiency of 96 percent. The density of electrodeposited nickel is 8.90 g/cm³, and the electrochemical equivalent of divalent nickel (Ni²⁺) is 0.304 mg/C (1.095 g/A·h).
The total cathodic charge required per square centimeter to yield 2.5 µm per side follows: Mass per unit area = Thickness × Density = 2.5 × 10-4 cm × 8.90 g/cm3 = 2.225 × 10⁻³ g/cm2 Accounting for cathode current efficiency (η = 0.96), the actual charge density (Qactual) required per unit area is: Qactual = fracMassElectrochemical Equivalent × η = frac2.225 × 10-3 g/cm23.04 × 10-4 g/C × 0.96 = 7.624 C/cm2 At an applied current density (J) of 5.0 A/dm² (0.050 A/cm2), the necessary dwell plating time (t) in the electrolyte tank evaluates to: t = fracQactualJ = frac7.624 C/cm20.050 A/cm2 = 152.5 seconds If the physical length of the active cathodic plating tank is 4.0 meters, the maximum allowable web line speed (v) to achieve target thickness is: v = fracTank Lengtht = frac4.0 m152.5 s × 60 s/min = 1.57 meters/miνte
When XRF inspection of the output strip returns an average thickness of only 2.1 µm despite holding a line speed of 1.57 m/min, the effective cathode efficiency has fallen from 96 percent down to 80.6 percent. This efficiency drop signals parasitic hydrogen evolution caused by organic contamination or acid concentration imbalance in the electrolyte.

Statistical Tolerances for High Volume Busbar Strips
Process capability evaluation uses Cpk metrics to assess line stability across large manufacturing batches. Defining upper specification limits (USL) at 3.5 µm, lower specification limits (LSL) at 1.5 µm, and target thickness at 2.5 µm ensures component compatibility during ultrasonic welding. Process control demands rigor.
| Line Speed (m/min) | Current Density (A/dm²) | Cathode Efficiency (%) | Target Thickness (µm) | Calculated Plating Time (s) |
|---|---|---|---|---|
| 1.00 | 3.0 | 95.0 | 2.50 | 257.0 |
| 1.57 | 5.0 | 96.0 | 2.50 | 152.5 |
| 2.00 | 7.0 | 94.0 | 2.50 | 111.4 |
| 2.50 | 10.0 | 92.0 | 2.50 | 80.0 |
| Assumes double-sided C11000 copper strip plating in nickel sulfamate solution; active cathode tank length fixed at 4.0 meters. | ||||
Executing incoming quality control on batch shipments requires systematic step-by-step XRF calibration verification before measuring production samples.
- Power on the energy-dispersive X-ray fluorescence system and allow detector stabilization for thirty minutes.
- Position the NIST-traceable pure copper substrate reference disk inside the target illumination chamber.
- Place a certified 2.0 µm nickel reference foil standard directly over the copper substrate disk.
- Execute twenty spectral acquisition sweeps at an X-ray tube anode voltage of 50 kV and beam aperture of 0.3 mm.
- Record peak intensity counts for nickel K-alpha emission at 7.47 keV and verify baseline deviation remains within ± 1.0 percent.
- Store calibration coefficients in the measurement dossier and seal the reference standards in an argon-purged desiccator.
Density assumptions introduce error. Software calculations assume standard bulk material density (8.90 g/cm³), but electrodeposited films containing grain boundary voids or micro-porosity display reduced density down to 8.50 g/cm³. This density deficit leads XRF intensity algorithms to underreport physical film thickness, triggering unneeded over-plating and excess material costs.
Substrate surface roughness directly skews X-ray fluorescence intensity measurements by scattering backscattered primary photon beams.
Maintaining bath temperature within tight bounds prevents internal stress spikes that cause plating micro-cracking and measurement scatter.

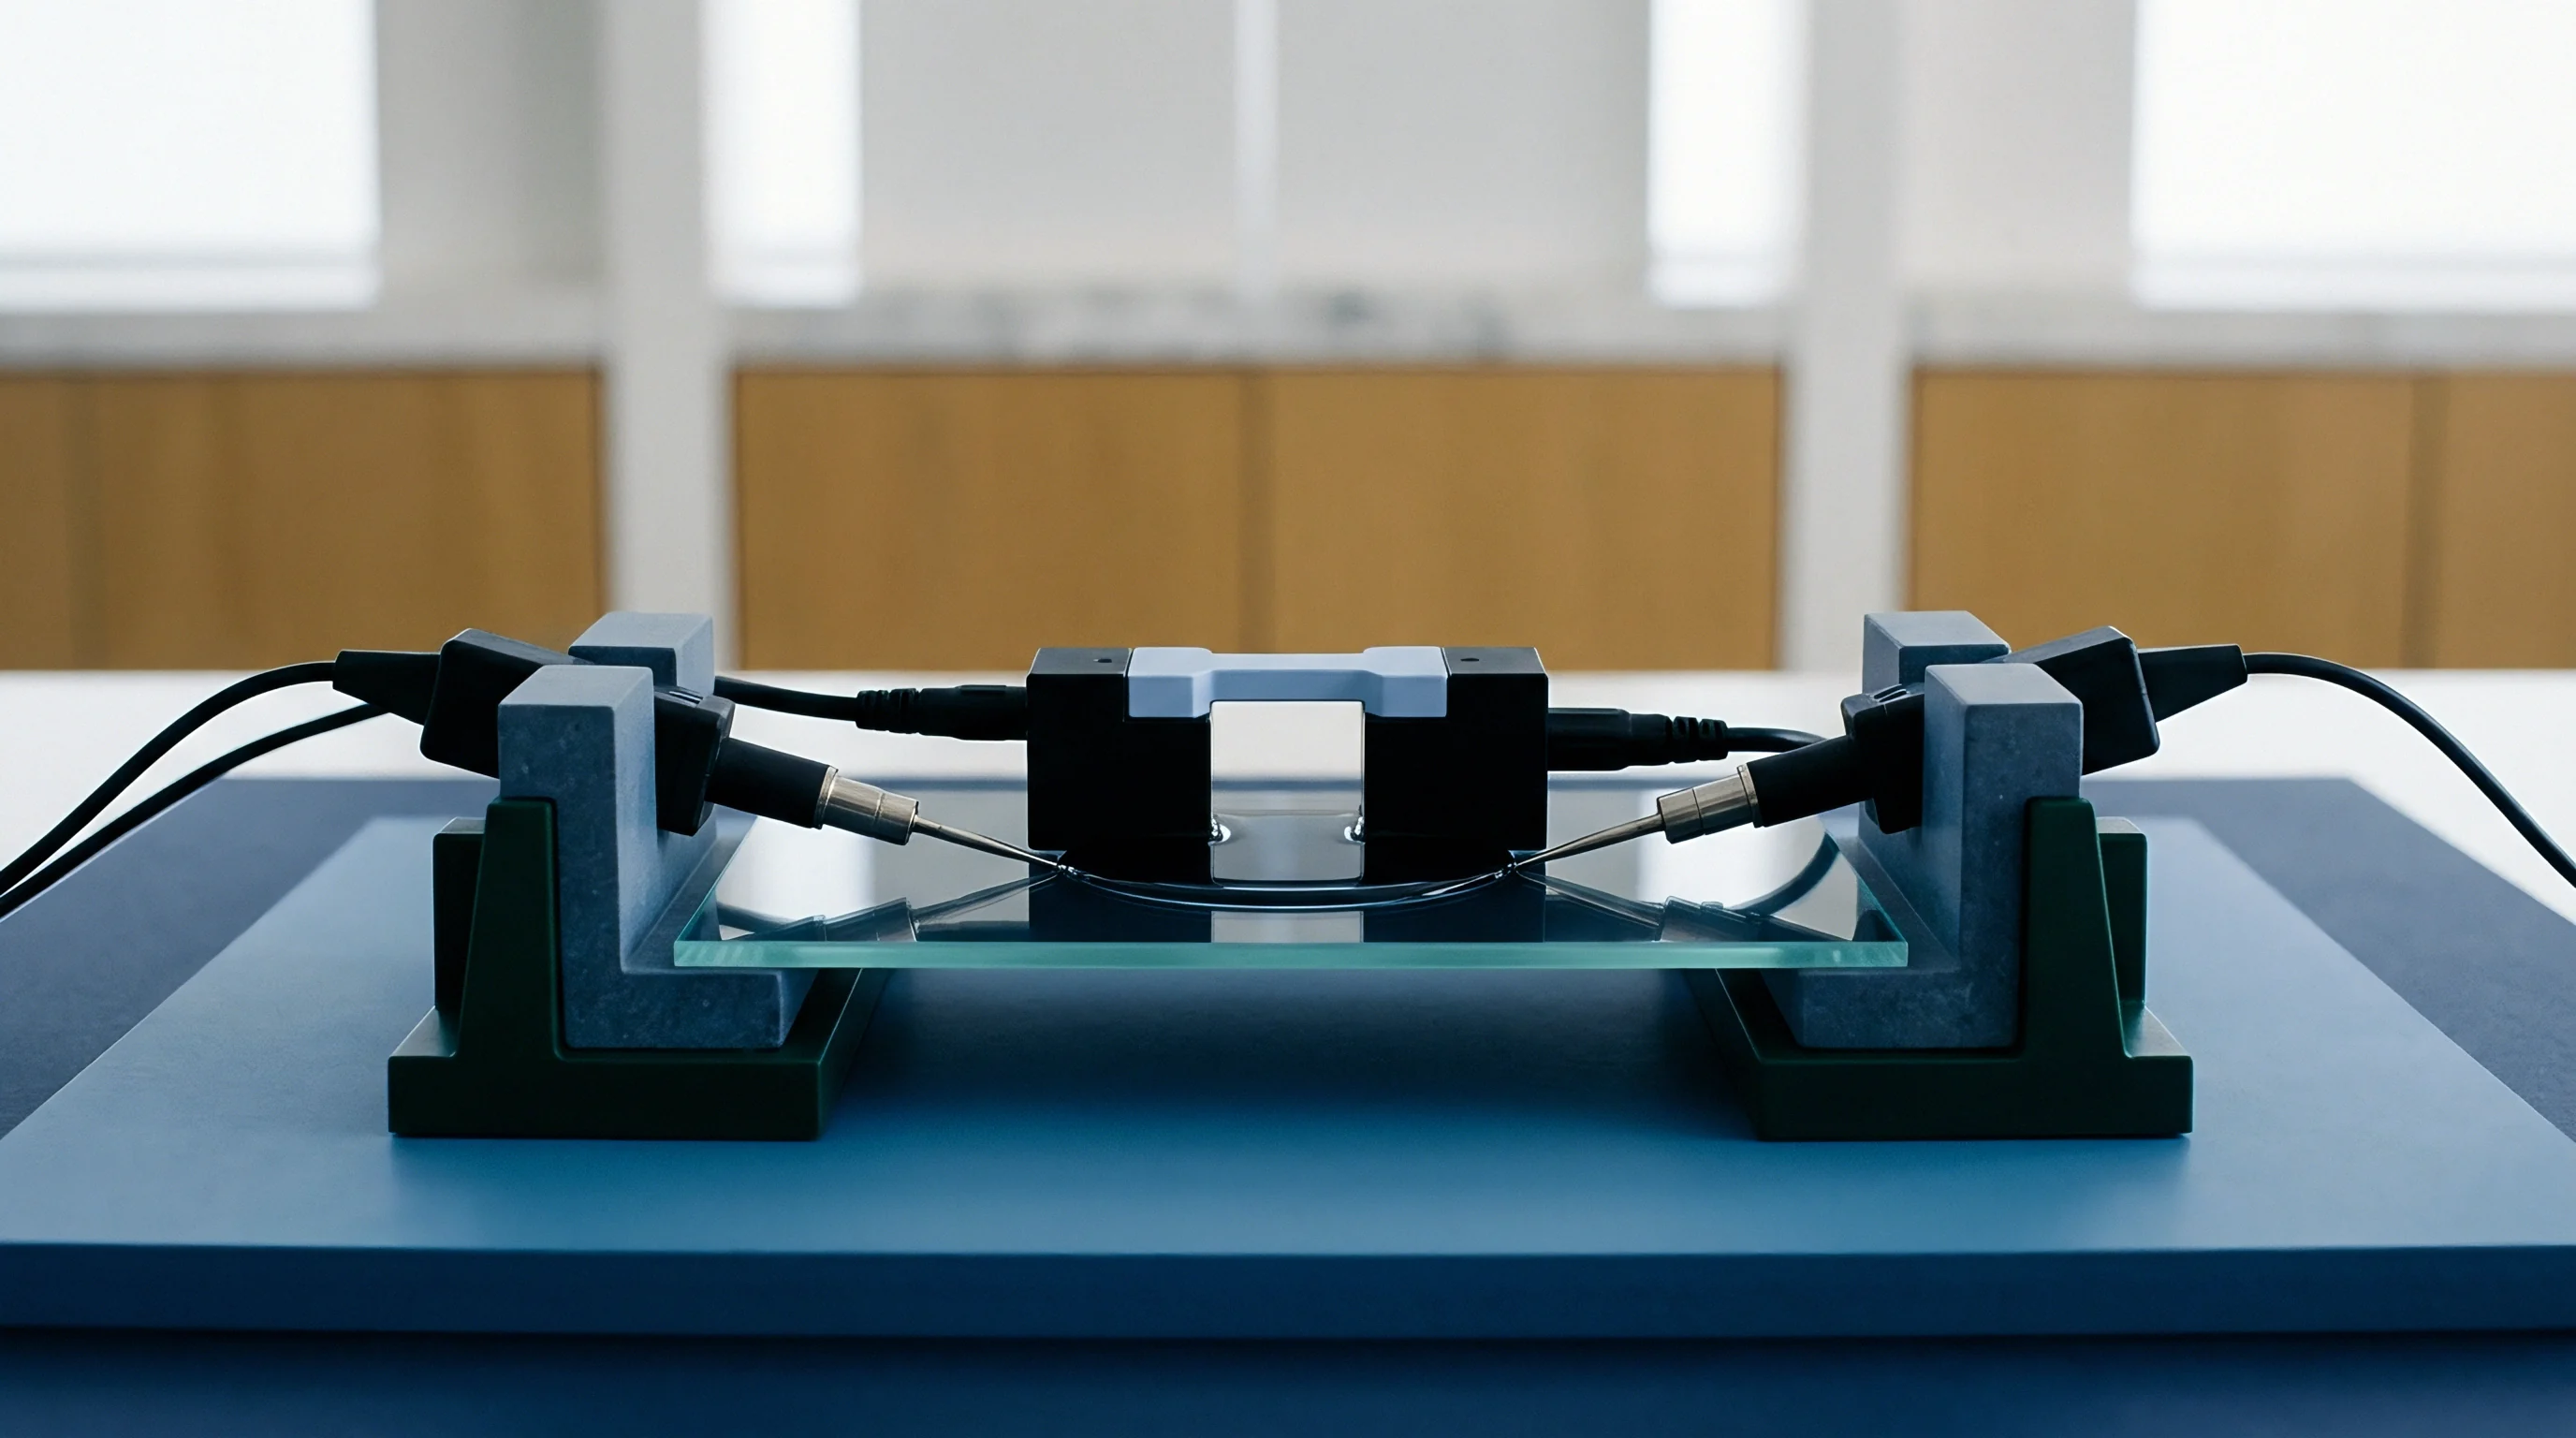
Audit
Verification of delivered plating quality demands systematic cross-examination of mill inspection certificates against secondary laboratory test protocols. Discrepancies between supplier factory release dossiers and receiving dock verification scans frequently arise from mismatched measurement standards, improper XRF collimator settings, or uncalibrated reference foils. Buyers establish clear technical limits in purchase specifications to protect against latent failure liabilities.
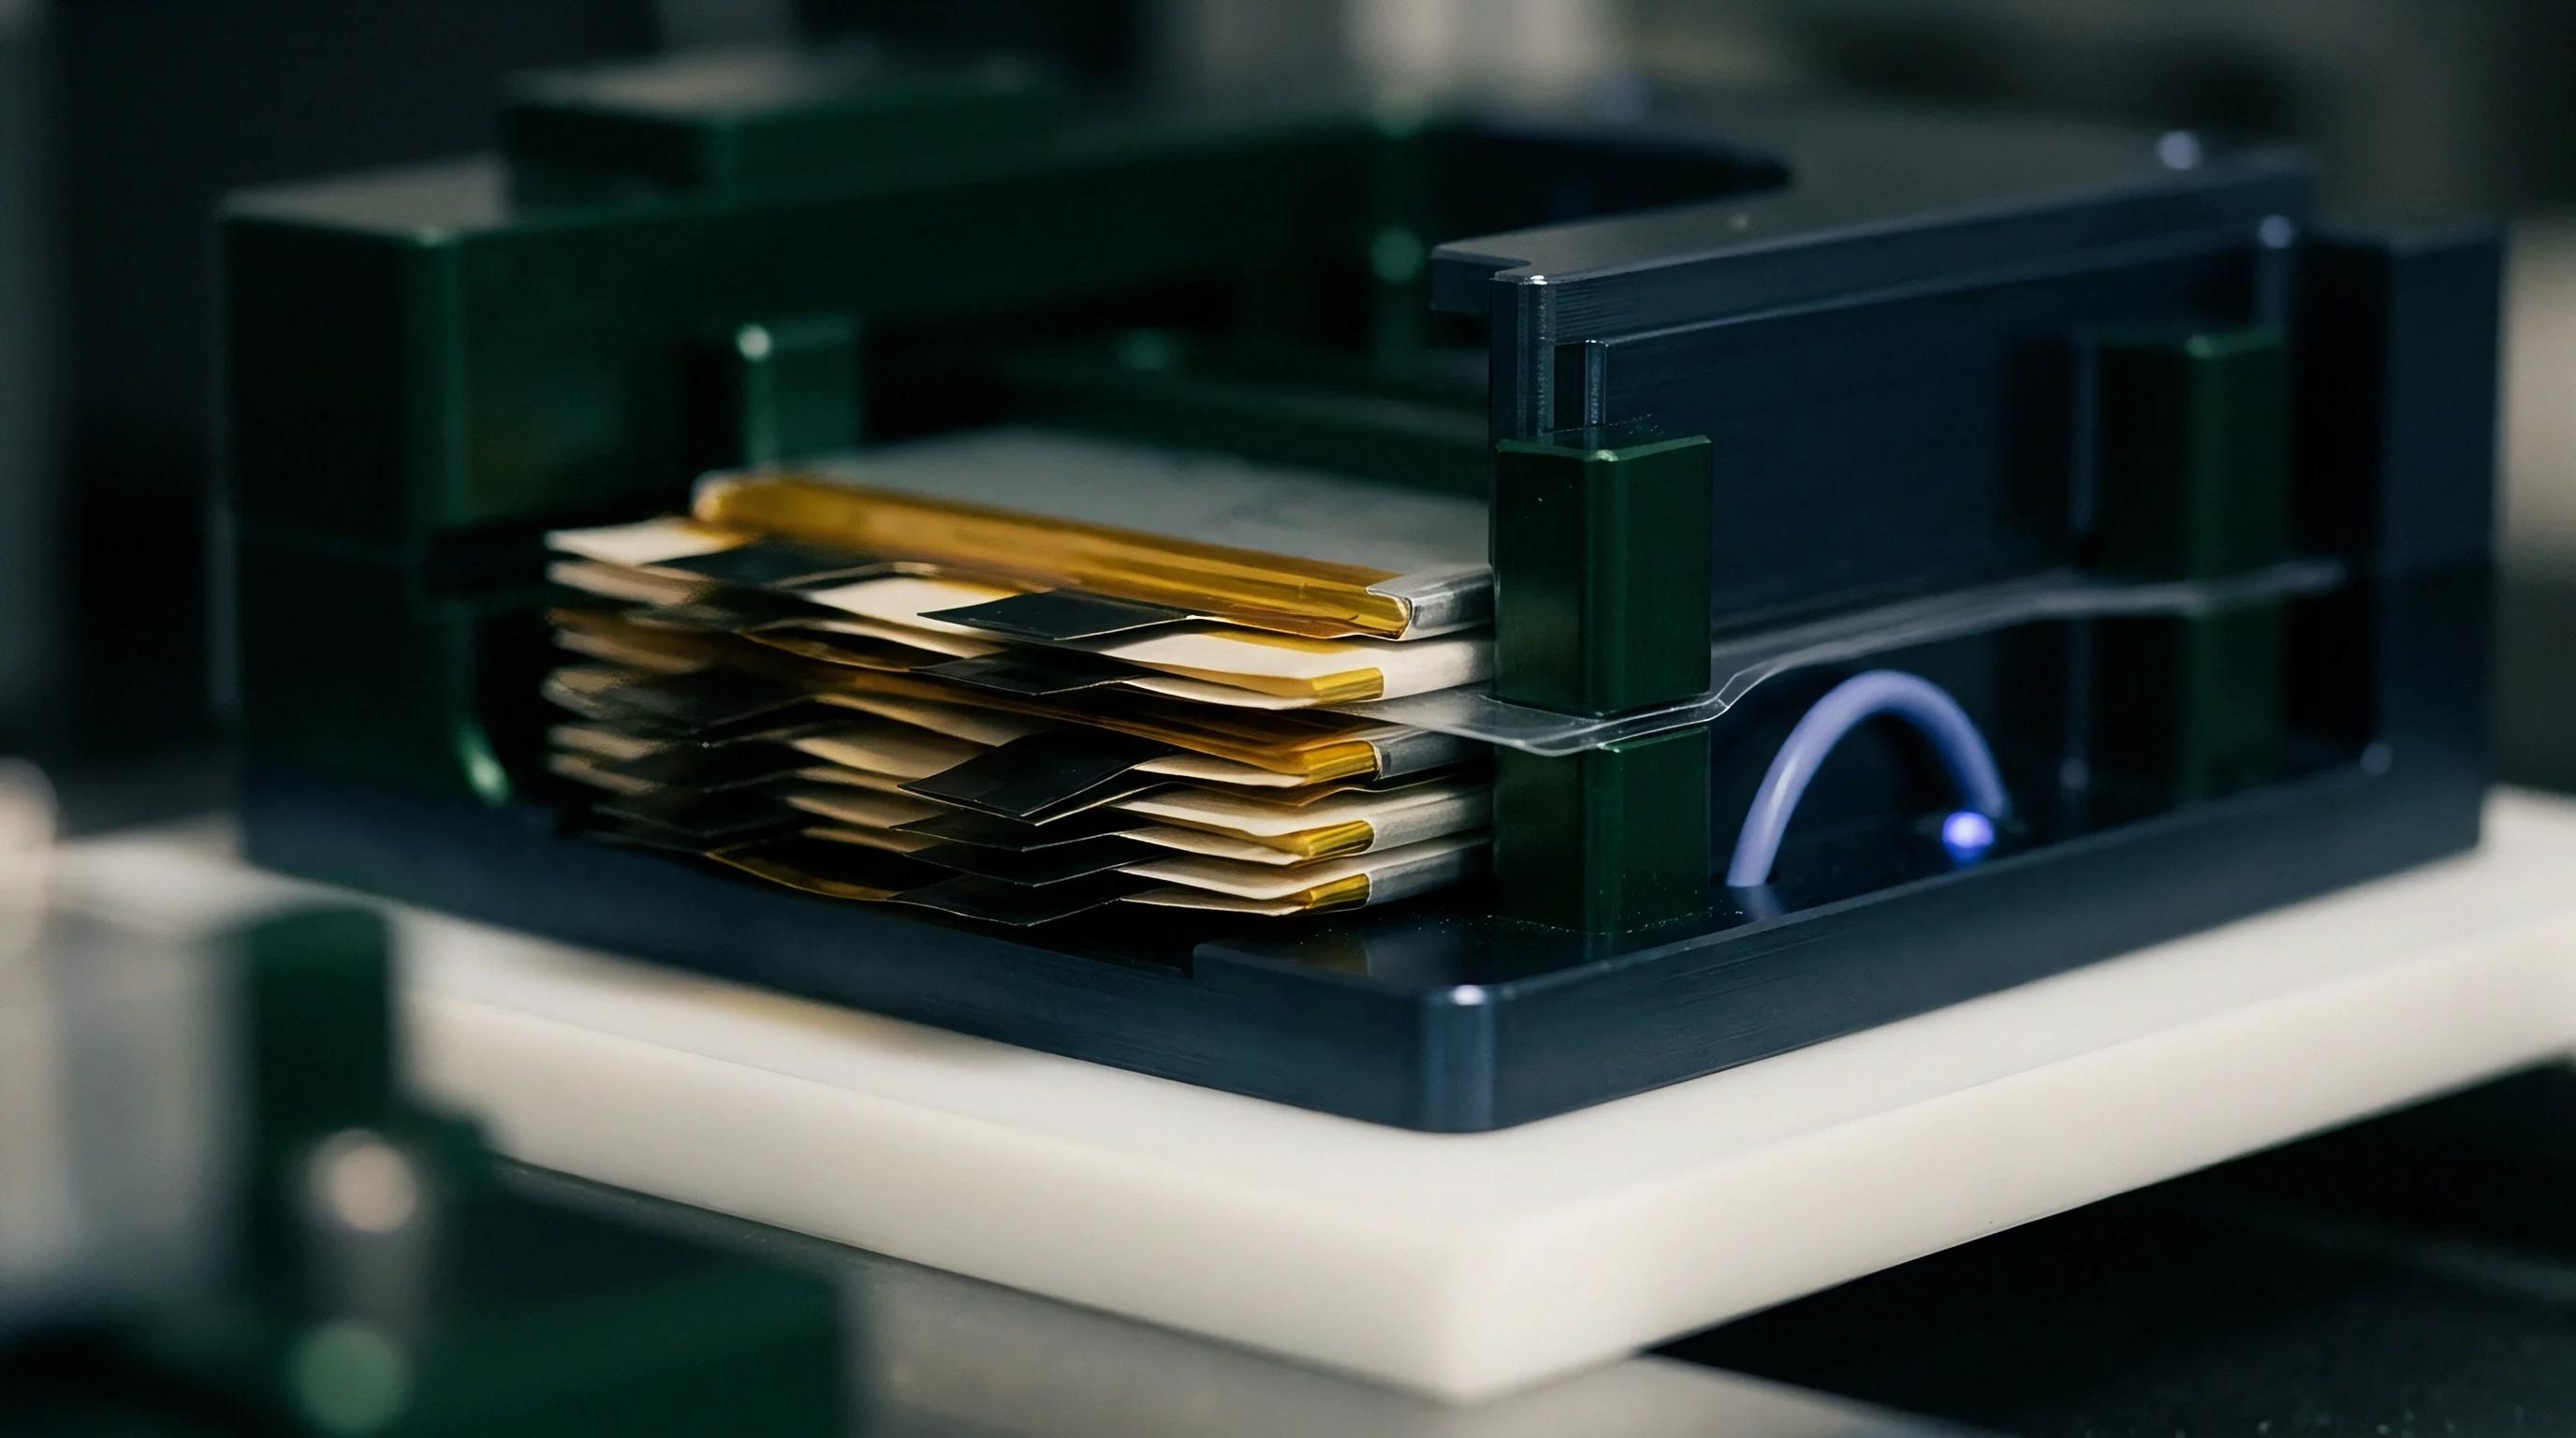
Quality Agreements and Technical Specifications
Formal procurement contracts define lot acceptance criteria based on statistical sampling plans per ISO 2859-1. Standard sampling plans establish an Acceptance Quality Limit (AQL) of 0.65 for functional thickness deficits, classifying coating thickness below LSL as a major defect that justifies lot rejection. Receiving inspection protocols enforce non-destructive XRF screening on thirty random samples per batch, with any single sample falling below critical thresholds triggering full destructive metallographic verification.
Quality documentation mandates traceability connecting coil serial numbers directly to bath chemistry logs, current density strip charts, and XRF standard calibration records. Missing bath maintenance logs or uncertified calibration foils invalidate factory material compliance statements, permitting buyers to halt incoming production lines at supplier expense.

Warranty Seams across Supply Boundaries
Responsibility for tab contact failure shifts between the raw material plater, the cell manufacturer, and the battery pack integrator depending on where layer thickness compliance is formally logged. Plating vendors guarantee bare strip compliance at factory gate dispatch, but subsequent tab stamping, laser cleaning, and cell assembly operations introduce surface mechanical abrasion and thermal exposure that alter coating integrity.
Defining clear warranty boundaries requires establishing explicit measurement protocols at each transfer interface. When a cell manufacturer executes laser terminal tab cleaning prior to welding, laser ablation parameters must avoid removing protective nickel layers beyond specified tolerance bounds, or warranty risk transfers entirely from the plater to the pack builder.
Industry consensus remains absent on whether non-destructive XRF screening on high-speed continuous production lines can fully replace destructive coulometric cross-sectioning for automotive warranty compliance files.