Quantifying Lithium Plating Signals in Isothermal Cell Cycling Tests
Quantify lithium plating signals by isolating post-charge open-circuit voltage plateaus and integrating dQ/dV stripping peaks under isothermal thermal control.
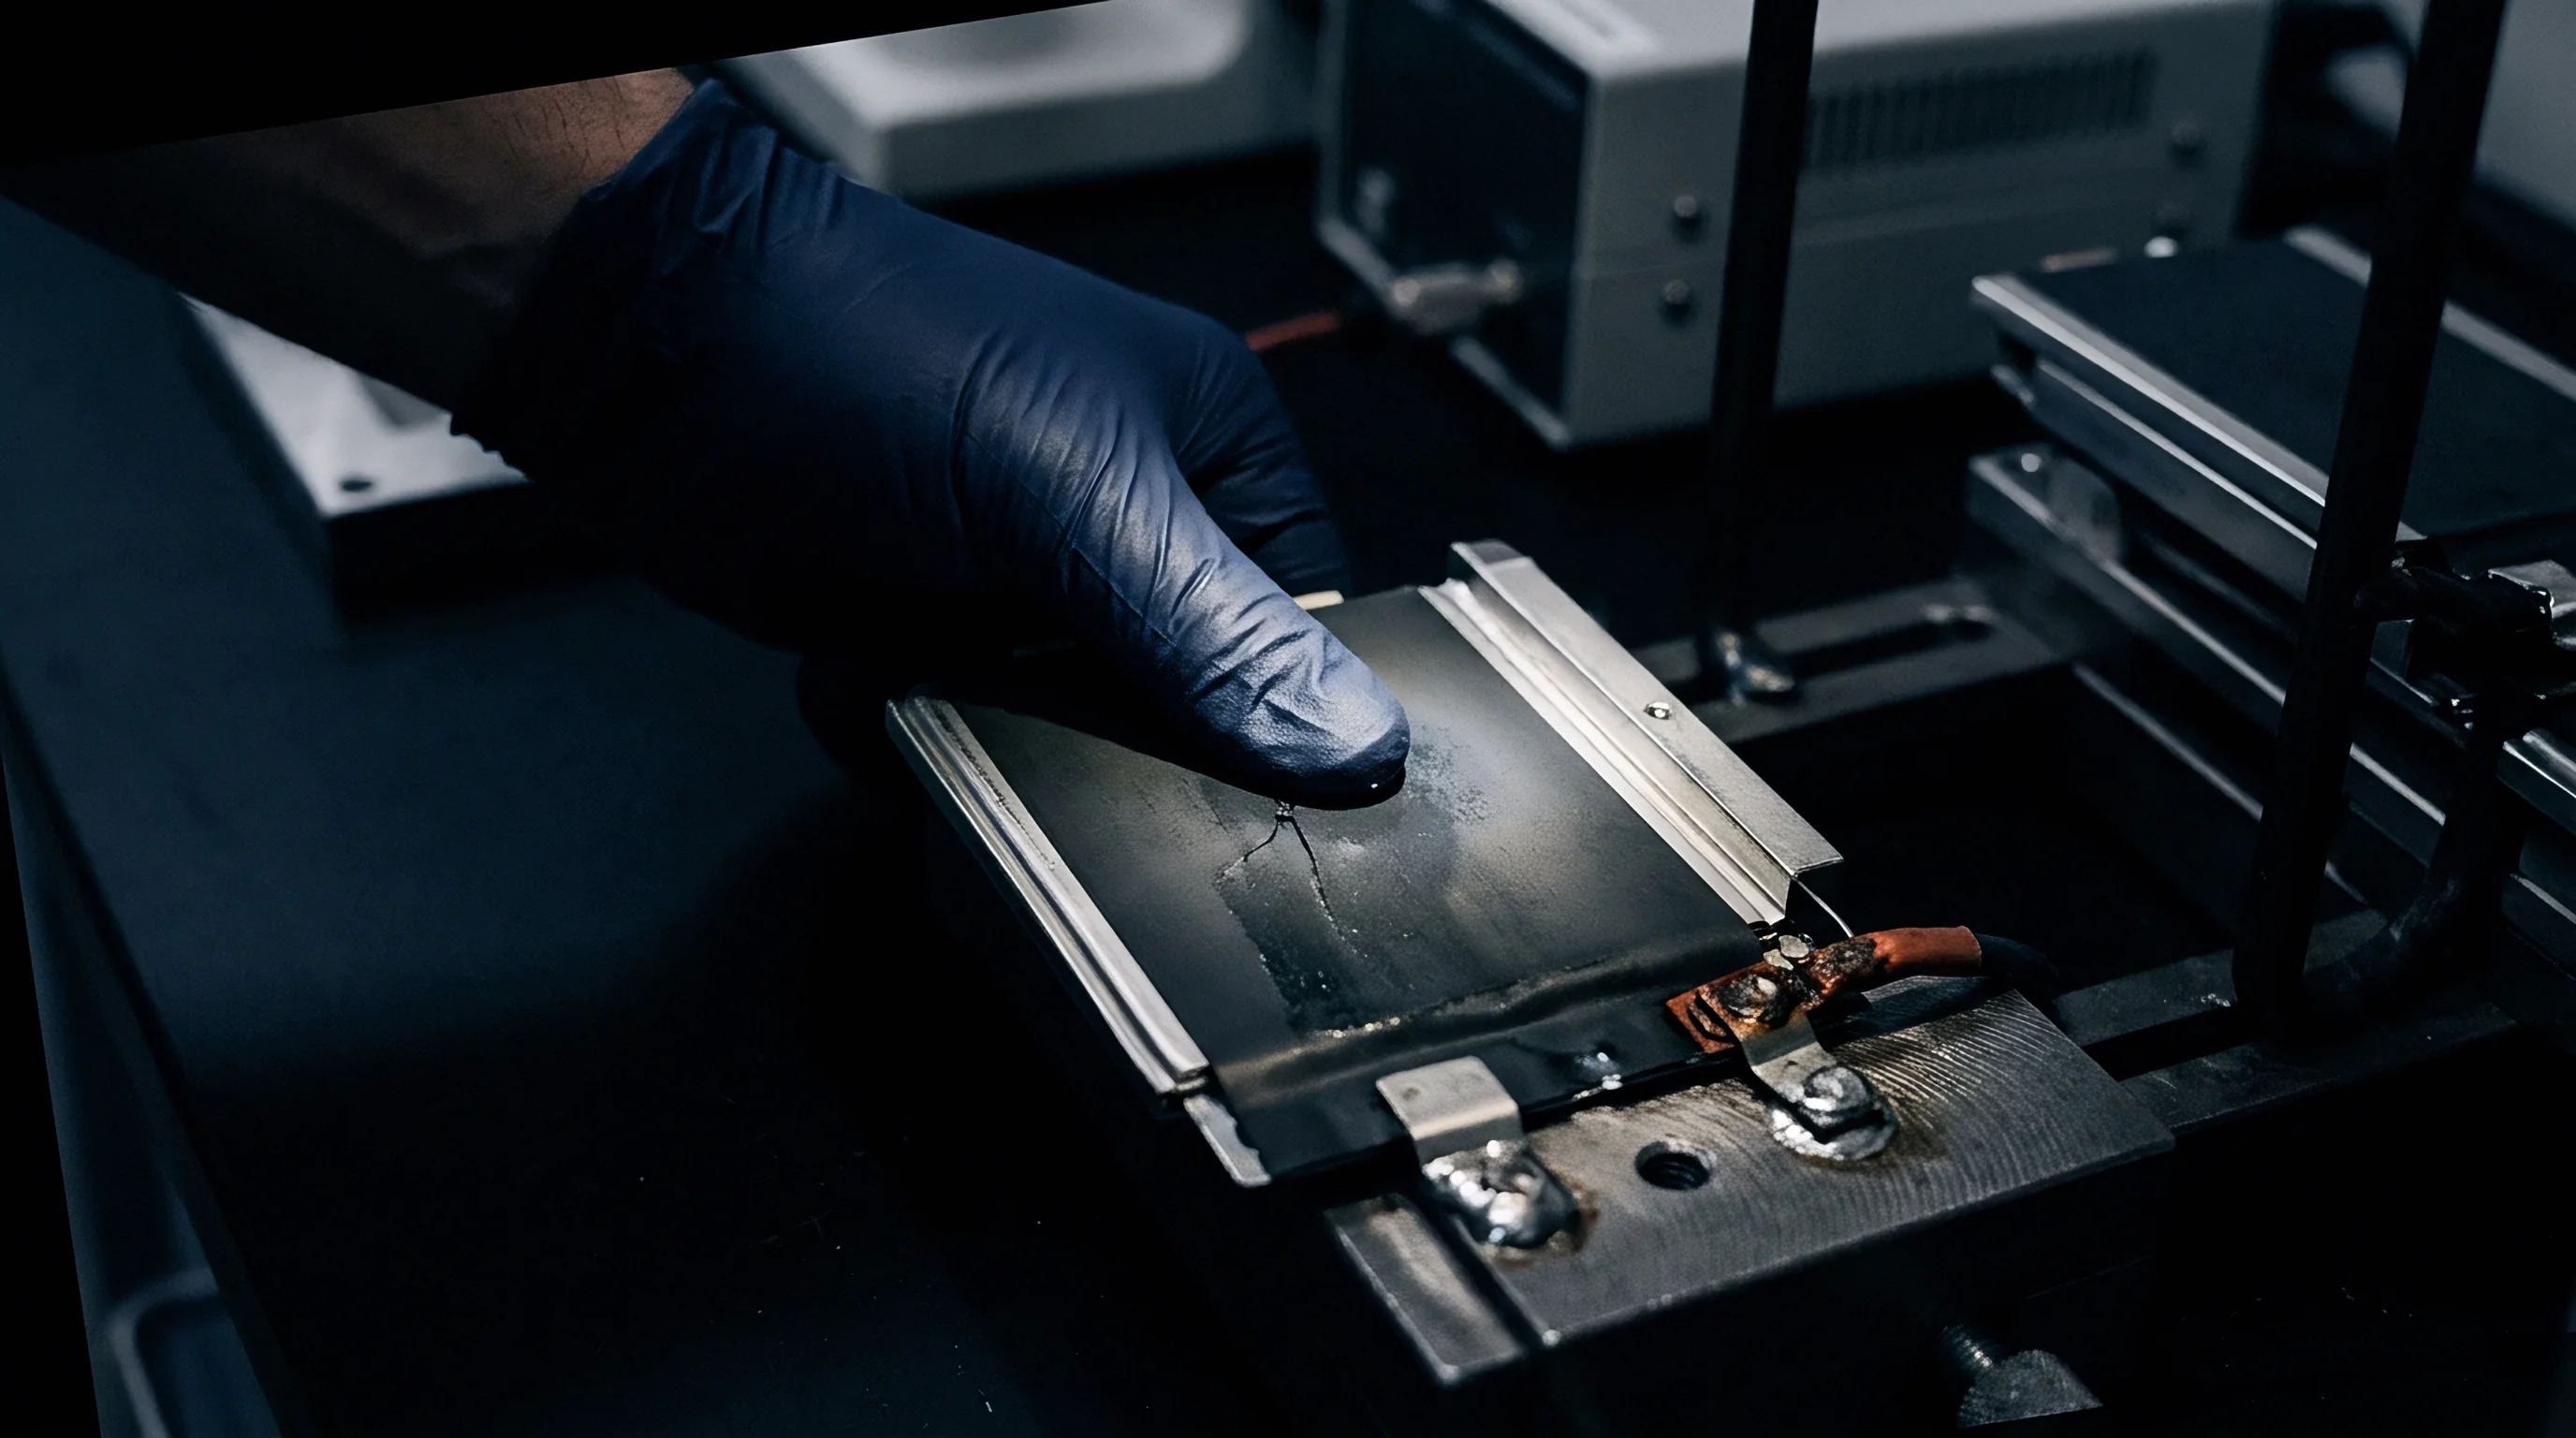

Relaxation
Maintaining a strict thermal boundary of 25.0 degrees Celsius (+/- 0.1 K) during galvanostatic cycling prevents Joule heating and entropic temperature drops from masking underlying behavior, allowing clear separation of kinetic overpotentials from true thermodynamic phase changes. When a lithium-ion cell is charged faster than graphite intercalation kinetics can handle, excess lithium ions build up at the particle surface. Should the anode potential fall below 0.0 V versus Li/Li+, metallic lithium deposits directly on the carbon matrix while intercalation continues.
Voltage decay reflects the cell’s thermodynamic state. When current stops, a cell with surface metallic lithium shows a noticeably different open-circuit voltage profile than one with only intercalated lithium. Intercalated graphite relaxes monotonically toward equilibrium as concentration gradients within the carbon particles equalize.
Plated metallic lithium, however, sets up a mixed potential between the metallic phase equilibrium and the non-equilibrium lithiated graphite, appearing as a voltage plateau or an extended shoulder early in the rest period.
- Configure the thermal chamber to 25.0 degrees Celsius with air velocity exceeding two meters per second across the cell surfaces.
- Allow a three-hour soak period to ensure internal core thermal equilibrium before starting current flow.
- Run the specified constant-current charge step while logging casing temperatures at five-second intervals.
- Cut the current instantly at the upper cut-off voltage, bypassing any constant-voltage taper phase.
- Record open-circuit voltage decay for at least two hours at a ten-Hertz sampling rate.
High-resolution cycling channels record decay potential at sample rates exceeding ten Hertz immediately after current interruption. Plotting the first derivative of voltage over time (dV/dt) during open-circuit relaxation brings out subtle changes in slope. A localized peak or inflection point in dV/dt marks the exact moment metallic lithium finishes re-intercalating or chemically dissolving into the electrolyte and carbon host.
Once the metallic phase disappears, relaxation returns to pure solid-state diffusion kinetics.
Isothermal boundary control separates kinetic voltage overpotentials from thermal EMF shifts during post-charge open-circuit holds.
Using Peltier units for precise control, the relaxation duration needed to reach the inflection point correlates directly with the mass of reversible metal plated during the preceding charge step. Shorter rests under colder isothermal holds shift thermodynamic equilibrium, altering how quickly lithium re-intercalates into the graphite layers. Measuring this inflection timing across a range of charge rates establishes the kinetic boundaries of the specific anode architecture.
Whether the subtle plateau inflections seen during sub-zero open-circuit holds stem entirely from surface metallic lithium or partly from phase transitions within non-stoichiometric graphite domains remains an open question in thermodynamic modeling.
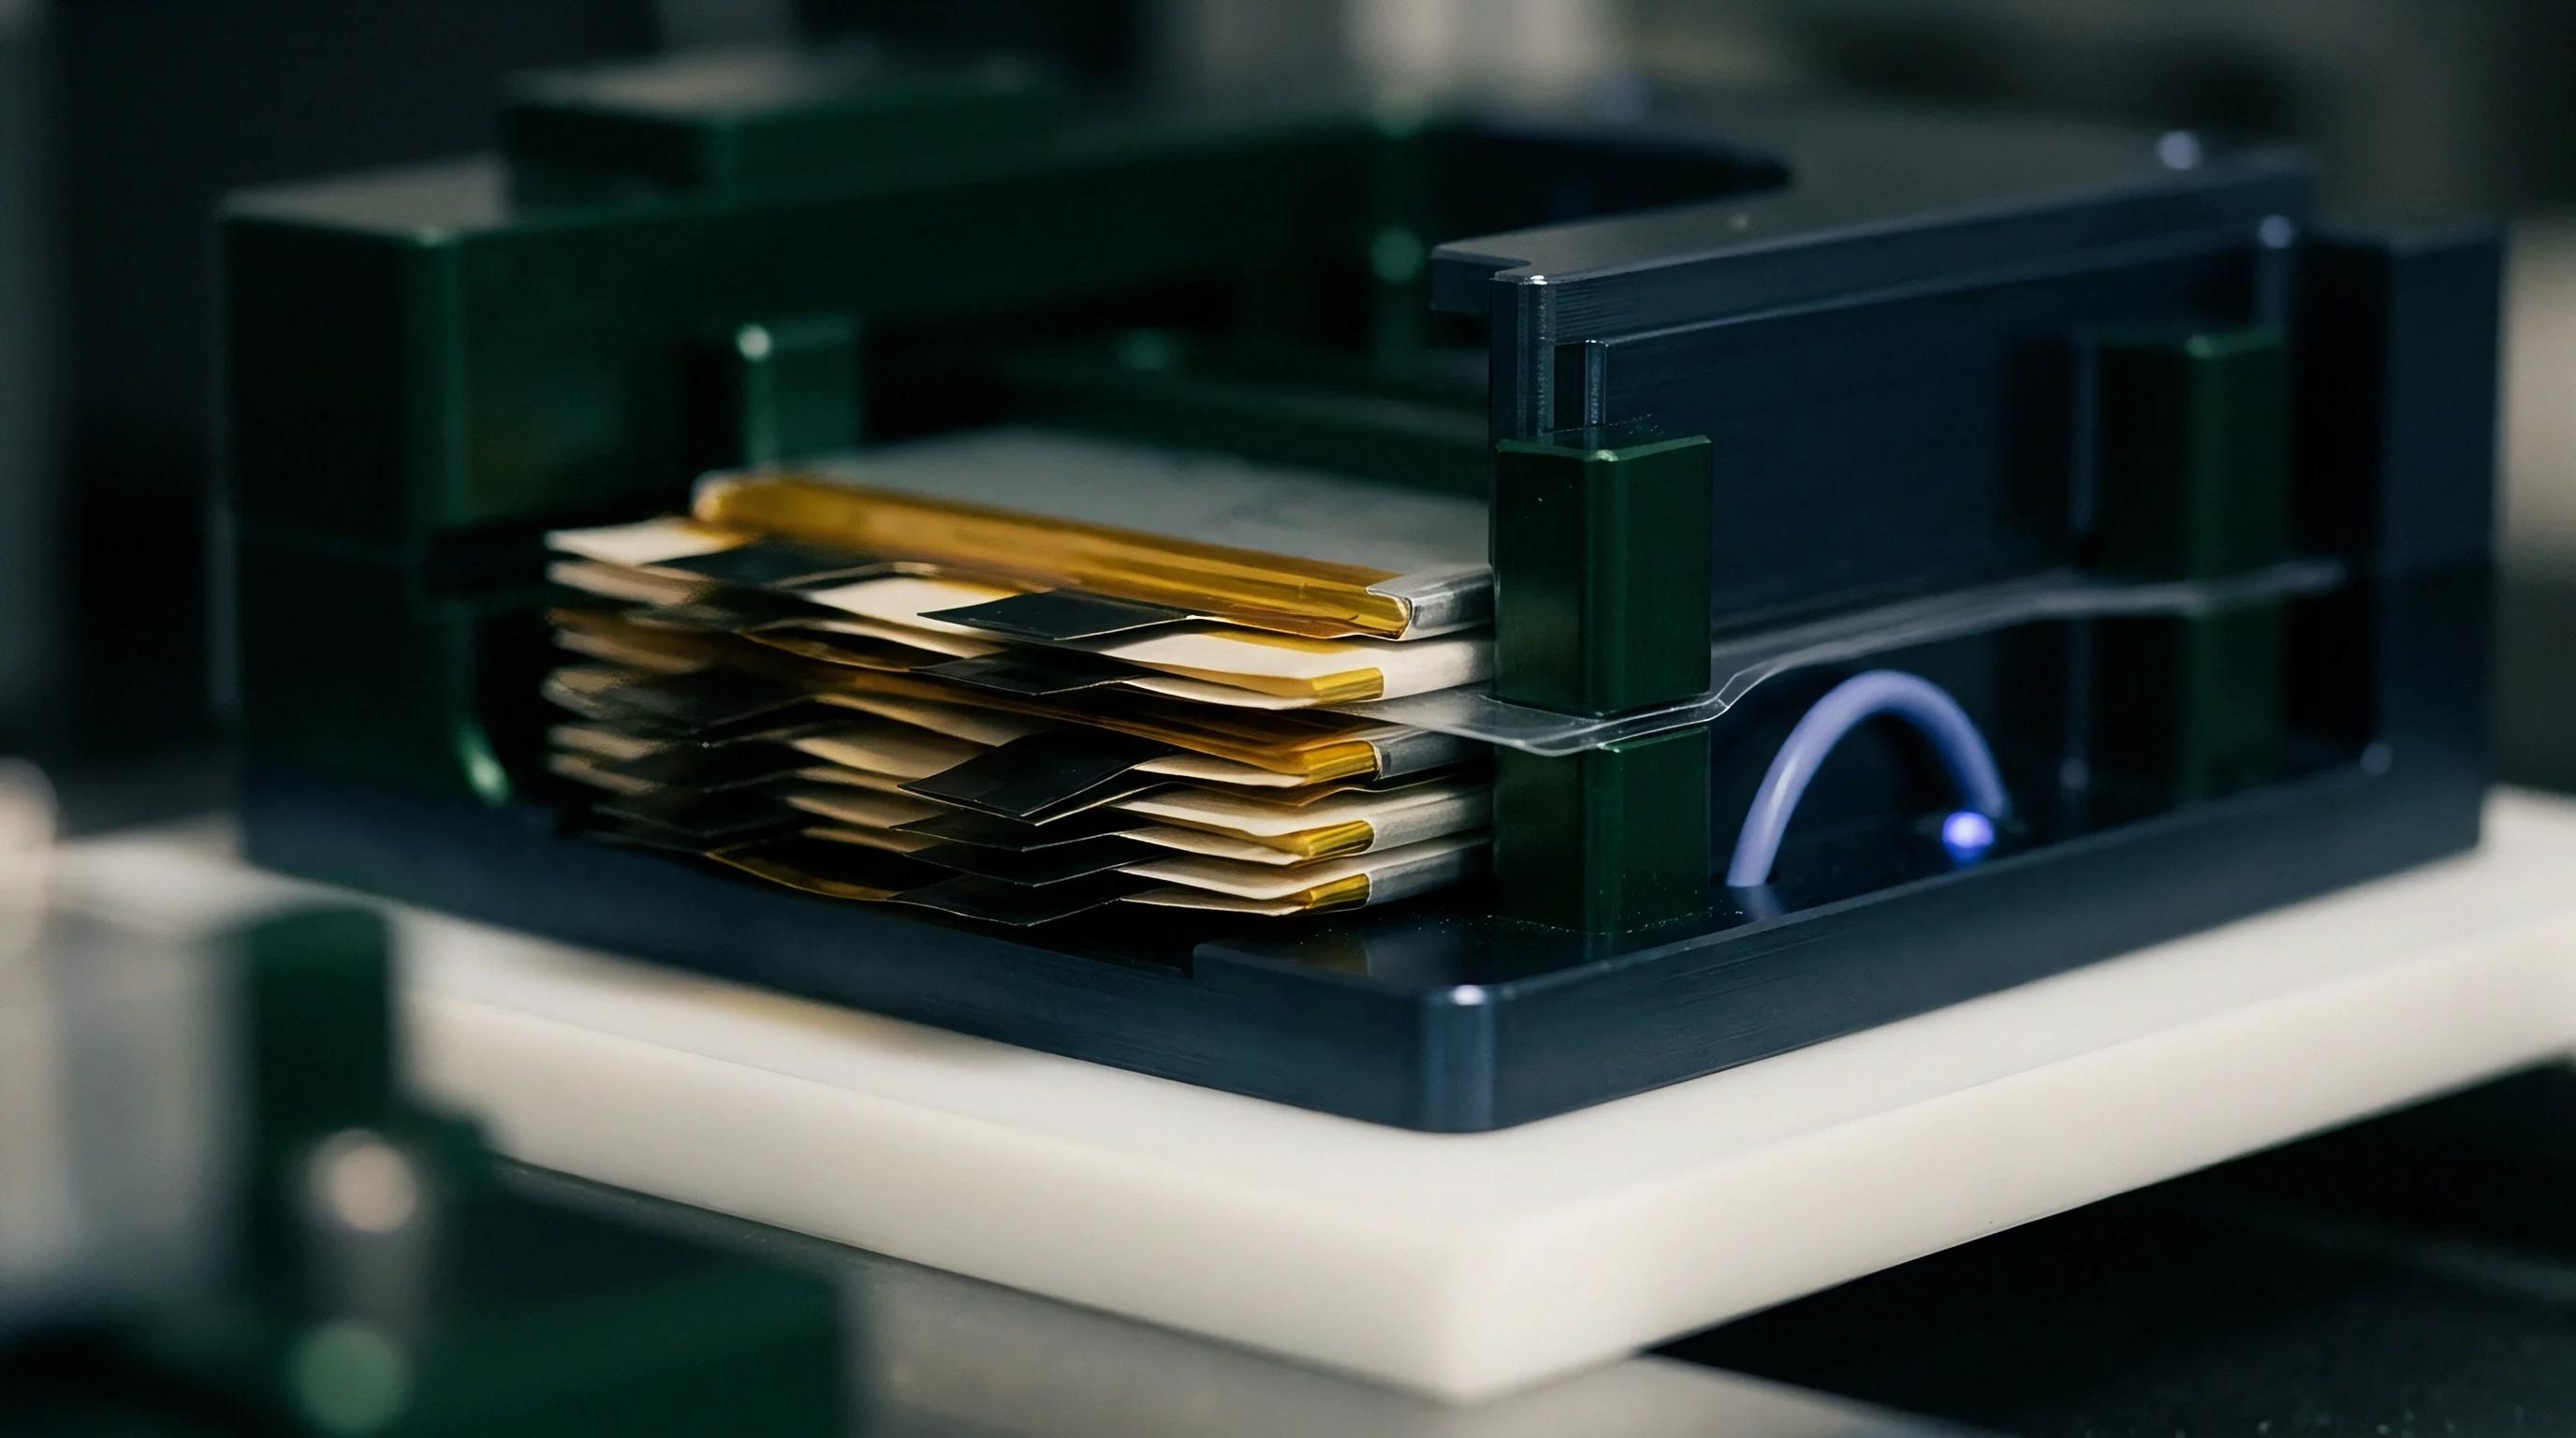

Swell
Mechanical displacement sensors placed against the outer pouch or prismatic wall measure dimensional changes down to sub-micron precision. Graphite anodes expand predictably by about ten percent in volume at full lithiation as stage transitions occur within the carbon crystal structure. Lithium plating deposits an extra solid metal layer on the anode surface, producing a secondary thickness increase beyond the theoretical limit of lattice expansion.

In-Situ Mechanical Displacement
Linear variable differential transformers register localized thickness expansion during constant-current charging, allowing high-precision dilatometry to separate reversible lattice swelling from extra-lattice metallic accumulation. When current stops or flips to discharge, surface metallic lithium strips or re-intercalates far faster than solid-state diffusion permits lithium to exit bulk graphite, yielding an immediate displacement recovery. This kinetic difference causes an initial rapid contraction in cell thickness before standard de-intercalation decay takes over.
Rapid displacement contraction during the initial minutes of rest indicates stripping of surface metal rather than solid-state lattice contraction.
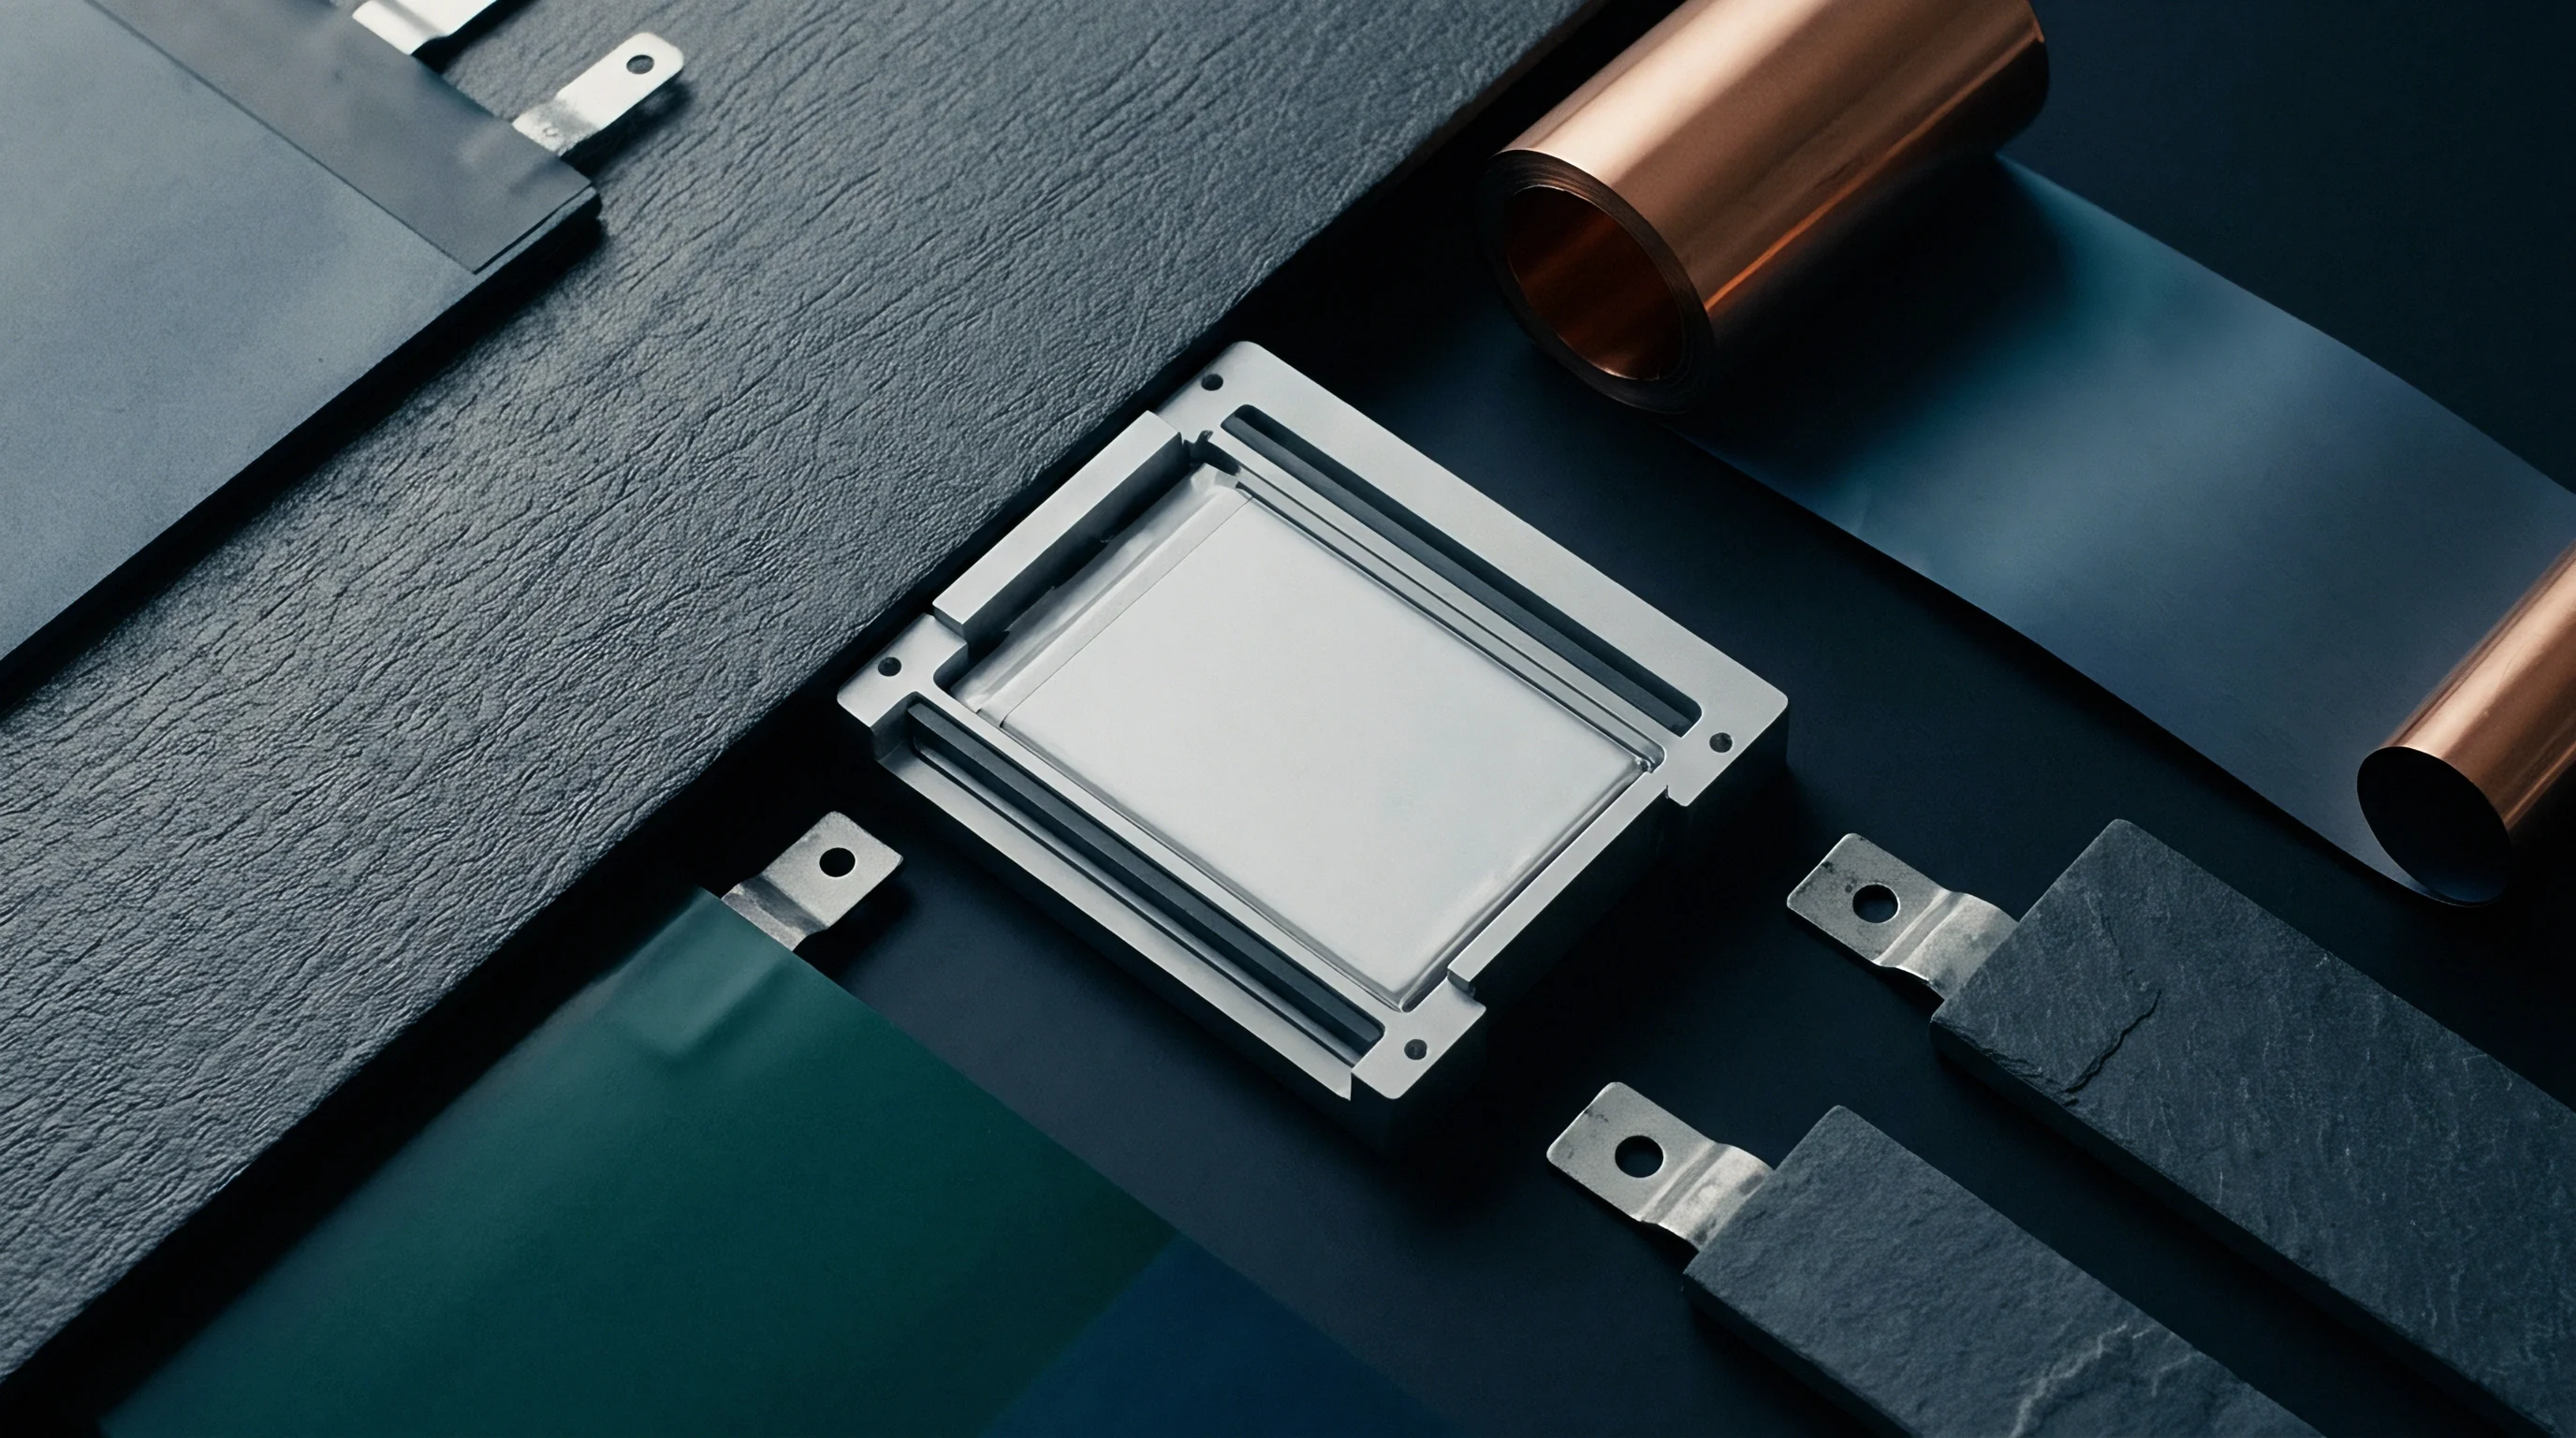
Acoustic and Thermal Modalities
Ultrasonic time-of-flight measurements track acoustic impedance changes as dense metallic layers build up at the anode-separator boundary, where metallic lithium films alter the reflection coefficient at the electrode interface and cause measurable shifts in signal flight time and peak amplitude. Microcalorimetry complements acoustic logging by tracking thermal heat flux during stripping; because metallic stripping absorbs thermal energy, it produces a clear endothermic heat signal during post-charge rests.
| Sensor Modality | Signal Metric | Detection Floor | Primary Artifact Source | Implementation Complexity |
|---|---|---|---|---|
| Dilatometry | Thickness change (µm) | 0.05 µm film | Pouch thermal expansion | Moderate (External fixture) |
| Ultrasonic Time-of-Flight | Shift in flight time (ns) | 0.10 µm film | Electrolyte wetting shifts | High (Transducer coupling) |
| Differential Voltage (dV/dt) | Rest plateau slope (mV/s) | 0.50% plated C | Voltage channel drift | Low (Standard cycler software) |
| Heat Flux Calorimetry | Entropic heat rate (mW) | 0.20% plated C | Chamber temperature drift | High (Specialized chamber) |
- High-Precision Dilatometry tracks irreversible thickness accumulation cycle over cycle to quantify dead lithium build-up.
- Ultrasonic Time-of-Flight measures shifts in signal flight duration across the cell thickness to identify low-density lithium film formation.
- Heat Flux Microcalorimetry isolates entropic cooling signals caused by metallic stripping during post-charge OCV holds.
- Operando X-Ray Diffraction quantifies graphite peak shifts alongside metallic peak emergence under synchrotron excitation.
Combining displacement tracking with electrical diagnostics separates mechanical breathing from irreversible film formation. The continuous accumulation of electrically isolated metallic fragments leaves permanent thickness offsets that remain even after extended rest periods.
Pouch thickness growth that remains after extended rest periods points to irreversible dead lithium accumulation rather than transient metallic plating.


Stripping
Quantifying plated metal relies on isolating the secondary voltage plateau during subsequent anodic discharge. Metallic lithium oxidizes at lower overpotentials than lithiated graphite stages require for de-intercalation. Running a low-rate discharge immediately after a fast charge reveals a distinct low-potential stripping feature before the main graphite stage reaction begins.
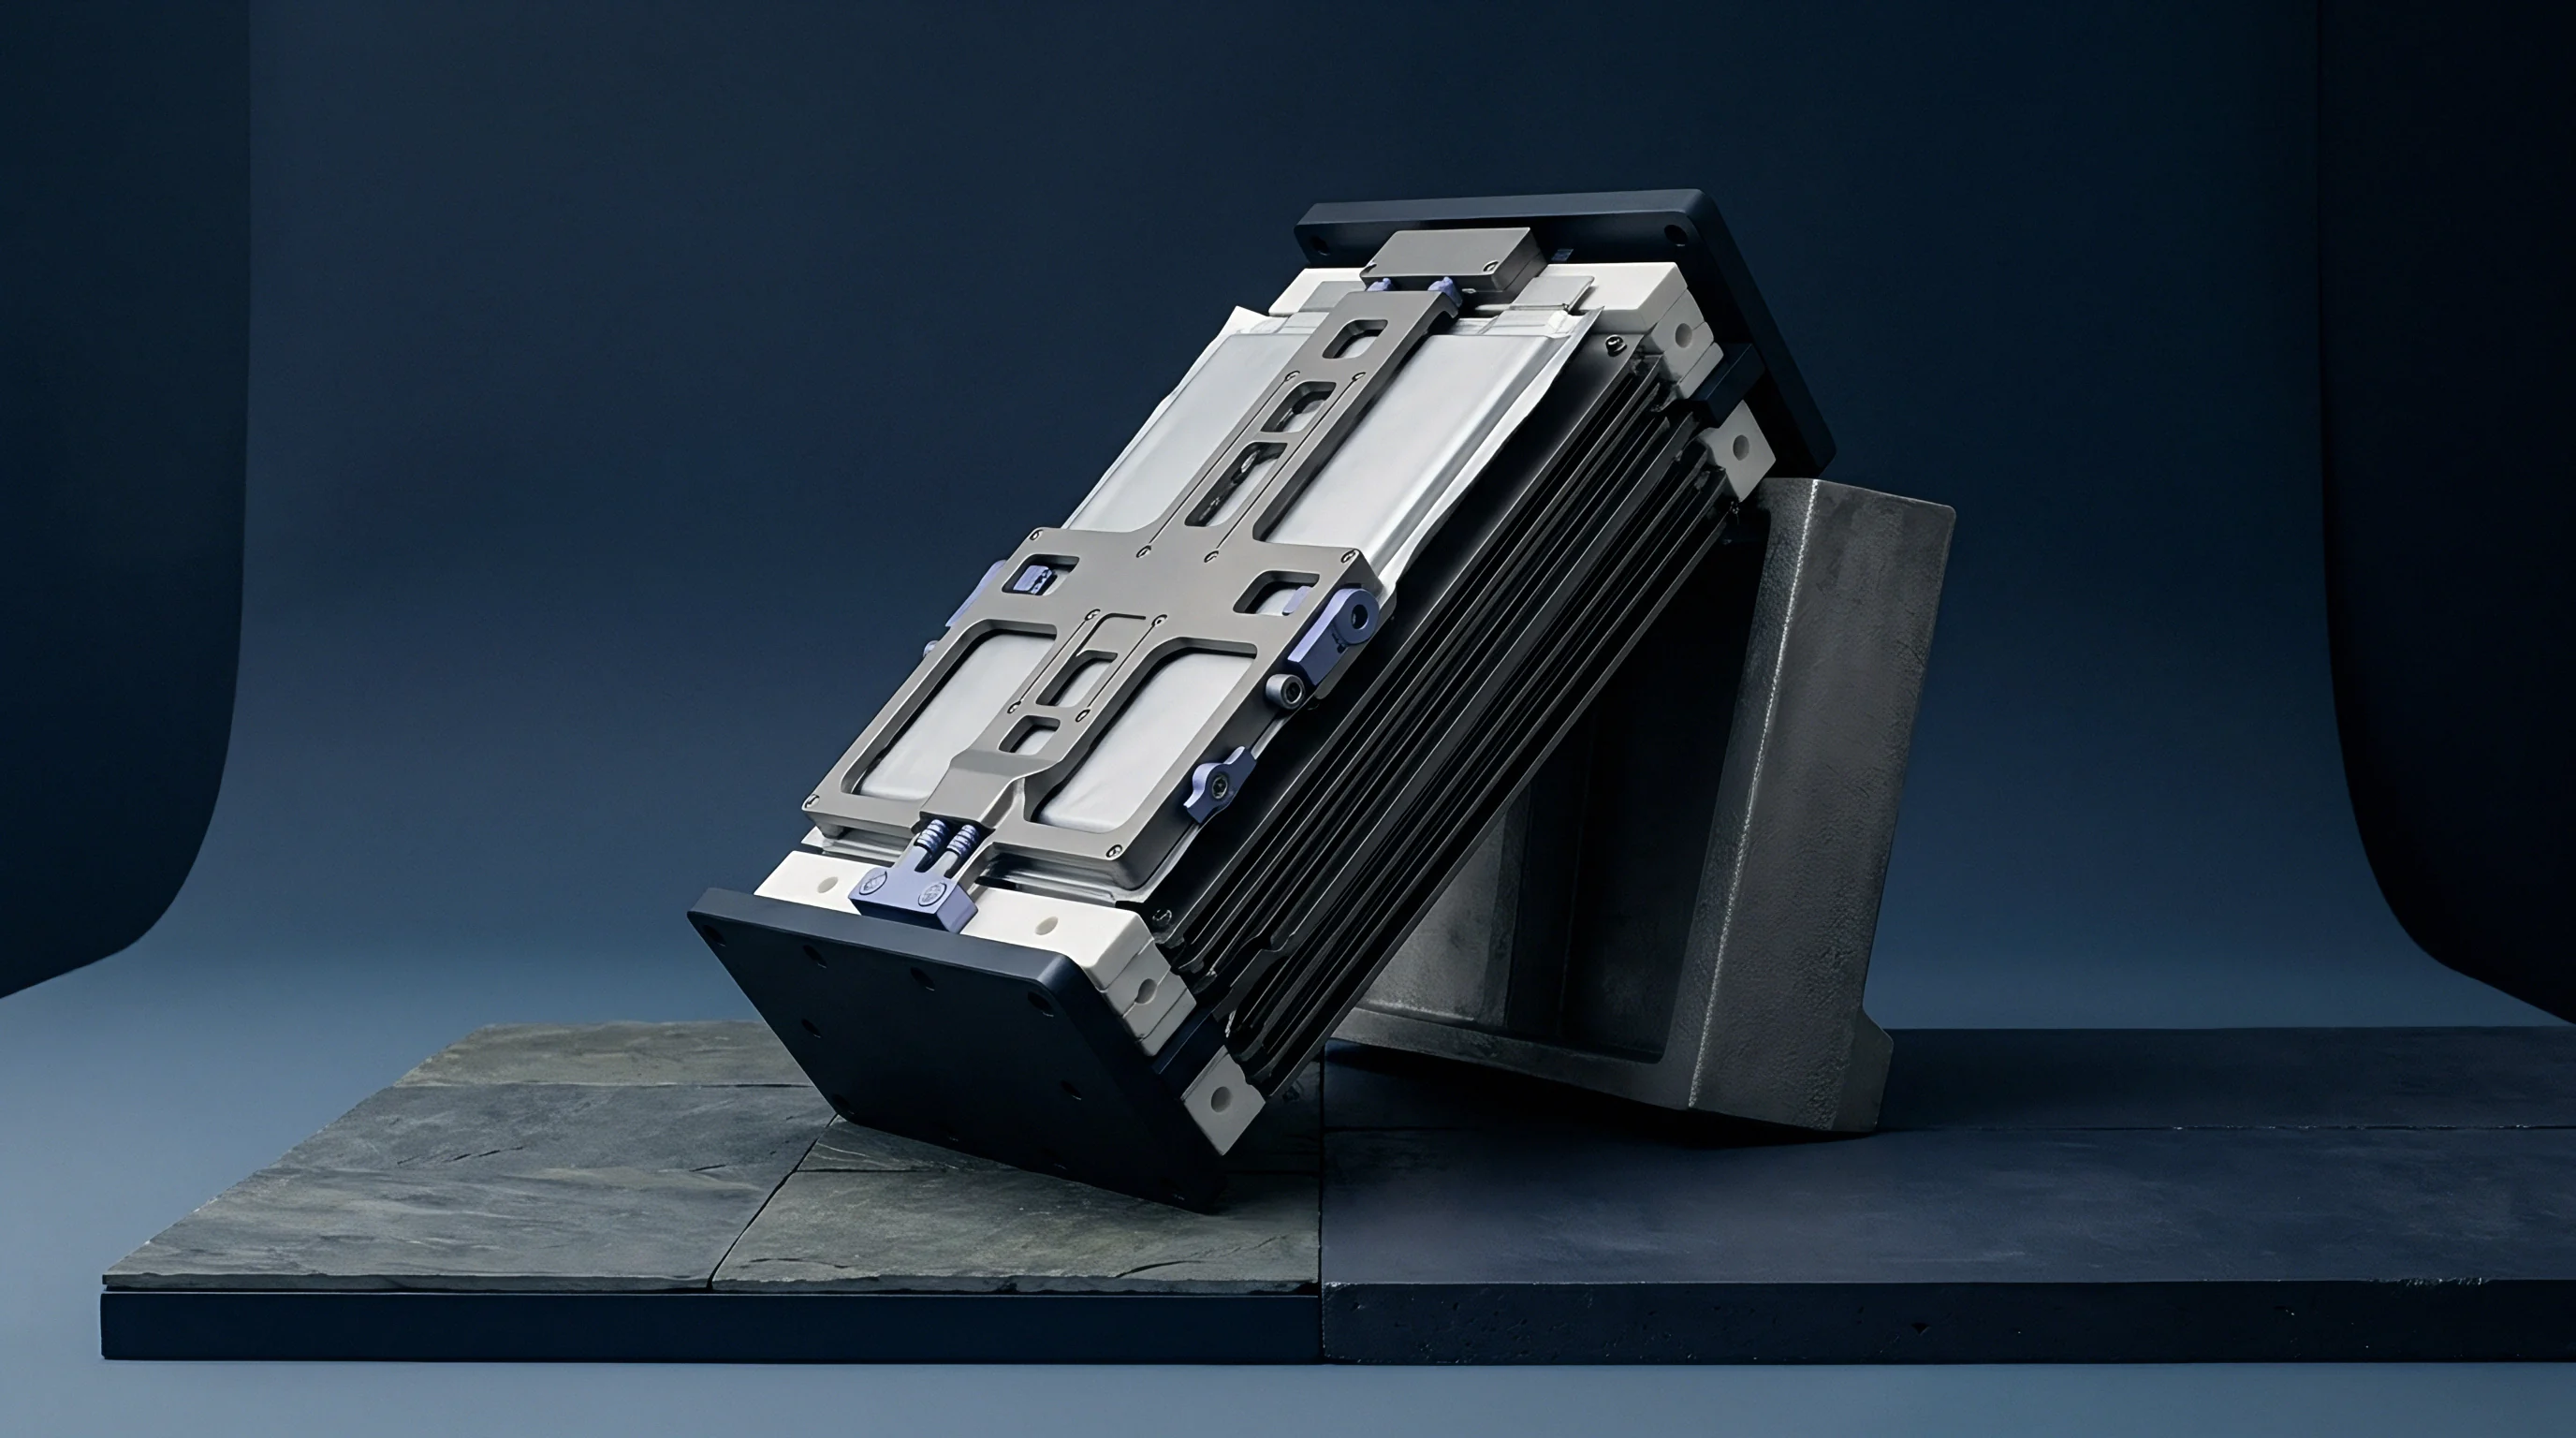
What Distinguishes Reversible Stripping from Intercalation?
Distinguishing surface metal dissolution from lattice lithium extraction depends on where the differential capacity peak falls along the voltage axis. Plotting dQ/dV against cell voltage turns subtle slope changes into clear peaks. The metallic stripping reaction forms a prominent peak near 0.05 V to 0.10 V versus Li/Li+, whereas graphite stage transitions occur at higher potentials of 0.12 V, 0.16 V, and 0.21 V, with peak areas defining the stripped mass.
A discharge rate of C/20 at zero degrees Celsius yields a stripping peak potential shift of 42 millivolts above open-circuit equilibrium.

Differential Capacity Peak Integration
Baseline subtraction removes background carbon de-intercalation current from the total measured discharge capacity. Fitting a non-linear baseline beneath the low-potential stripping peak isolates the amp-hour capacity tied specifically to metallic lithium re-oxidation. Dividing this integrated stripping capacity by total charged capacity gives the fractional reversible plating ratio for that cycle.
- Data Smoothing reduces high-frequency noise using a Savitzky-Golay filter across the raw voltage and capacity array.
- Derivative Calculation computes the first derivative of capacity with respect to voltage to construct the dQ/dV profile.
- Baseline Extraction fits a non-linear baseline beneath the low-potential stripping peak using polynomial interpolation.
- Peak Area Integration integrates the baseline-subtracted peak area to determine total reversible metallic stripping capacity.
Lowering the discharge rate increases the voltage separation between metallic stripping and graphite de-intercalation. Discharging at C/20 or lower reduces ohmic overpotentials, keeping the stripping peak from merging into the initial graphite stage de-intercalation signal.
Misinterpreting low-potential graphite stage transitions as metallic stripping peaks leads to inaccurate safety estimates, driving premature cell derating and inflated warranty reserves.

Partition
Separating total capacity loss into active material loss and lithium inventory loss is fundamental to degradation accounting. During cycling, plated metallic lithium divides into two distinct populations: reversible lithium that rejoins the electrochemical reaction, and irreversible lithium. The irreversible fraction further splits into parasitic reaction products from electrolyte reduction and electrically isolated dead lithium fragments.
Inventory versus Active Material Loss
Degradation pathways consume cyclable ions through solid electrolyte interphase expansion and isolated metallic fragments. Fast charging at low temperatures accelerates the growth of mossy or dendritic structures that strip preferentially at their bases near the graphite substrate during discharge, leaving disconnected metallic islands trapped in passivating films. This dead lithium causes permanent loss of lithium inventory (LLI) without damaging the carbon lattice itself.
Loss of active material (LAM) occurs alongside LLI through mechanical stress. Metallic plating clogs surface pores, creating localized stresses that fracture graphite particles during expansion. These fresh fractures expose unpassivated graphite to the liquid electrolyte, consuming more lithium ions to form new passivating layers.

Isothermal Degradation Accounting
Multivariate fitting algorithms match full-cell open-circuit voltage curves against half-cell reference profiles gathered across reference temperatures. For example, a 5.00 Ah pouch cell cycled under isothermal conditions at -10 degrees Celsius using a 1C charge rate begins at 5.00 Ah capacity. After 100 cycles, discharge capacity drops to 4.10 Ah, representing a total capacity loss of 0.90 Ah (18.0 percent fade).
Differential voltage spectrum analysis separates this 0.90 Ah loss into three independent channels. Reversible stripping logs an average of 0.002 Ah per cycle. Accumulated dead lithium accounts for 0.55 Ah (61.1 percent of total loss), continuous electrolyte reaction and solid electrolyte interphase growth consume 0.20 Ah (22.2 percent of total loss), and particle cracking with active site isolation explains the remaining 0.15 Ah (16.7 percent of total loss).
| Temperature (°C) | Charge C-Rate | Reversible Stripping (%) | Dead Metal Fraction (%) | SEI Growth Fraction (%) |
|---|---|---|---|---|
| -10 | 1.0C | 12.5 | 61.1 | 22.2 |
| -10 | 0.5C | 5.2 | 38.4 | 42.1 |
| 0 | 1.0C | 4.1 | 28.5 | 52.3 |
| 0 | 0.5C | 0.8 | 11.2 | 71.4 |
| 25 | 1.0C | 0.0 | 2.1 | 84.5 |
IEC 62619 Clause 6.4 specifies thermal control tolerances during rate capability testing; exceeding specified limits invalidates degradation allocation data.
- Dendrite Penetration breaches the separator membrane, creating internal soft shorts that trigger localized micro-thermal runaways.
- Electrolyte Dry-Out consumes free solvent through continuous chemical reduction on fresh metallic lithium surfaces.
- Impedance Growth coats graphite particles with resistive reaction products, elevating charge-transfer resistance across the anode interface.
- Gas Evolution generates volatile hydrocarbon species from solvent decomposition, driving pouch swelling and internal pressure elevation.
Increasing the ambient charge temperature from -10 degrees Celsius to 25 degrees Celsius at the same 1C current rate eliminates the reversible metallic stripping peak entirely while reducing total LLI to 0.12 Ah over 100 cycles.
Early capacity fade during low-temperature charging often reflects unmitigated metallic lithium accumulation rather than natural SEI growth.

Warranties
Commercial contracts require strict alignment between laboratory screening routines and field operating conditions. Screening conducted without precise isothermal regulation allows internal self-heating to artificially reduce metallic plating, producing overly optimistic cell life estimates. When those cells deploy into field modules with limited thermal management, cold charging leads to severe plating and early failure.
Regulatory and Transport Compliance
UN 38.3 testing protocols mandate thermal and mechanical stress exposure before transport authorization. Accumulating metallic lithium inside cells alters safety profiles during regulatory trials, lowering the thermal runaway initiation temperature in accelerating rate calorimetry from 160 degrees Celsius to 110 degrees Celsius.
European Union Battery Regulation rules mandate transparent reporting of state-of-health metrics and physical durability parameters throughout a battery system’s lifetime. Importers of record carry full legal liability for compliance certificates and test summary validity under UN 38.3 Section 38.3.2.6. Shipments containing heavy internal metallic plating risk thermal failure during UN 38.3 T.2 thermal shock exposure or T.3 vibration testing, invalidating the underlying safety dossier.

Contractual Operational Boundaries
Procurement agreements define acceptable charging C-rates as a strict function of monitored core cell temperature. Battery management system control algorithms must incorporate real-time plating avoidance maps derived from isothermal laboratory screening data.
Integrating automated differential capacity derivative algorithms into pack firmware enables continuous monitoring of fast-charging events. If a battery pack logs dQ/dV signals indicative of metallic stripping during operational rests, warranty terms may automatically adjust charging current envelopes to mitigate micro-dendrite formation.
Section 8.2 of standard supply contracts assigns full financial liability for thermal field failures to the integrator if cell log data proves charging occurred below five degrees Celsius without pre-heating.