Battery Test Data Integrity Verification Protocols for Sourcing Engineers
Raw cycler time-series auditing prevents early cell degradation failures by catching synthetic test curves and unaccredited regulatory paperwork.


Telemetry
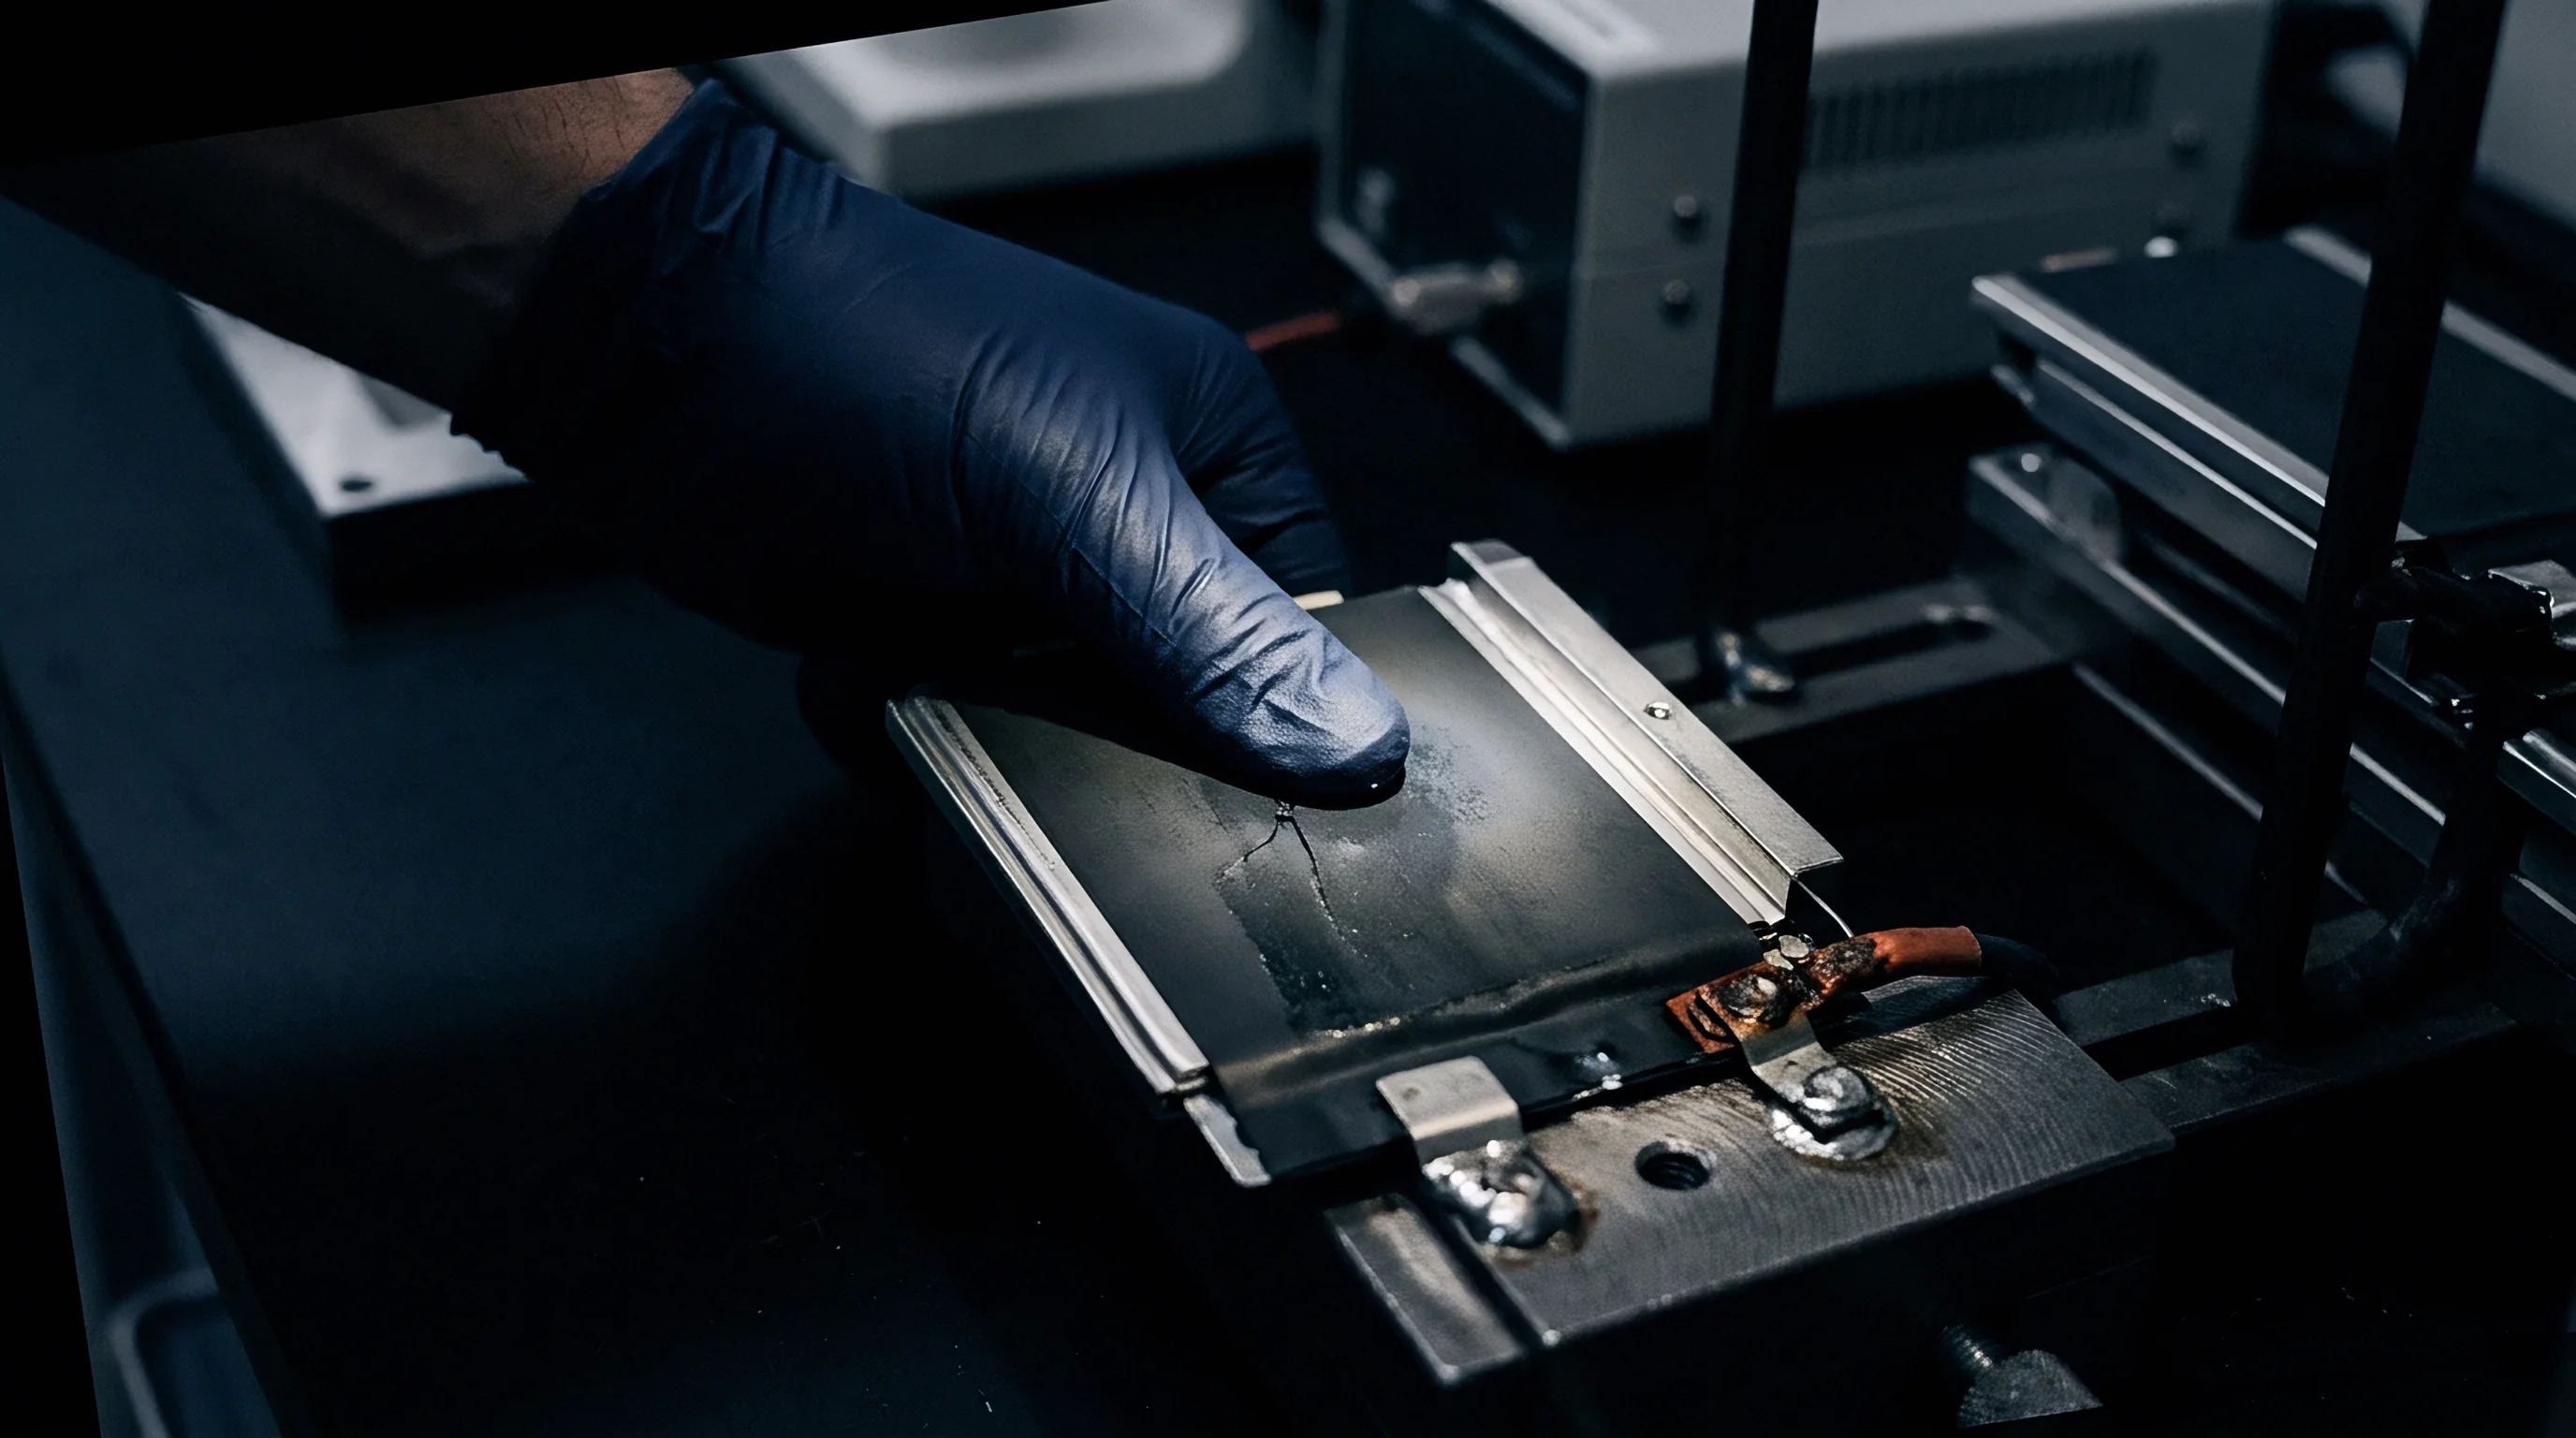
Raw cycler logs give the only unvarnished record of cell qualification. Summary spreadsheets and generated charts routinely smooth over bench anomalies, cut steps short, or mask uncalibrated channels. Sourcing teams need full binary or raw delimited time-series output straight from the channel equipment to preserve an unbroken chain of custody.
Multi-channel cyclers record continuous streams of voltage, current, cell surface temperature, and step duration, typically exporting to binary TDMS files, SQL databases, or raw comma-separated values. A complete log includes metrological headers detailing the equipment ID, calibration dates, shunt resistor tolerances, and active software revisions. Without that header metadata, any later statistical work on capacity fade or resistance growth lacks metrological traceability.

Time Series Log Requirements
Automated ingestion pipelines check several structural criteria across raw time-series logs before running analytical routines.
- Header Metrology Specifications Every log file includes the cycler hardware serial number, channel index, operational firmware version, and calibration validity dates.
- Timestamp Sampling Rates Voltage and current channels record at minimum sampling frequencies of 10 Hertz during transient pulse steps and 0.1 Hertz during continuous charge or discharge phases.
- Channel Calibration Coefficients Raw numeric records contain unadjusted transducer outputs alongside active gain and offset calibration factors applied by the host system.
- Rest Period Transition Delays Open-circuit voltage recording transitions from transient millisecond logging to steady-state interval logging without missing timestamps during state changes.
Checking voltage sampling intervals shows whether test software smoothed over voltage plateaus or suppressed spikes during high-rate discharge pulses. Characterization at high rates depends on tight temporal alignment between current application and voltage response; even a microsecond lag in channel recording distorts calculated direct-current internal resistance, inflating efficiency figures.
An uncalibrated cycler channel drift exceeding 0.002 volts over 500 cycles skews cumulative capacity loss figures by up to 8 percent.
Thermal logging requires identical sampling priority, pairing cell surface temperature directly to current strain steps in the same data frame. When thermal channels drop frames or average readings across wider windows, transient temperature spikes from localized resistance anomalies vanish from the record. Accepting truncated time-series data forfeits any check on true thermal stability during rapid charge cycles, leaving buyers exposed to degradation that never showed up in testing.
Trace
Coulombic efficiency calculations and differential capacity analysis depend on continuous, high-precision current and voltage integrals. Deriving derivative voltage curves from raw time-series measurements exposes subtle structural shifts within active materials long before gross capacity drops show up in standard cycling summaries. Extracting those indicators reliably depends entirely on the raw measurement resolution and step continuity of the underlying logs.
Calculated capacity relies on time step integrity. Take a validation sample of 100 prismatic 280Ah lithium iron phosphate cells running 1C constant-current cycling at 25 degrees Celsius, logged at a baseline frequency of 1 Hertz through charge and discharge. Integrating current over raw 1-second timestamps yields accurate amp-hour capacity figures.
But if the cycler logging engine drops steps or downsamples to 10-second intervals to reduce file sizes without adjusted integration math, cumulative trapezoidal integration adds an artificial error of up to 1.4 amp-hours per cycle, skewing calculated rate capability.

Electrochemical Derivative Diagnostics
Applying mathematical differentiation to high-resolution voltage and capacity data yields differential capacity profiles that highlight phase transitions in the electrode active materials.
| Data Anomaly Signature | Mathematical Marker | Physical Degradation Mechanism | Integrity Impact |
|---|---|---|---|
| Quantization Step Flattening | Zero variance in second voltage derivative | Analog-to-digital converter bit limitation | Masks subtle active material phase changes |
| Timestamp Skew Drops | Time delta jumps exceeding step setting | Host computer buffer overrun | Distorts cumulative Coulombic integration |
| Artificial dQ/dV Peak Smoothing | Absence of high-frequency peak chatter | Polynomial curve fitting applied to raw output | Hides localized lithium plating onset |
| Unnatural Thermal Decay Tail | Linear cooling slopes during open circuit | Software-generated thermal data substitution | Conceals true internal thermal decay rates |
Differential capacity curves computed from raw test data reveal early degradation mechanisms. Peaks on the dQ/dV curve mark phase coexistence regimes in cathode and anode materials; as cells age, these peaks shift in potential and decrease in magnitude. A real physical trace carries sensor noise and micro-variations.
Overly smooth derivative curves signal that the supplier applied heavy digital filtering or synthetic polynomial fitting to raw data before export, scrubbing out indicators of active material loss or localized lithium plating.
Cell degradation curves derived from truncated rest periods reflect instantaneous thermal decay rather than true electrochemical decay.
Shortened open-circuit rest periods between charge and discharge phases suppress the true thermodynamic relaxation voltage of the chemistry. When test scripts truncate rest steps to accelerate cycle counts on the laboratory bench, solid electrolyte interphase growth and electrolyte consumption metrics become distorted. Evaluating cycle life stability from truncated rest test files creates an overoptimistic projection of field service life, misinforming baseline sourcing selections.


Discrepancy
Synthetic data injection in supplier test reports ranges from subtle missing-frame interpolation to full mathematical generation of cycle fade profiles using multi-parameter exponential equations. Automated algorithmic auditing tools evaluate raw CSV and TDMS exports to identify structural anomalies, uniform noise distributions, and temporal skips that indicate non-empirical data generation.
What Structural Markers Reveal Algorithmically Fabricated Cycler Logs?
- Extract the voltage step transition intervals across all cycling steps to establish the baseline recording frequency.
- Compute the second derivative of the voltage-time series during initial constant-current charge phases.
- Compare ambient temperature channel fluctuations against adjacent channel step changes to locate thermal isolation anomalies.
- Verify timestamp continuity using epoch time calculations to isolate missing rows or retroactively spliced testing sessions.
Physical measurements always carry sensor noise, thermal fluctuation signatures, and minor current ripple from the cycler power stage. Algorithmically generated test data typically uses uniform Gaussian noise or lacks noise entirely. Calculating the fast Fourier transform of voltage residuals during constant-current phases reveals whether the noise spectrum matches known physical power supply signatures or exhibits the flat, uncolored frequency distribution characteristic of pseudorandom software generators.
Synthetic cycling logs generated by polynomial interpolation lack the high-frequency voltage chatter caused by active material phase changes.
In authentic multi-channel test setups, surface temperatures of adjacent cells exhibit cross-channel thermal influence when mounted in shared fixtures. If a cycling file shows multi-cell data where surface temperature curves are perfectly identical across eight separate channels down to hundredths of a degree, the test lab bound a single physical temperature sensor channel to multiple cell data streams in software. When an auditor discovers duplicated thermal signatures across separate physical cells, the test file must be rejected as an unvalidated dataset.
Host computer buffer overflows do not justify automated data reconstruction after testing; reconstructing missing rows alters the physical record post-test, rendering the dataset invalid for formal engineering qualification.

Dossier
Regulatory certification requires an unbroken line of verified documentation matching shipped cell lots to tested sample populations. UN 38.3 transport testing, IEC 62133-2 safety qualification, and UL 1642 component listing generate dangerous goods test summaries, formal test reports, and laboratory accreditation records. Sourcing engineers must validate not only the raw cycling metrics but also the structural authenticity and accreditation scope of the issuance bodies.

Regulatory File Verification Matrix
A compliant regulatory dossier maps every safety certification directly to accredited testing facilities and verifiable cell model designations.
| Document Title | Governing Standard | Mandatory Verification Item | Validation Failure Mode |
|---|---|---|---|
| UN 38.3 Test Summary | UN Manual of Tests and Criteria 38.3.5 | Unique test report identifier and date match | Mismatched cell mass or equivalent lithium content |
| IEC 62133-2 Certificate | IEC 62133-2 Edition 1.0 / 2.0 | National Certification Body accreditation scope | Testing conducted outside accredited scope parameters |
| ILAC-MRA Test Report | ISO/IEC 17025:2017 Clause 7.8 | Continuous equipment calibration chain proof | Unaccredited sub-contractor laboratory usage |
| Material Safety Data Sheet | GHS Revision 8 / REACH Regulation | Chemical CAS numbers and concentration ranges | Omission of toxic decomposition gas metrics |
A certificate carrying an ISO/IEC 17025 logo remains meaningless if the issuing laboratory lacks specific battery testing standards within its formal scope of accreditation document issued by an ILAC-MRA signatory body. Laboratories often hold general electrical safety accreditations while lacking the specialized environmental test chambers, vibration tables, and high-current short-circuit equipment required for UN 38.3 or IEC 62133 compliance.
- Laboratory Scope Omissions Verification reveals the testing facility lacked formal accreditation for high-altitude simulation or thermal abuse testing at the time of report issuance.
- Non-Matching Test Article Identifiers Dimensional specifications, internal electrode tab configurations, or weight values listed in the test report diverge from current bill-of-materials revisions.
- Missing Calibration Traceability Identifiers Equipment identification numbers listed within the test procedures lack cross-references to national metrology institute calibration certificates.
- Unratified Test Summary Templates Document omits required signatory fields, missing factory quality management system references required under paragraph 38.3.5 of the UN Manual.
Under IATA dangerous goods packing instructions PI 965 and PI 967, freight forwarders and commercial air carriers reject shipments accompanied by incomplete test summaries or invalid laboratory credentials, halting clearance at the border when unaccredited testing voids carriage compliance.
Section 6.2 of ISO/IEC 17025 invalidates test reports where equipment calibration traces lack documented unbroken chains to national metrology institutes.
Under Clause 7.8.2 of ISO/IEC 17025:2017, test reports lacking clear traceability to tested sample serial numbers and signed validation approvals fail to constitute legal proof of conformity, exposing the importer of record to regulatory seizure and dangerous goods violations.

Contract
Commercial purchase agreements must translate technical test data verification requirements into enforceable procurement terms. Linking lot acceptance, warranty coverage, and payment milestones directly to dynamic raw data submission protocols creates financial incentives for suppliers to maintain strict data integrity across production volumes.
Supply contracts define exact data formatting requirements for incoming lot quality control files. The buyer specifies that every shipped cell lot arrives accompanied by raw, unedited TDMS or CSV cycler files for the specific formation and grading channels used on those serial numbers. Standardizing file structures allows automated server-side verification scripts to flag capacity inflation, incomplete rest steps, or abnormal internal resistance distributions before shipments leave the supplier warehouse.
Contract clauses govern acceptable variance thresholds between supplier quality control logs and incoming sample audits conducted by the buyer. When third-party incoming inspection reveals a mean capacity lower than the supplier grading file indicated, or an internal resistance distribution exceeding agreed tolerance limits, contractual dynamic batch rejection clauses trigger automated holdbacks on letters of credit, while unverified cell test histories void supplier warranty defenses.
Integrating clear regulatory and performance verification protocols directly into supply agreements protects the buyer from commercial liability. If a field failure occurs, having raw, mathematically validated cycler logs and fully accredited safety files ensures clear allocation of product liability, proving whether defect root causes originated in cell manufacturing or end-system application stress. The operational challenge remains ensuring automated data auditing pipelines evolve quickly enough to catch generative tools used to create synthetic, noise-perfect cycler logs that mimic physical bench tests.