Statistical Process Control Limits for High Volume Imported Prismatic Cell Verification
Statistical process control limits for imported prismatic cells require Cpk above 1.33 and AQL 0.065 to prevent batch failures during pack assembly.


Criterion
High-volume prismatic cell imports require tight statistical inspection limits at receiving to catch manufacturing defects before pack integration. Large container shipments of LFP or NMC formats ~ like 280Ah, 306Ah, or 314Ah cells ~ carry inherent quality risks from lot-to-lot variances introduced during slurry coating, calendering, or formation overseas. Setting statistical process control limits directly at port facilities separates non-conforming lots prior to module assembly, protecting yield downstream.
Process control strategies for imported prismatic formats focus on electrical performance, dimensional stability, and electrochemical decay. Vendor datasheets reflect fresh factory-floor conditions right after formation, but ocean transit, temperature swings, and mechanical relaxation alter those initial baselines. Verification depends on calculated capability indices that measure sample distributions against engineering thresholds; operating below standard capability quickly inflates downstream scrap rates.
Statistical Limits for Electrochemical Screening
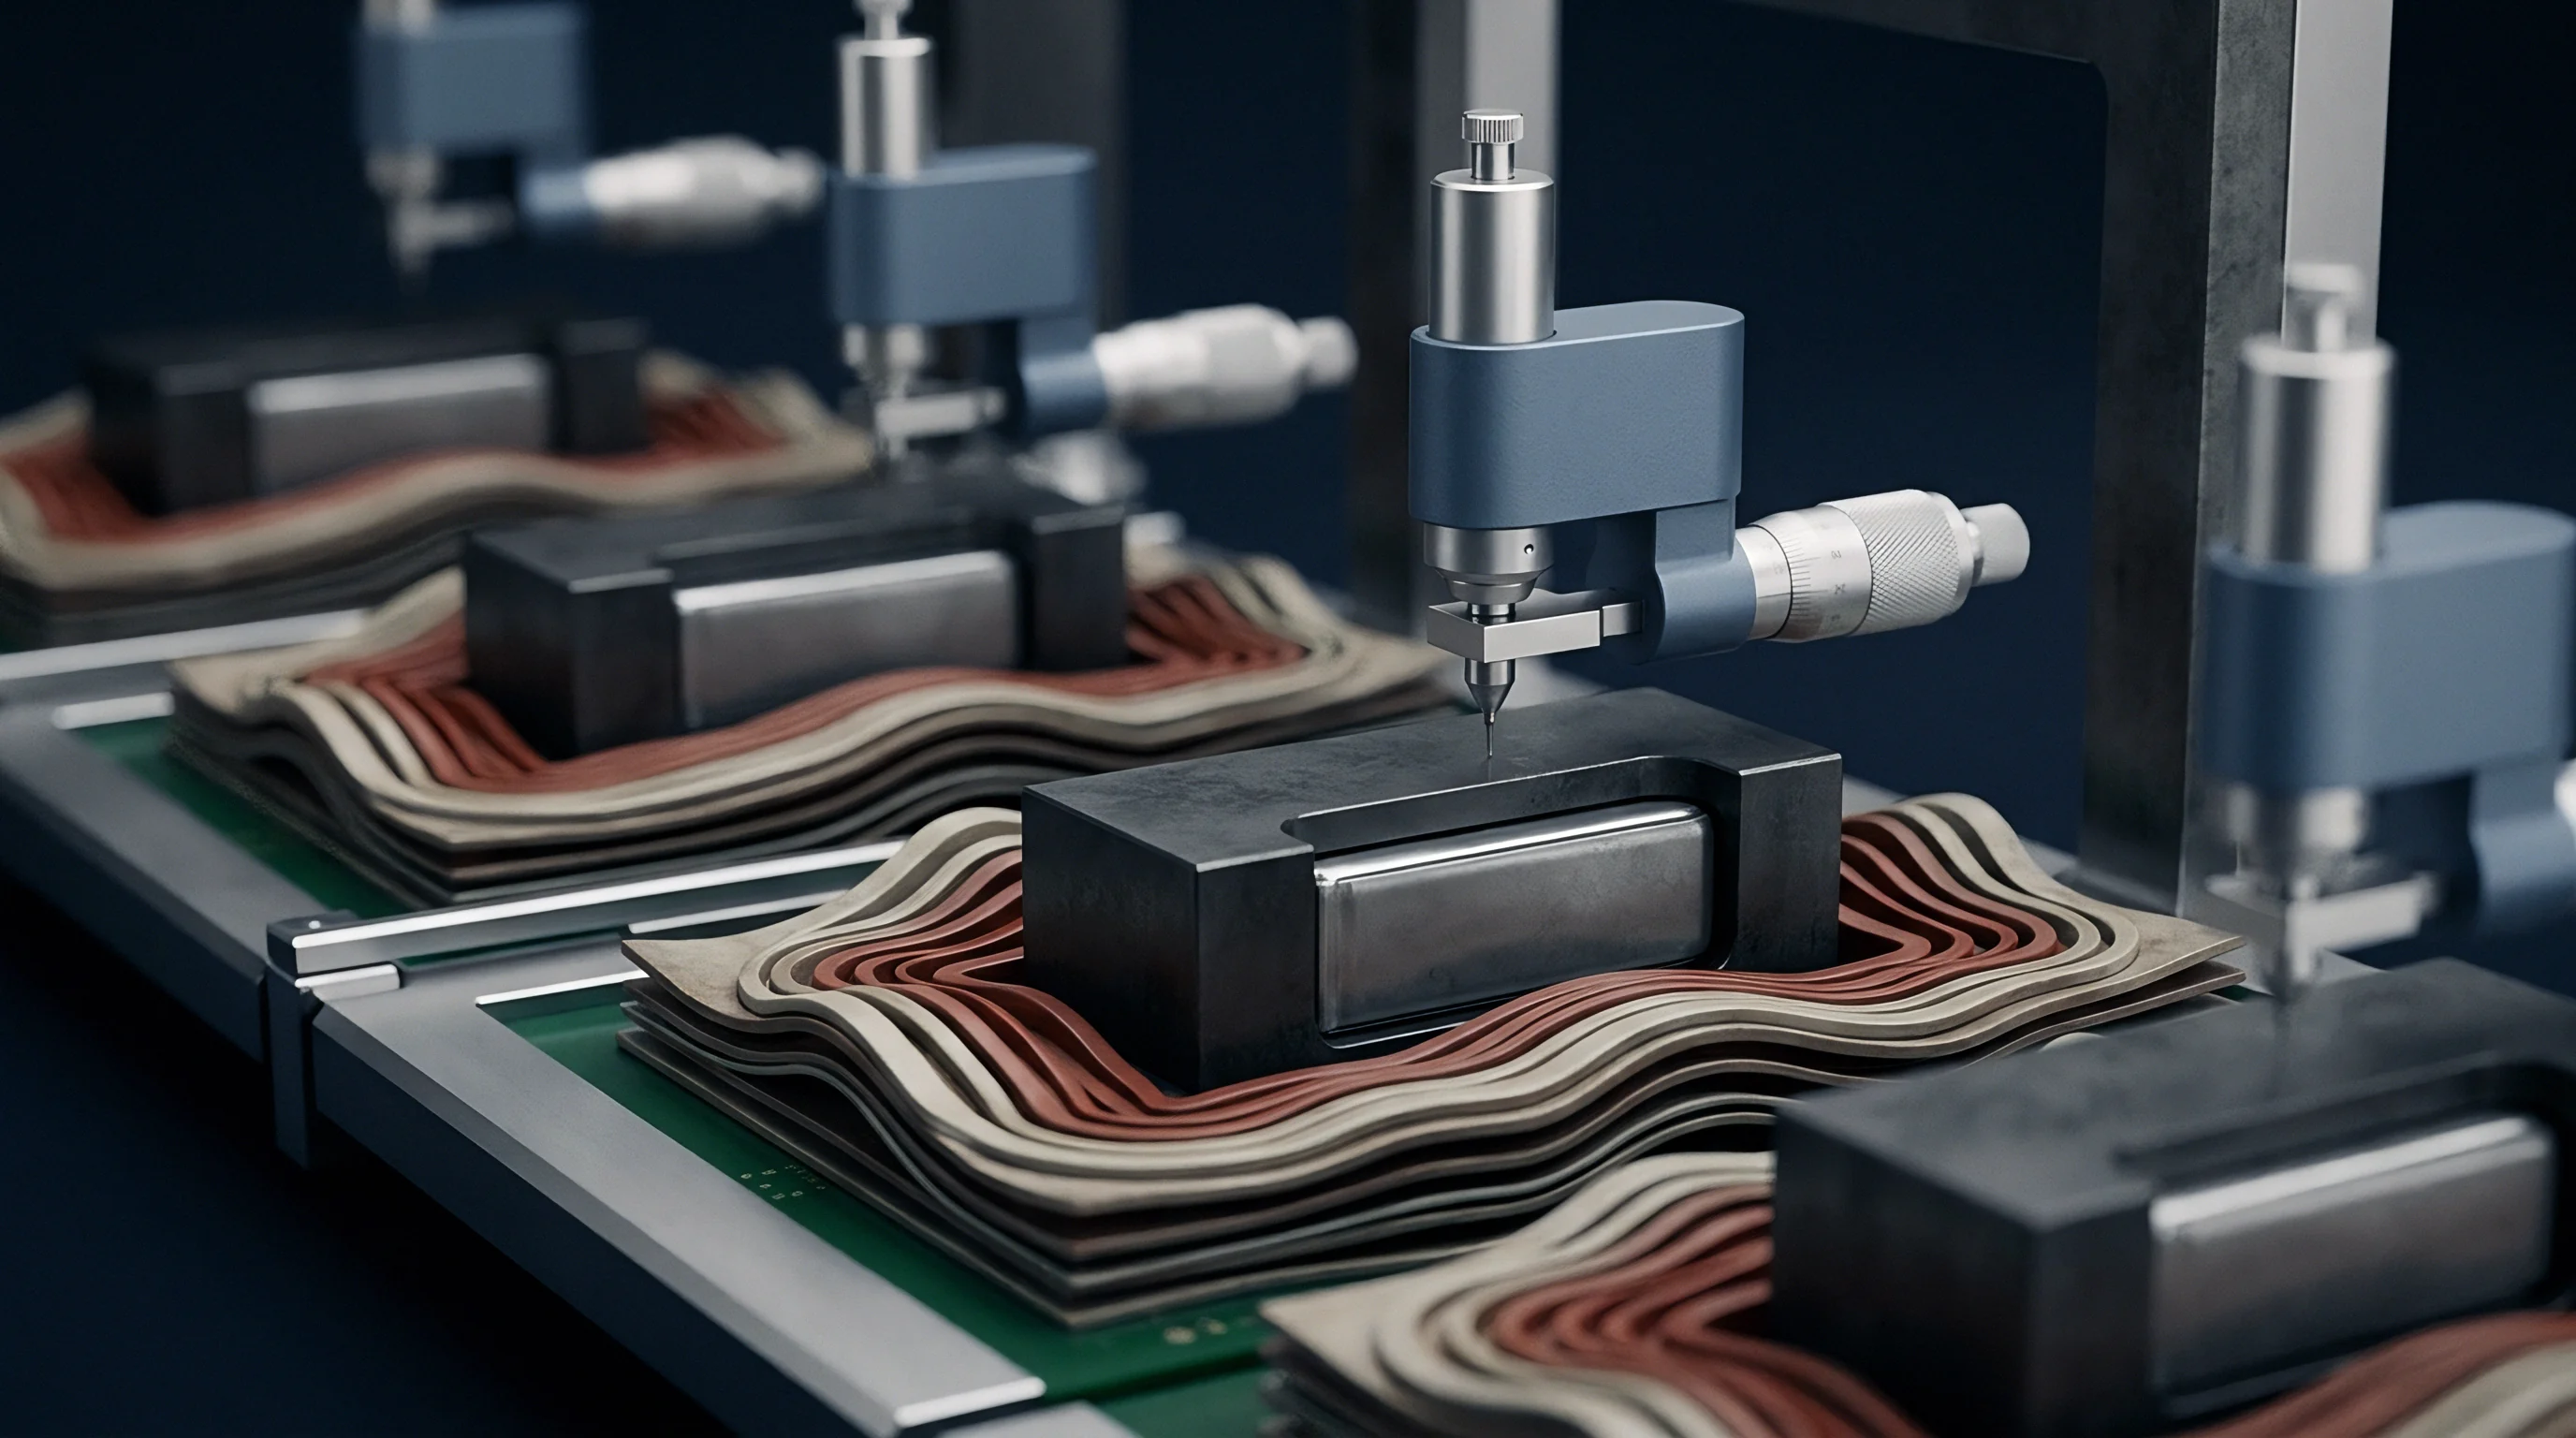
Screening imported LFP and NMC prismatic cells at port entry isolates defective factory lots before they reach high-voltage energy storage assemblies. Inspection routines target parameters most sensitive to cell defects: AC internal resistance at one kilohertz, DC internal resistance from ten-second discharge pulses, open circuit voltage, and self-discharge rates. Control limits define upper and lower bounds using standard deviations derived from qualification baselines.
Impedance shifts signal internal cell damage. Setting statistical limits for AC internal resistance requires five-sigma clearance around the lot population mean. Standard 280Ah LFP cells show nominal AC internal resistance between zero point 18 and zero point 22 milliohms; readings above zero point 25 milliohms point to tab welding defects, foil tears, or localized electrolyte dry-out.
Lower specification limits are equally critical to catch cells with subtle internal shorts or separator thinning that unnaturally depress resistance values.
| Parameter | Target Mean | Lower Limit (-3σ) | Upper Limit (+3σ) | Target Cpk |
|---|---|---|---|---|
| AC-IR (1 kHz) | 0.20 mΩ | 0.17 mΩ | 0.23 mΩ | ≥ 1.33 |
| DC-IR (10s 1C Pulse) | 0.48 mΩ | 0.41 mΩ | 0.55 mΩ | ≥ 1.33 |
| Open Circuit Voltage (30% SoC) | 3.295 V | 3.285 V | 3.305 V | ≥ 1.67 |
| K-Value (Self-Discharge) | 0.12 mV/day | 0.02 mV/day | 0.28 mV/day | ≥ 1.33 |
| Thickness (300 kg Clamp Load) | 71.50 mm | 71.10 mm | 71.90 mm | ≥ 1.33 |

Process Capability Index Targets in High Volume Inbound Shipping
Maintaining stable production yields requires manufacturer quality data to meet firm statistical capability targets before containers ever ship. Process capability indices compare production spread against design tolerances using standard deviations from ongoing batch samples. While short-term capability captures basic machine precision in stable conditions, long-term performance accounts for raw material lot variations and seasonal environmental shifts across months of manufacturing.
Standard electrical traits require a capability index of at least one point three three, which translates to four defect parts per million under a normal distribution curve. Critical safety traits ~ such as open circuit voltage stability and casing-to-terminal insulation resistance ~ demand a capability index of one point six seven or higher. Defect rates climb sharply if capability falls below one point zero, and manual testing routines risk hiding that variance under measurement error.
Ocean shipping vibration can temporarily shift electrolyte distribution inside large prismatic cell casings, introducing additional parameter variance post-transit.


Gauge
Metrology setups on incoming lines rely on rigid fixtures and climate control to keep measurement error from distorting inspection data. Screening thousands of units per shift means tracking millivolt and micro-ohm variations continuously across heavy aluminum terminals. At sub-milliohm levels, small changes in probe geometry, oxide buildup, or clamping force introduce significant contact error.
Gauge capability studies isolate how much of the total observed variance stems from the test station rather than the cell.
Repeatability and reproducibility studies confirm that an inspection line reliably separates good cells from non-conforming units. A repeatability and reproducibility score over ten percent means fixture instability is distorting control limits. High-speed automated lines need to hold measurement variance well below ten percent of total tolerance width, as pin contamination, pneumatic pressure loss, and mechanical wear will corrupt sample distributions over time.
Fixture Resistance and Thermal Calibration Controls
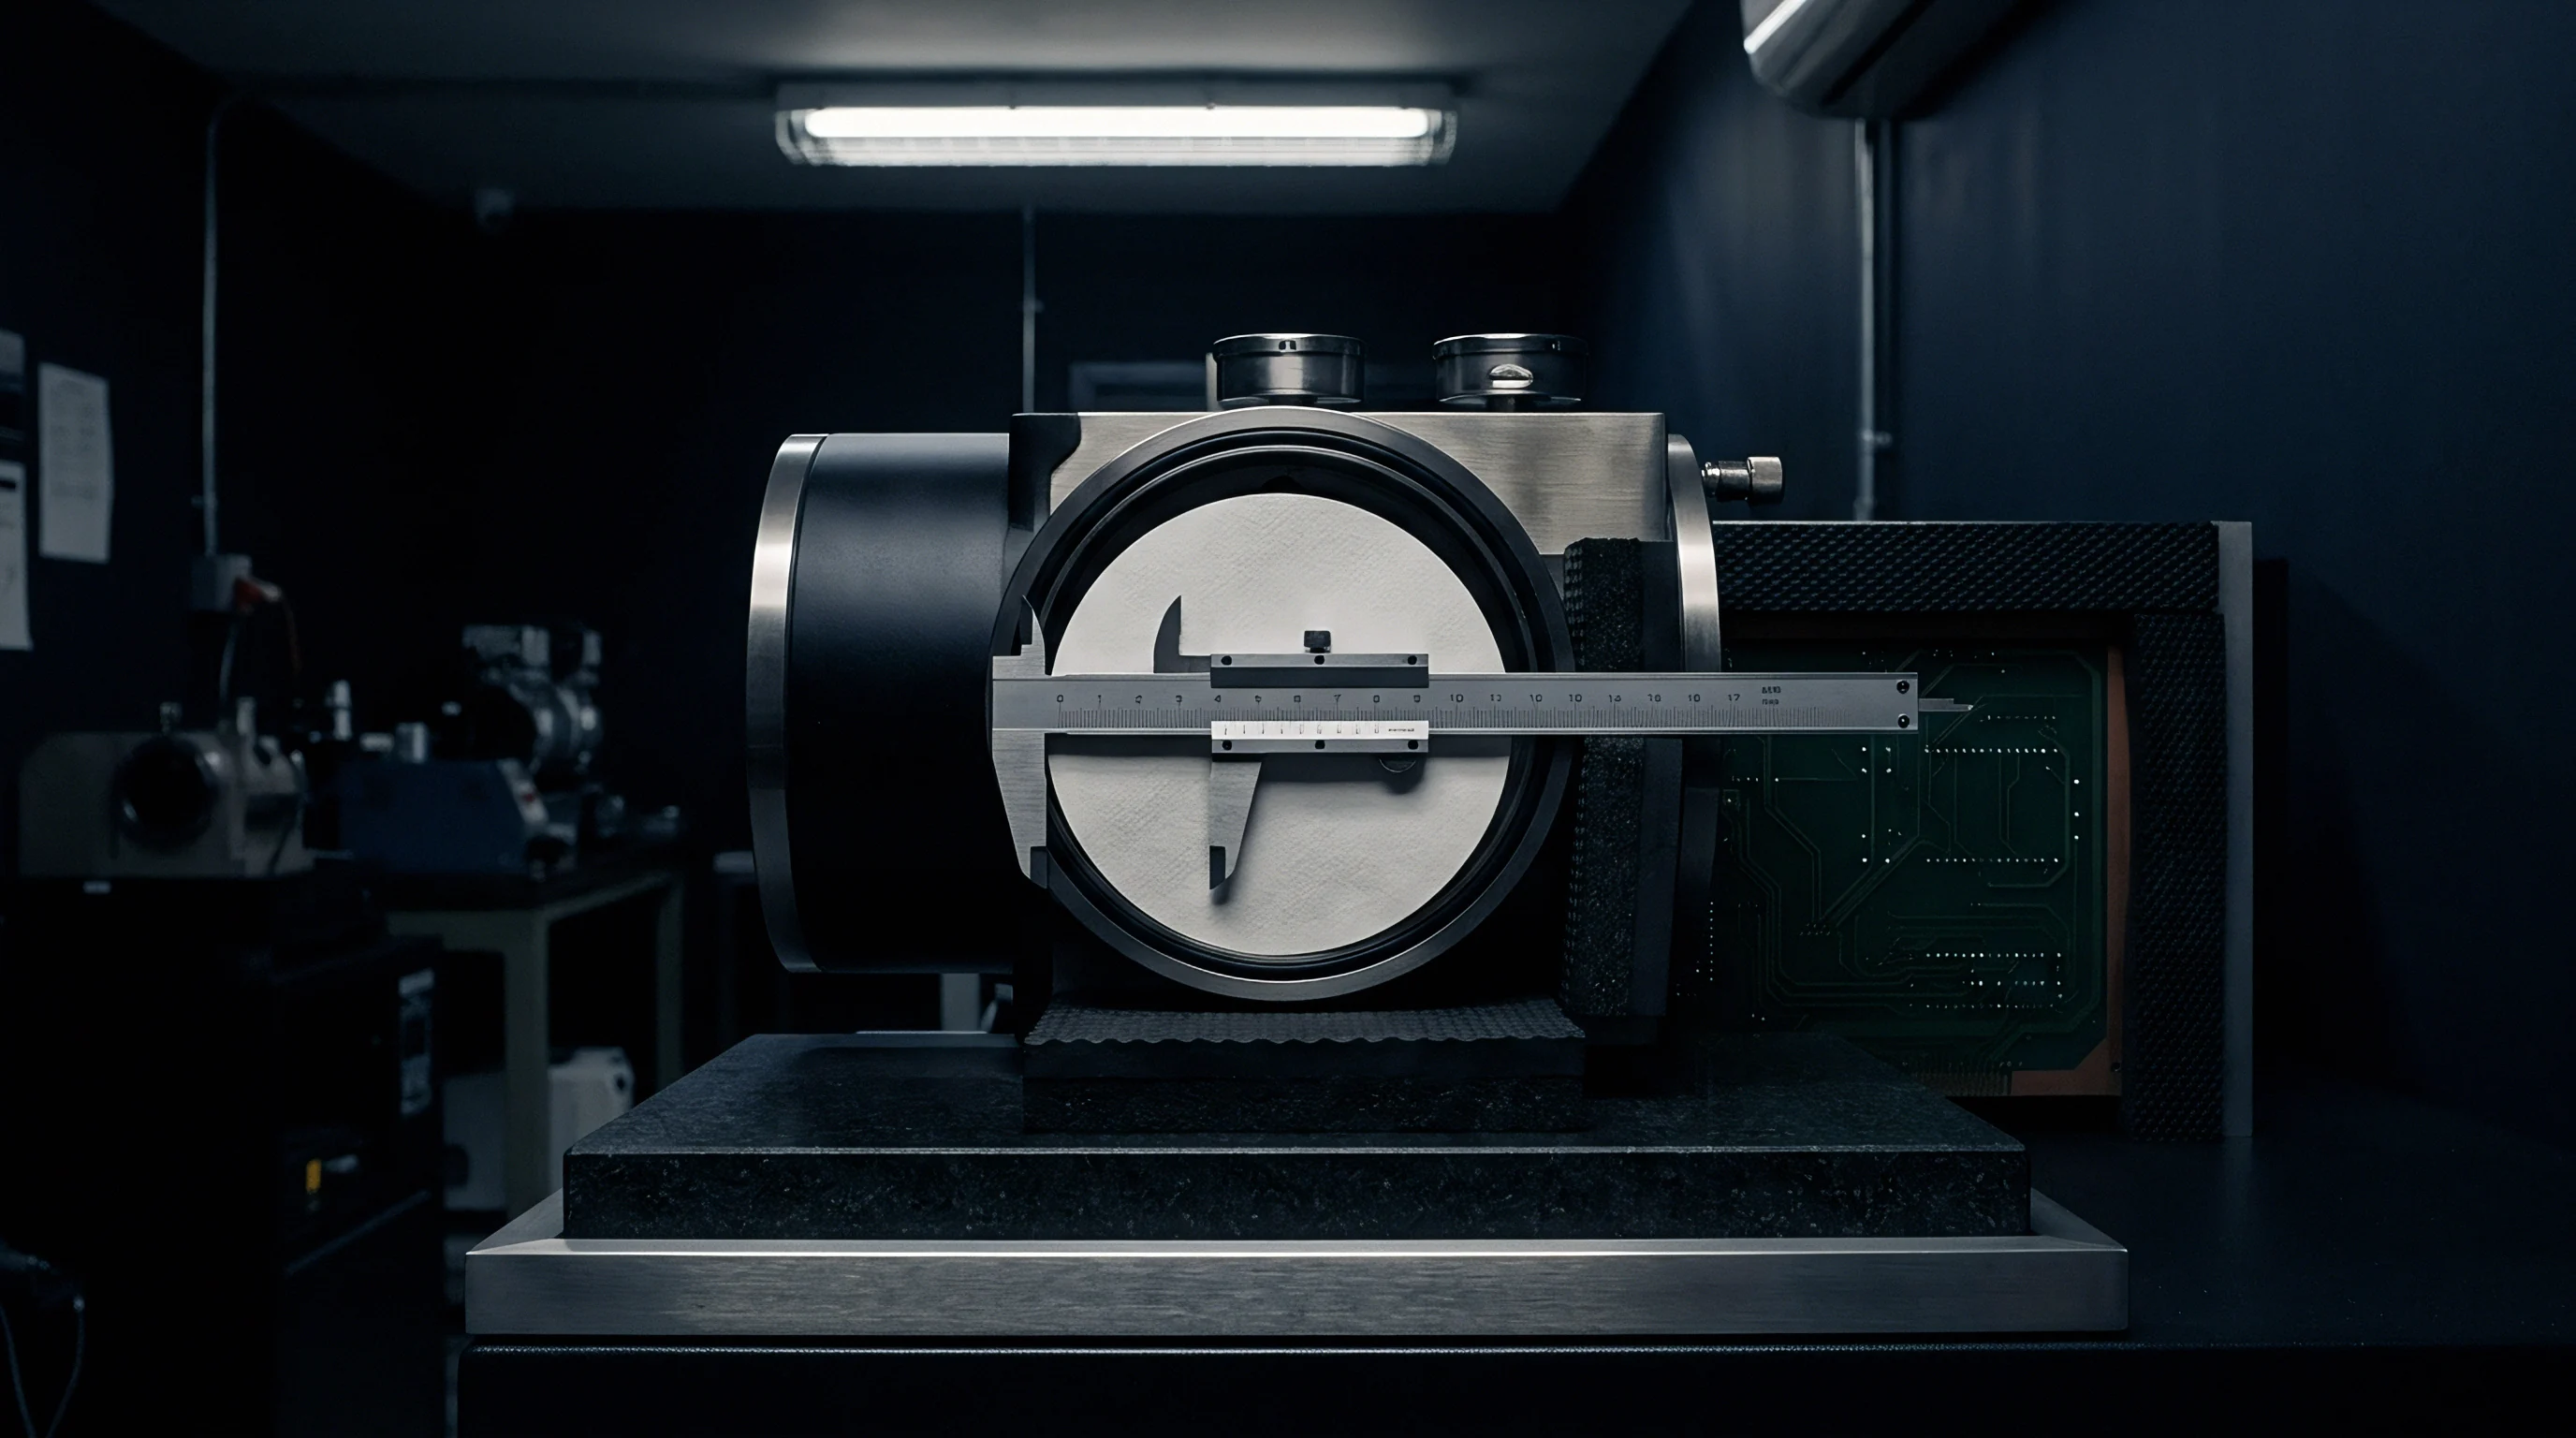
Contact impedance between pin tips and aluminum terminals distorts internal resistance readings if clamping force drops below forty Newtons. Four-wire Kelvin probe setups isolate lead resistance by separating current injection from voltage sensing. Gold- or rhodium-plated spring pins help preserve contact geometry across repetitive cycles, while regular maintenance schedules prevent electrolyte residue and aluminum oxide scale from building up on probe contact points.
Thermal stabilization in the test hall keeps chemical kinetics uniform across batches. Because ambient shifts alter electrolyte conductivity and open circuit voltage, unconditioned test spaces generate false out-of-spec flags. Containers arriving from dock facilities need forty-eight hours of staging in climate-controlled bays to bring core jelly-roll temperatures to twenty-three degrees Celsius, plus or minus two degrees, before screening begins.
A two-degree Celsius ambient temperature shift alters cell open circuit voltage readings by zero point four millivolts during incoming batch screening.
Measurement System Analysis for Low Impedance Cells
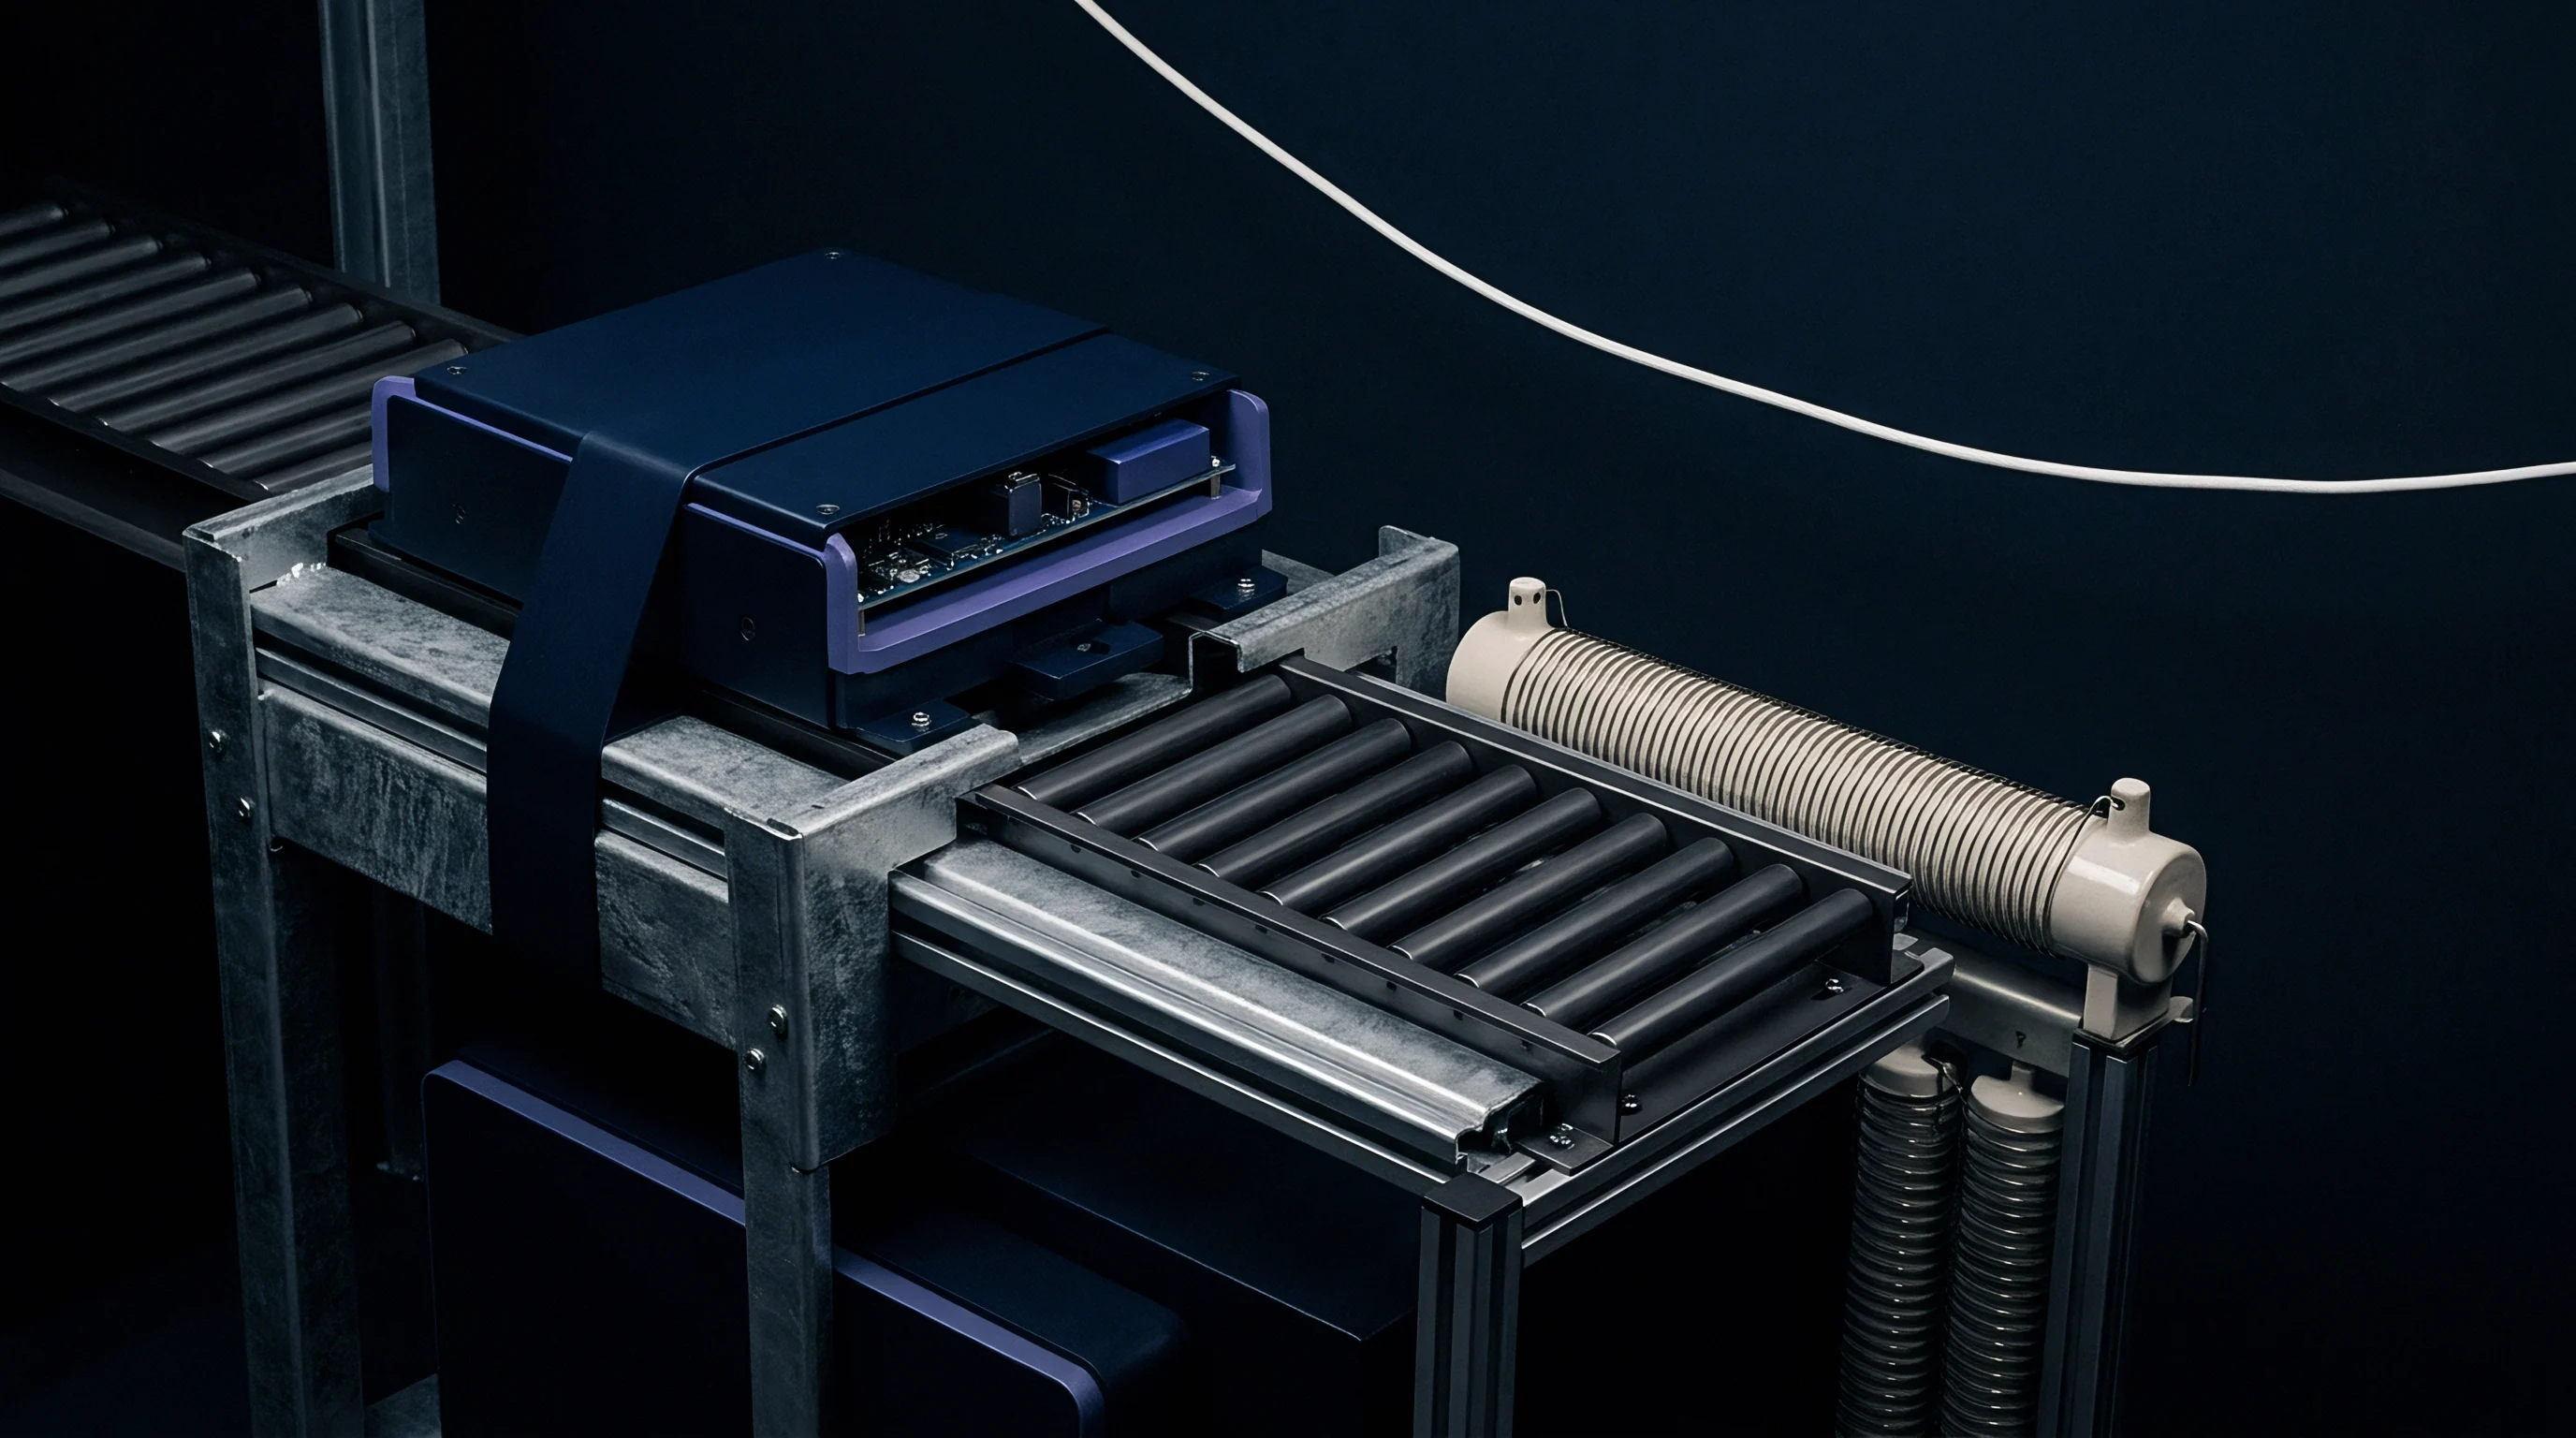
Testing sub-milliohm prismatic cells requires four-wire Kelvin fixtures paired with zero-point calibration protocols. One-kilohertz AC excitation signals isolate charge-transfer resistance across electrode interfaces, while short DC pulse tests measure total resistance across collector foils, separator transport, and diffusion polarization. Detecting subtle lot-level drift requires instrument resolution down to zero point zero zero one milliohm.
Common metrology failure modes skew statistical metrics, shifting batch means and inflating standard deviations:
- Pneumatic Clamp Pressure Decay drops terminal contact force below forty Newtons, triggering artificial spikes in measured AC internal resistance.
- Probe Tip Surface Oxidation leaves non-conductive oxide layers that add parasitic resistance to Kelvin voltage loops.
- Ambient Temperature Swings change electrolyte conductivity, creating artificial variance between batches tested at different times of day.
- Uncompensated Wire Inductance in high-current DC pulse leads skews short-duration voltage drop measurements.
- Flatness Fixture Misalignment applies uneven pressure during thickness checks, corrupting dimensional expansion data.
Uncompensated readings and uncalibrated test stations shift calculated distributions outside actual boundaries, hurting yield by driving improper container rejections or letting non-conforming cells reach module assembly lines.


Variance
Cross-border ocean freight exposes shipments to temperature swings and constant vibration, changing baseline battery metrics along the way. Cells packed in wooden crates endure ocean temperatures from zero degrees to forty-five degrees Celsius depending on transit corridors. Mechanical vibration causes active materials to settle, redistributes free electrolyte, and shifts separator contact surfaces.
Comparing port screening records against factory dispatch logs isolates ocean transit effects from factory defects.
Transit-induced changes show up as altered self-discharge rates, higher internal resistance, and slight voltage drops. Units shipped at thirty percent state of charge under UN 38.3 regulations still experience slow self-discharge during transit. Calculating true transit discharge requires matching factory test timestamps against port inspection times; accelerated decay points to ceramic separator contamination or early dendrite formation.

Which Sampling Rate Isolates Transmitted Thermal Settling Drift?
Sampling three cells per thousand across top, middle, and bottom crate layers flags thermal gradients before bulk unpacking. Crate position inside a shipping container creates clear thermal microclimates: deck-loaded containers face heavy solar heating, while interior hold shipments remain warm but steady. Sampling plans need to cover these spatial positions to separate transit-induced thermal variation from factory production variance.
| Transit Condition | Mean OCV Delta | Mean AC-IR Delta | Mean K-Value | Out-of-Spec Risk |
|---|---|---|---|---|
| Refrigerated Container (15°C) | -1.2 mV | +0.01 mΩ | 0.04 mV/day | Negligible (< 0.01%) |
| Standard Hold (25°C) | -3.5 mV | +0.02 mΩ | 0.12 mV/day | Low (< 0.10%) |
| Deck Layer High Heat (45°C) | -11.8 mV | +0.07 mΩ | 0.39 mV/day | Elevated (2.40%) |
| Vibration Heavy Route (Rough Sea) | -4.1 mV | +0.05 mΩ | 0.15 mV/day | Moderate (0.80%) |

Self Discharge Rate Shift during Long Container Freight
Voltage decay over six weeks at sea highlights micro-shorts through ceramic separator coatings. The K-value measures this daily decay rate, calculated as initial voltage minus final voltage divided by transit days. Baseline LFP cells maintain very low K-values in controlled settings, so elevated numbers signal transition metal dissolution, electrolyte impurities, or structural separator flaws.
Because thermal drift corrupts screening data and rapid voltage decay signals separator damage, baseline statistical limits for K-values follow skewed log-normal distributions rather than standard Gaussian curves. Upper control limits require log-normal transformation of raw readings before calculating control boundaries, ensuring high K-value units are caught before entering finished battery packs.
UN 38.3 transport certification provisions invalidate factory grading when cell voltage decay exceeds zero point five millivolts per day during transit.
Cells exposed to elevated shipping temperatures stabilize to true electrochemical baselines within seventy-two hours of ambient thermal equilibration.


Batch
Managing shipments of ten thousand cells requires valid acceptance sampling to control incoming quality without testing every unit. One hundred percent inspection drives up handling overhead and risks damaging terminal pads through repeated probe insertions. Acceptance sampling relies on statistical probability to evaluate lot compliance from representative sub-samples, guided by frameworks in ANSI/ASQ Z1.4 and ISO 2859-1.
Acceptable quality limit (AQL) thresholds specify the maximum defect percentage considered acceptable as a process average, balancing inspection cost against operational risk. Critical safety defects ~ like reverse polarity, housing shorts, or active electrolyte leaks ~ carry a tight AQL of zero point zero six five. Major functional defects, including out-of-spec capacity or high internal resistance, use an AQL of zero point two five.
Minor cosmetic issues, such as scuffed matrix codes or shell scratches, operate at an AQL of one point zero.

Acceptance Sampling Plans for Inbound Prismatic Containers
ANSI/ASQ Z1.4 sampling tables define sample counts based on overall lot size and targeted AQL levels. Normal General Inspection Level II is the typical starting baseline for inbound container checks. For a shipment of ten thousand 280Ah cells, Level II inspection designates code letter M, calling for three hundred fifteen cells sampled randomly across all pallet locations.
Single sampling plans pass the lot if defect counts stay at or below the acceptance number and reject it if defects hit the rejection threshold. Double sampling plans start with a smaller initial pull and only pull a second sample if defect counts land in the indeterminate zone between accept and reject levels. This reduces testing hours when shipment quality is consistently high.
Sampling across container depth rather than pallet doors prevents ocean thermal gradient bias from skewing cell impedance distributions.

Statistical Lot Retention and Release Workflows
Non-conforming inbound shipments trigger immediate quarantine holds in the warehouse management system pending laboratory analysis, as unchecked drift invalidates batch data and full-lot rejections disrupt production. Inbound inspection protocols follow structured steps upon arrival at receiving warehouses:
- Verify container seals, temperature logger logs, and external impact indicators when opening dock doors.
- Stage pallets in thermal equilibration bays for forty-eight hours until core temperature reaches twenty-three degrees Celsius.
- Pull three hundred fifteen cells across top, middle, bottom, outer, and inner pallet layers per ANSI/ASQ Z1.4 Level II Code M.
- Log barcode serials into statistical process control software to match incoming values against factory birth records.
- Measure open circuit voltage, AC internal resistance, and four-point dimensions under three hundred kilograms clamp load on automated rigs.
- Compute sample mean, standard deviation, and capability metrics for each parameter against agreed control limits.
- Issue automated lot release certificates if defect counts stay within tolerance, or lock quarantine orders if statistical limits fail.
Rejected lots require supplier replacement or financial credit under letter of credit terms.

Margin
Dimensional envelope tolerances for prismatic formats determine module clearances and laser welding consistency. Cased cells undergo reversible volumetric expansion during charge cycles and gradual irreversible swelling over operational life. Nominal factory tolerances specify case width, height, thickness, and terminal coplanarity; out-of-spec dimensions distort structural stacks and apply uneven compression across internal jelly rolls.
Managing thickness variance at incoming inspection prevents module compression failures. Standard 280Ah cells specify seventy-one point five millimeters nominal thickness under three hundred kilograms of uniform fixture load. Measuring uncompressed cells introduces false variance from flexible side-wall flexing, making standardized clamping essential for tracking true pre-charge dimensional trends.

Dimensional Swell and Structural Tolerance Stacks
State-of-charge expansion stresses casing walls and internal rolls; an LFP cell expands up to one point five percent between zero and one hundred percent charge state. Solid electrolyte interphase growth adds further irreversible expansion over extended cycling. Incoming screening evaluates fresh cell thickness under controlled compression to distinguish baseline manufacturing variation from temporary thermal or charge-state swelling.
Because loose clamps and poor fixtures corrupt thickness and voltage trends, thick cells can crush module frames if dimensional distributions drift past mechanical stack-up budgets. Positive thickness shifts increase stack compression beyond design limits, risking internal separator crush, electrical shorts, or structural tie-rod failure.
| Dimension | Nominal Size | Tolerance Band | Assembly Consequence of Out-of-Spec Deviation |
|---|---|---|---|
| Cell Thickness (300 kg load) | 71.50 mm | +0.80 / -0.40 mm | Over-compression of module frames, insulation pad crush |
| Cell Width (Case Base) | 173.70 mm | ±0.50 mm | Module side plate gap variance, thermal pad contact loss |
| Total Height (Inc. Terminals) | 207.20 mm | ±0.60 mm | Laser welding focal shift, top cover clearance violation |
| Terminal Coplanarity | 0.00 mm | ±0.30 mm | Busbar gap distance, weld blow-through, high joint resistance |

Busbar Interface Coplanarity and Welding Windows
Terminal height discrepancies over zero point three millimeters cause focal length shifts during automated laser welding. Joining copper or aluminum busbars to cell terminals requires uniform, gap-free contact; vertical variations create air gaps that disrupt laser beam energy absorption. Gaps greater than zero point one millimeter cause weld blow-through, porosity, or incomplete penetration, elevating joint resistance.
Evaluating non-conforming lot variances involves reviewing downstream tooling flexibility and process margin:
- Downstream Laser Welding Adjustment capability to dynamically adjust focal height using vision sensor mapping.
- Module Housing Compression Tolerance reserves that absorb stack expansion without exceeding frame shear limits.
- Busbar Flexure Joint Geometry design margins that tolerate terminal displacement without stressing cell seals.
- Thermal Interface Material Gap Fill ranges that maintain heat transfer despite minor base width variations.
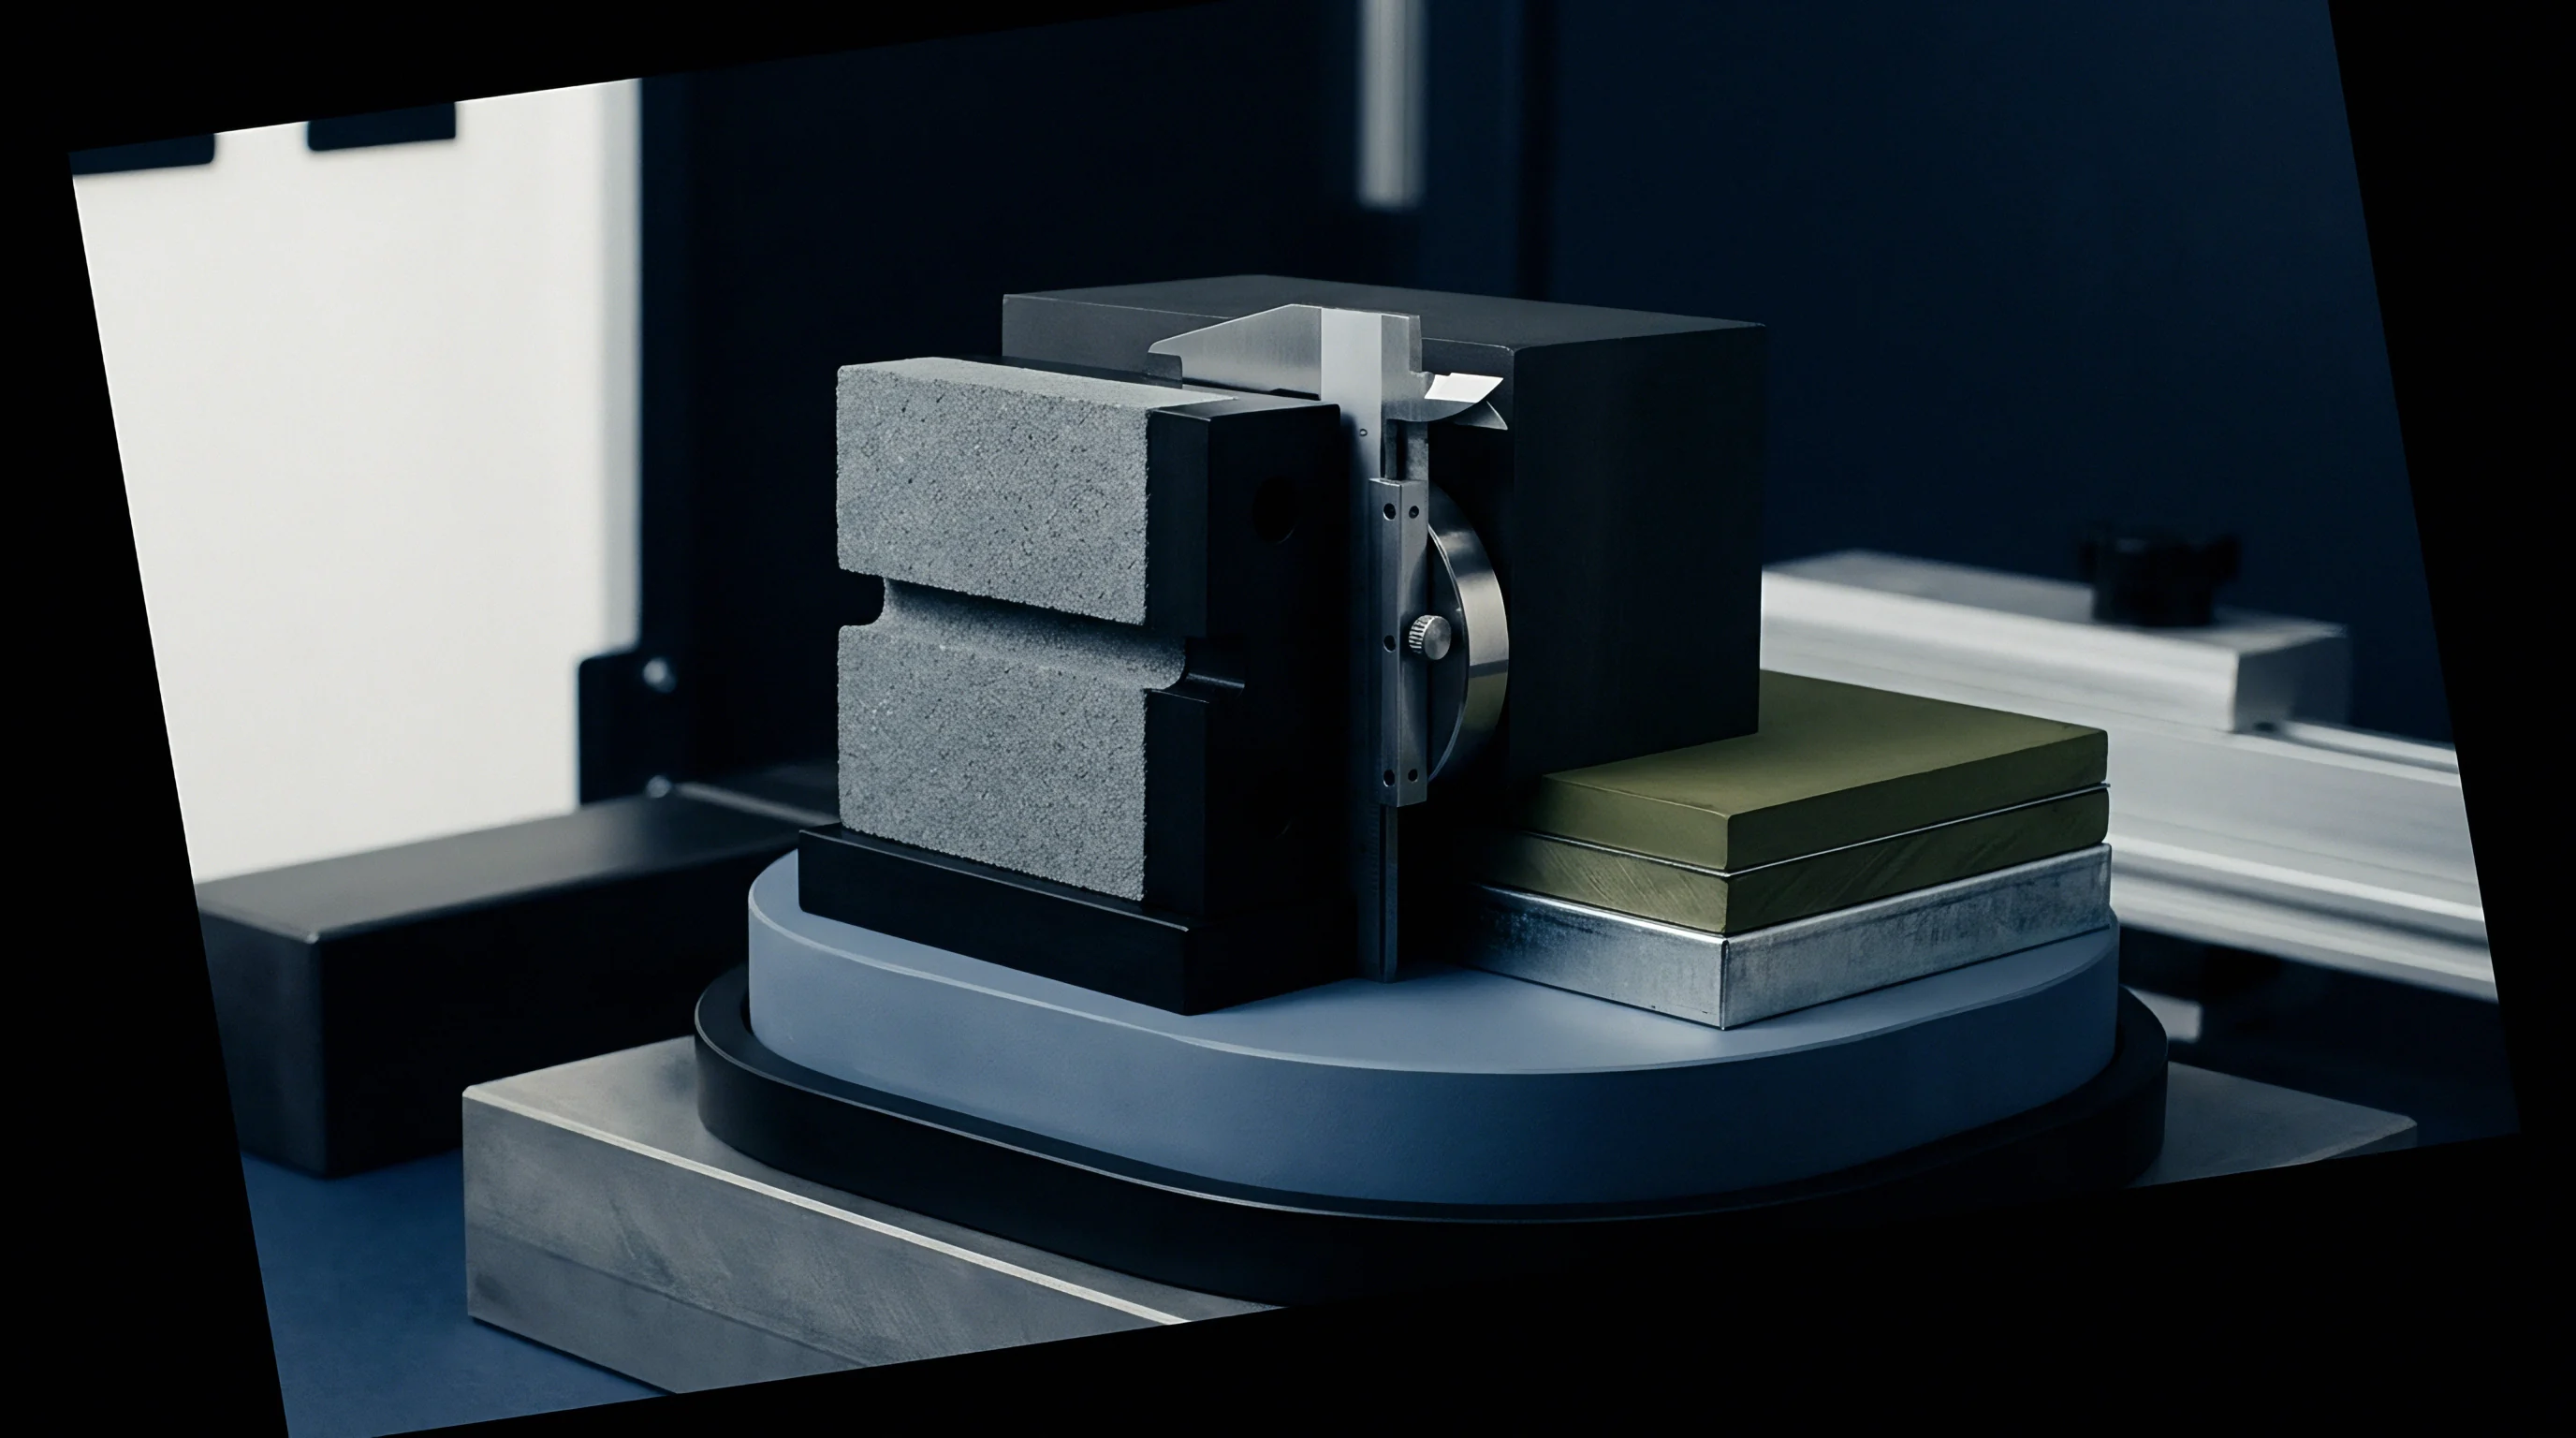
Can automated laser welding vision systems adapt focal height for incoming terminal height variations without slowing down assembly line takt times?

Recourse
Supply agreements for imported battery cells establish contractual remedies when incoming lots fail agreed statistical thresholds. Given freight costs, duties, and tight delivery schedules, non-conforming shipments create heavy financial exposure. Defining technical non-conformance frameworks ties statistical screening directly to payment release, detailing test protocols, lab accreditation standards, and dispute timelines.
Vendor non-conformance reports document statistical limit breaches identified during receiving inspection, combining raw test logs, instrument serial numbers, temperature records, and capability metrics. Submitting these reports within contractually defined inspection windows protects the buyer’s right to reject lots, withhold funds, or request immediate replacement shipments.

Commercial Remedies for Non Conforming Cell Shipments
Filing non-conformance notices within seventy-two hours of port discharge preserves claims against documentary letters of credit. Linking payment release schedules to inspection approval allows issuing banks to hold final funds until test certificates confirm compliance. Rejection terms clarify whether non-conforming lots are returned at vendor expense or scrapped locally with credit applied to future orders.
Dispute resolution clauses designate accredited third-party labs to re-test quarantined lots if vendors challenge initial screening results, with testing costs billed to the losing party. Specifying identical fixture designs, instrument models, and thermal conditioning protocols in the purchase contract avoids technical friction during arbitration.
Commercial disputes over imported cell grading settle on raw test logs recorded within seventy two hours of port clearance.
Supplier Audit Mechanisms and Escrow Holdbacks
Contractual retainage terms withhold ten percent of payment until incoming screening confirms lot uniformity. Escrow arrangements protect buyers from paying for non-conforming goods before verification is complete, while recurring quality variances unlock factory audit rights, allowing quality engineers to inspect overseas production lines, test channels, and raw material records directly.
Financial remedies often cover secondary losses caused by rejected shipments. Purchase agreements include penalty terms covering port demurrage, re-inspection labor, and line downtime costs caused by quarantine delays. Connecting statistical process control metrics directly to escrow releases keeps manufacturer quality incentives aligned with buyer integration standards.