Designing Standardized Cold Weather Thermal Test Protocols for Commercial Vehicle Cell Qualification
Standardized cold weather thermal protocols prevent subzero lithium plating by aligning chamber soak times, charge derating, and impedance verification.
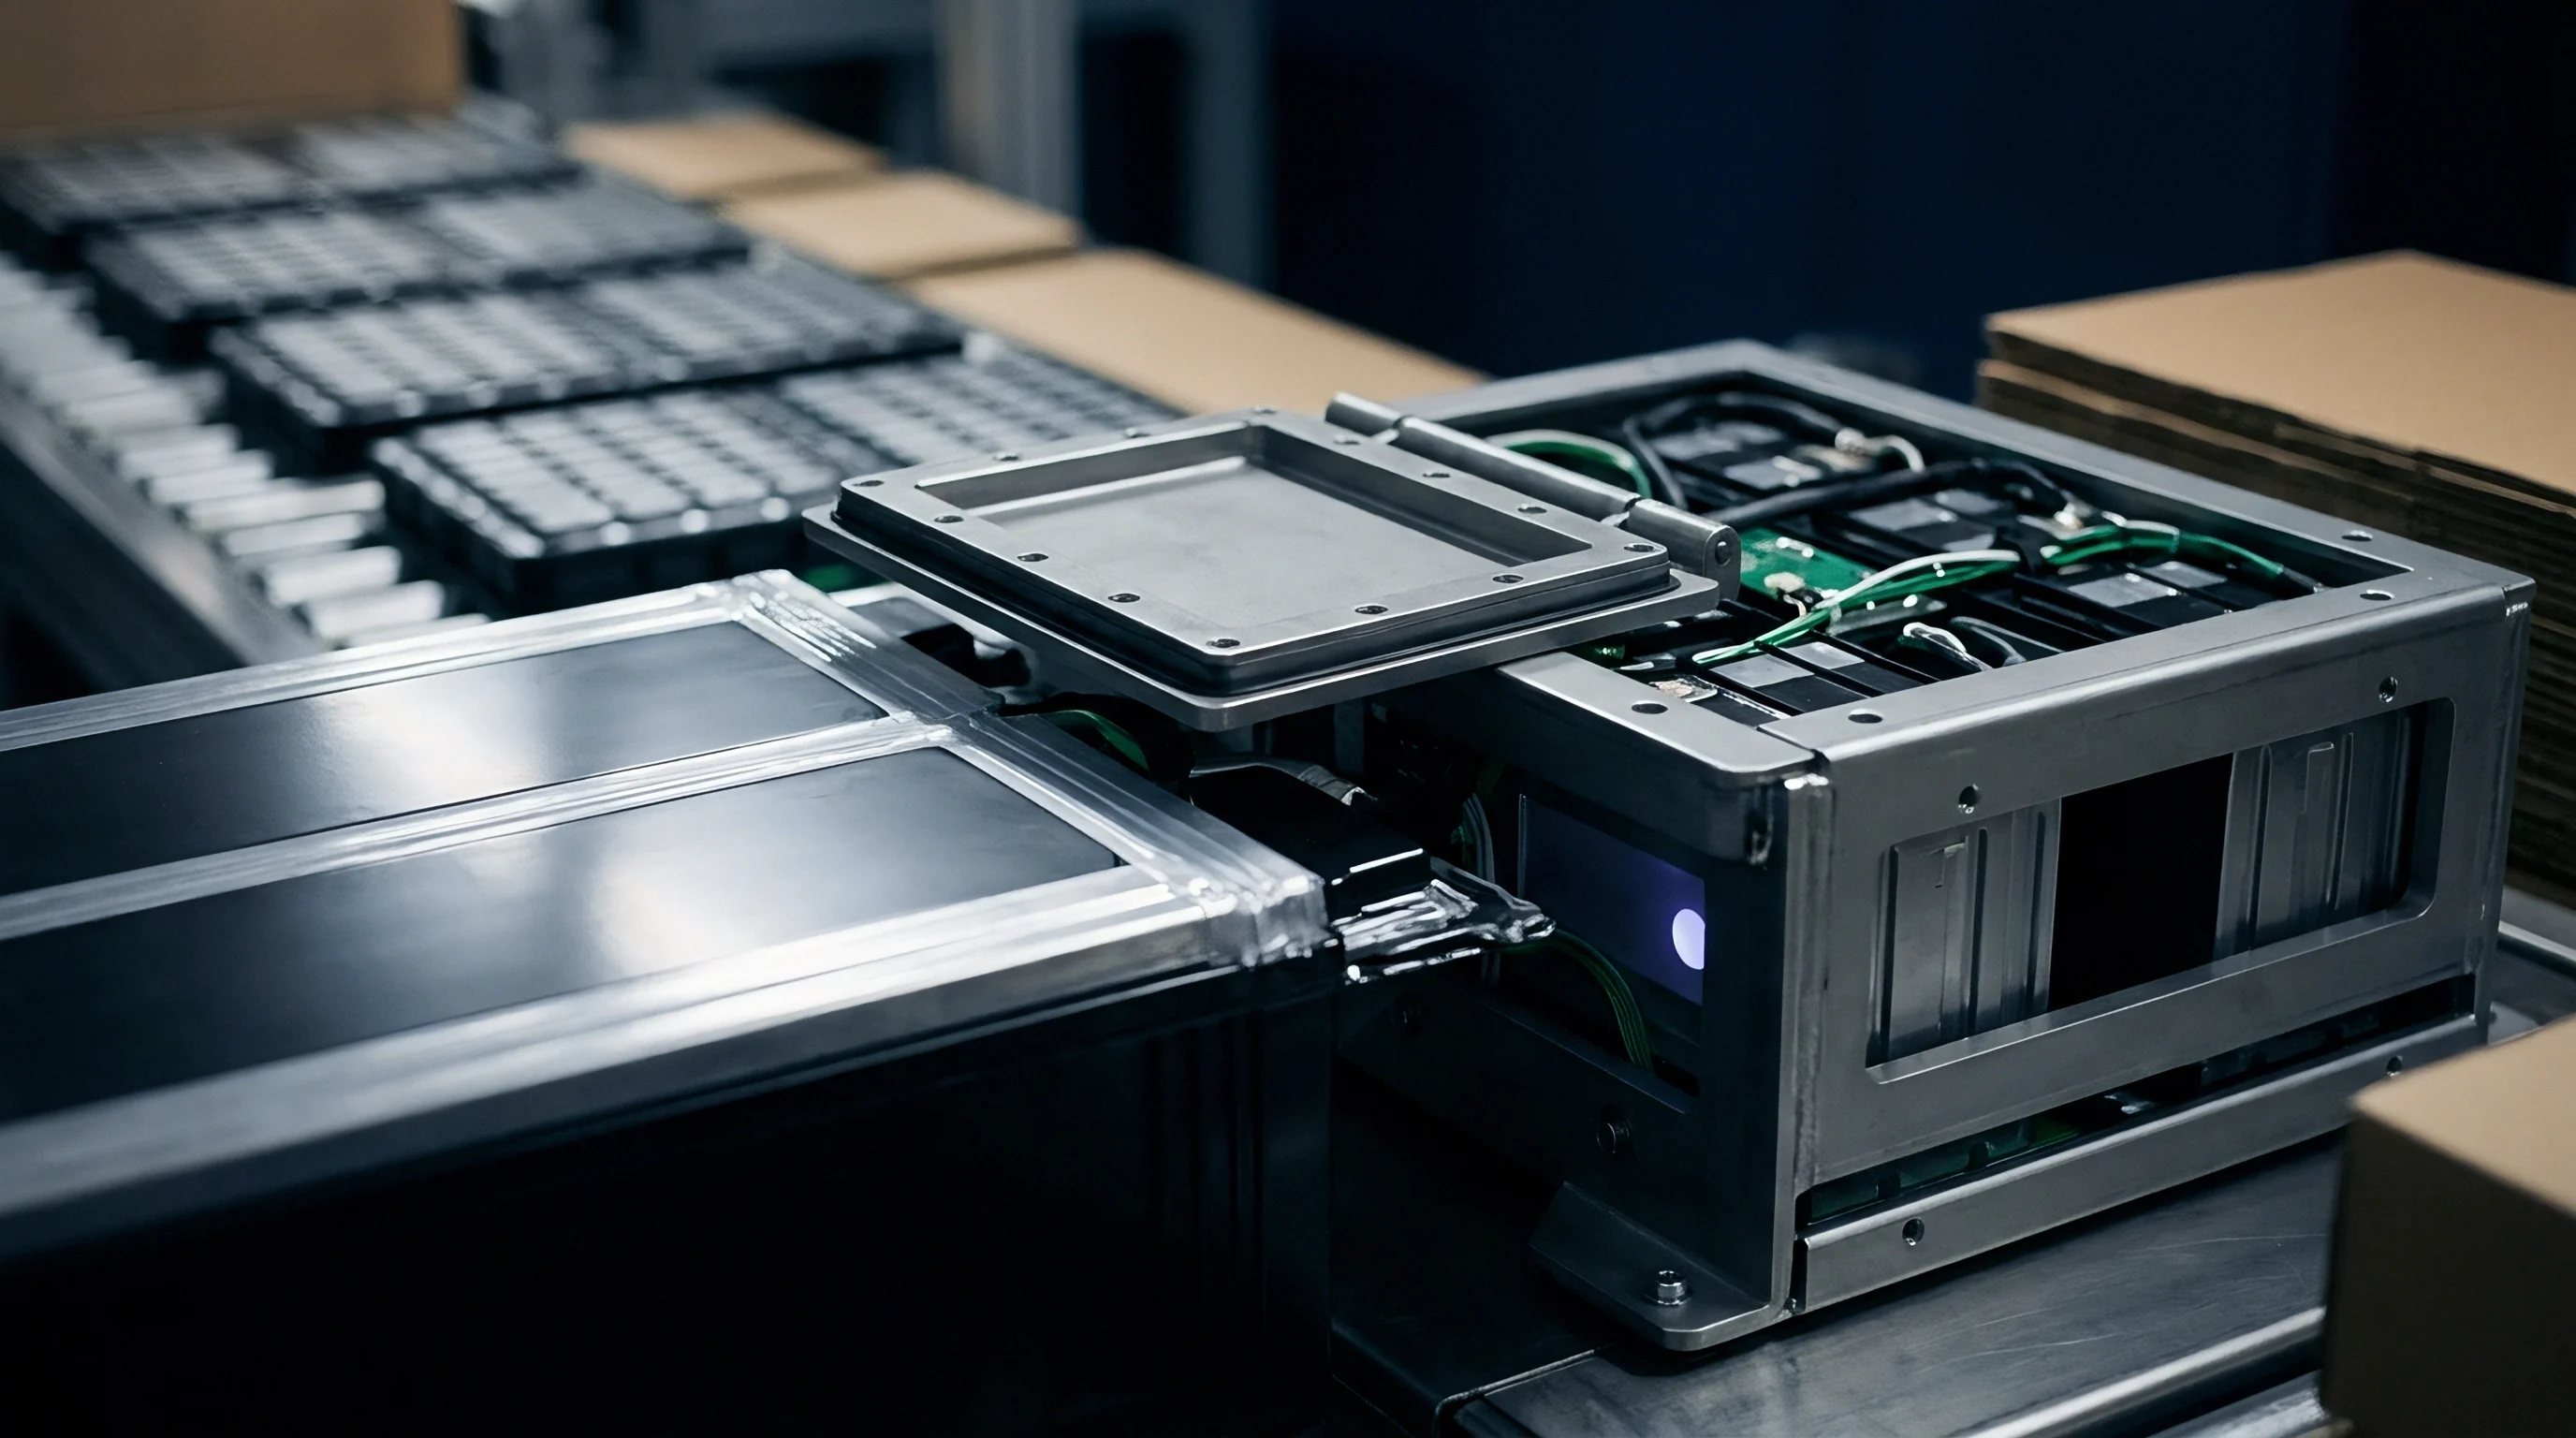

Chamber
Thermal qualification of heavy-duty commercial vehicle cells requires tight control over temperature transitions and boundary conditions. Large-format prismatic cells, from 280 Ah to 320 Ah capacity, hold considerable thermal mass. Dropping a room-temperature cell into a cold chamber set to minus thirty degrees Celsius creates steep gradients between the casing and its internal geometric center.
If electrical testing starts before the core reaches thermodynamic equilibrium, data logs record transient thermal imbalance instead of true subzero electrochemical behavior. Engineers prevent this by grounding soak times on core-to-surface temperature convergence rather than fixed clock intervals.
Blowing cold air across cell surfaces at high or erratic speeds skews surface temperature readings. High fan speeds inside environmental chambers alter convective heat transfer, cooling the outer aluminum can while the internal jelly roll stays warm. Test protocols cap forced air velocity right next to the cells at under 1.5 meters per second.
Aluminum clamping plates and busbars also act as heat sinks, pulling heat from cell terminals faster than a full battery pack assembly would. Good fixture design counteracts this thermal bridging by placing insulating G10 fiberglass spacers between cells and mounting frames during cold runs.
| Parameter | Test Standard Reference | Target Specification | Acceptable Tolerance | Impact on Qualification Data |
|---|---|---|---|---|
| Chamber Air Velocity | ISO 12405-4 Clause 6.2 | 0.5 to 1.2 m/s | ±0.2 m/s | Prevents artificial surface cooling during high-current discharge pulses |
| Core-Surface Soak Stability | USABC Electric Vehicle Manual | dT/dt < 0.1 °C/h | Max 0.05 °C delta | Eliminates internal thermal gradients prior to electrochemical baseline tests |
| Terminal Fixture Conduction | SAE J2464 Section 4.3 | Isolated copper busbars | G10 plate thermal barrier | Prevents localized heat loss through high-current leads during freeze soak |
| Temperature Sensor Density | IEC 62660-3 Annex B | 4 sensors per cell | ±0.1 °C calibration | Maps surface temperature asymmetry on 300 Ah prismatic formats |
Sensor placement across large cell faces dictates data quality during thermal qualification. Commercial vehicle cells heat unevenly during high C-rate pulse discharges at low temperatures, so placing one thermocouple at the geometric center of a broad face misses hot spots near the current collector tabs. Standardized cold protocols call for four four-wire Resistance Temperature Detectors per cell ~ at the positive terminal, negative terminal, center of the main face, and lower corner.
During thermal equilibration, tracking temperature deltas across the casing confirms heat transfer has reached steady state before drawing any current.
- Thermal Mass Ratio Matching fixture thermal mass to cell mass prevents artificial buffering during rapid temperature ramps.
- Sensor Contact Pressure Thermocouple beads held against cell cans with constant spring pressure keep thermal contact resistance below 0.05 K/W.
- Current Lead Sizing Power leads routed into the chamber use heavy gauge copper to limit resistive I2R heating at subzero ambient conditions.
- Data Acquisition Rate Logging voltage and temperature above 10 Hz captures fast polarization shifts during cold pulse loads.
Cell storage before chamber loading can introduce subtle thermal history effects. Moving cells directly from a warm room into a cold environment induces internal mechanical stress as copper current collectors and graphite anode coatings contract at different rates. Qualification protocols avoid this by requiring a four-hour baseline conditioning period at twenty-five degrees Celsius before starting pull-down steps.
Ramp rates are capped at one degree Celsius per minute to prevent thermal shock and delamination at electrode-separator interfaces. When unexpected capacity drops occur at low temperatures, the cause is often higher internal resistance across the solid electrolyte interphase rather than an incomplete thermal soak.

Kinetics
Subzero temperatures push lithium-ion cells into regimes governed by mass-transport bottlenecks. As ambient conditions fall from twenty-five degrees Celsius down to minus thirty, electrolyte viscosity rises sharply and ionic conductivity drops by over an order of magnitude. Common organic carbonate blends, like ethylene carbonate mixed with dimethyl carbonate, lose dielectric strength while their solvation shells become more stable.
This subjects migrating lithium ions to high fluid drag, throttling movement between cathode and anode structures.
Lithium-ion bulk electrolyte conductivity drops from 10.5 mS/cm at 25 °C down to 1.2 mS/cm at -20 °C in standard commercial vehicle electrolyte formulations.
At the anode interface, desolvation is the primary kinetic barrier during low-temperature charging. A lithium ion must shed its polar solvent sheath before it can insert into the graphite lattice. With desolvation activation energies between 50 and 70 kJ/mol, this creates a steep obstacle when thermal energy is low.
At the same time, charge transfer resistance across the solid electrolyte interphase grows exponentially with falling temperature, following Arrhenius kinetics. When charge transfer impedance outpaces intercalation kinetics, incoming lithium ions build up on the anode surface instead of intercalating.
Rising overpotential at low temperatures pushes the thermodynamic equilibrium potential of the graphite anode below zero volts relative to a lithium reference electrode. Once anode potential slips below zero during charging, metallic lithium plating becomes energetically preferred over intercalation. This plating forms microscopic dendrites across anode surfaces, tying up active lithium and risking separator puncture.
Qualification protocols for commercial vehicle cells must identify where kinetic overpotential drives anode potential negative, setting clear charge acceptance caps for battery management system software.
Setting safe charge acceptance limits requires mapping exchange current density across temperature. The Butler-Volmer equation describes charge transfer current density as a function of activation overpotential and temperature:
j = j0
Here, j is net current density, j0 is exchange current density, alpha_a and alpha_c are anodic and cathodic charge transfer coefficients, F is Faraday’s constant, eta is activation overpotential, R is the universal gas constant, and T is absolute temperature. As temperature T drops, exchange current density j0 falls off rapidly following an Arrhenius relationship:
j0 = A exp( -Ea / (R T) )
Where A is a pre-exponential factor and Ea is the activation energy for charge transfer. In a commercial 280 Ah prismatic lithium iron phosphate cell at minus twenty degrees Celsius (253.15 K), exchange current density drops to roughly 5 percent of its room-temperature value. Forcing constant charging current under these conditions causes activation overpotential eta to spike.
If cathodic overpotential exceeds the equilibrium insertion potential of graphite (about 80 mV versus Li/Li+ for stage 1 C6 intercalation), local anode potential falls below 0 V versus Li/Li+, starting metallic lithium deposition.
Chemistry choice fundamentally changes subzero behavior. Lithium iron phosphate with a graphite anode suffers severe charge limits at low temperatures because of high desolvation barriers and flat voltage plateaus that obscure state-of-charge tracking. High-nickel NMC offers slightly better subzero ionic mobility, but high-voltage pulse loads accelerate cathode degradation when cold.
Lithium titanate anodes eliminate plating risk altogether since their zero-strain intercalation potential sits at 1.55 V versus Li/Li+, well clear of the lithium deposition threshold. However, lithium titanate energy density is limited to 70-110 Wh/kg, restricting its use to specialized fast-charge transit routes. Charging any cold cell before its core reaches thermal equilibrium invites irreversible lithium plating long before BMS voltage limits trigger.
Relaxation
After low-temperature discharge or pulse charging, cells sit in a non-equilibrium state marked by steep internal concentration gradients. Solid-state diffusion rates inside active material particles track temperature according to Fickian diffusion laws. At minus twenty degrees Celsius, diffusion coefficients drop by two to three orders of magnitude relative to room temperature.
Lithium ions stall near particle surfaces, driving solid-phase concentration polarization that can persist for hours after current stops flowing.
Open-circuit voltage readings taken right after stopping a subzero load do not reflect true bulk state of charge. At low temperatures, voltage relaxation follows an extended, multi-stage path. Fast initial recovery reflects ohmic decay across the electrolyte and current collectors, finishing within milliseconds.
Intermediate relaxation, taking seconds to minutes, stems from charge-transfer decay and double-layer discharge. Long-term relaxation, which can take anywhere from tens of minutes to several hours, is driven by concentration gradient relaxation inside electrode pores and solid particles ~ and this final phase dictates true thermodynamic equilibrium.
Subzero cell voltage relaxation requires up to six hours to achieve thermodynamic equilibrium within 0.5 mV stability criteria.

Does Subzero Relaxation Distort Remaining State of Charge?
Battery management systems using open-circuit voltage lookup tables run into major errors when reading post-load voltages at low temperatures. Incomplete relaxation can skew state-of-charge estimates by more than 15 percent in lithium iron phosphate cells. LFP’s flat voltage profile, paired with low-temperature hysteresis loops reaching up to 40 mV, prevents reliable capacity accounting unless strict voltage and thermal equilibrium criteria are met.
Qualification protocols therefore require four to six hours of dwell time at subzero temperatures before logging reference open-circuit voltages.
Differential voltage analysis of subzero relaxation data gives critical insight into electrode degradation. Plotting dV/dQ during micro-current relaxation isolates phase transition peaks for the anode and cathode. When cold, kinetic peak broadening and hysteresis shifts blur these phase boundaries.
Monitoring post-charge relaxation curves decouples mass-transport polarization from structural phase changes. Standardized protocols call for baseline dV/dQ profiles recorded at 0.02C and twenty-five degrees Celsius, providing a benchmark to resolve kinetic distortion in subzero data. Whether post-soak voltage relaxation curves can reliably separate harmless surface charge accumulation from microscopic lithium plating without tearing down the cell remains an open question.

Audit
Post-test physical verification checks whether cold thermal testing caused permanent damage inside the cell. Non-destructive screening run immediately after cold qualification cycles catches early metallic lithium deposition before catastrophic failure happens. Electrochemical impedance spectroscopy at reference temperatures reveals changes in high-frequency arc diameters and low-frequency Warburg tails.
Higher real-axis intercepts point to electrolyte degradation, while expanding charge-transfer semicircles signal solid electrolyte interphase thickening driven by reactions with active lithium.
Destructive physical analysis remains the benchmark for cold-weather cell qualification. Teardown labs open cells inside argon gloveboxes kept under 0.1 parts per million of moisture and oxygen. Stripping anode plates from cold-tested cells allows direct visual and microscopic inspection for metallic lithium plating.
Fresh lithium deposits show up as a bright silver or light gray metallic sheen, standing out against the dark brown or gold tone of fully lithiated graphite. Simple chemical checks, like placing a drop of deionized water on extracted anode samples to watch for hydrogen gas evolution, confirm unreacted metallic lithium.
- Discharge cell to zero percent state of charge at reference ambient temperature, followed by a twenty-four hour thermal soak.
- Transfer the cell into an argon glovebox atmosphere with moisture content below 0.1 ppm.
- Decrimp or cut the pouch seal using non-sparking ceramic tools to prevent short circuits.
- Extract the electrode stack and unroll individual anode plates under monochromatic light.
- Photograph and map anode surface coverage to document silver metallic lithium deposits.
- Sample targeted anode sections via scanning electron microscopy to evaluate dendrite morphology.
- Perform X-ray photoelectron spectroscopy on anode surface films to quantify metallic lithium content against the organosilicon binder matrix.
Combining scanning electron microscopy with energy-dispersive X-ray spectroscopy clarifies the structure of low-temperature lithium deposits. Plated lithium forms mossy, dendritic, or planar features depending on local current density and charging temperature. High-surface-area mossy lithium accelerates secondary reactions with carbonate solvents, stripping usable electrolyte from the cell.
Acoustic microscopy offers a non-destructive alternative, sending high-frequency ultrasound through intact cells to spot gas pockets or density changes tied to lithium plating and interface delamination. Skipping teardown inspections lets hidden dendritic growth slip through qualification, leaving fleet operators vulnerable to sudden internal short circuits during later warm-weather fast charging.

Envelope
Commercial battery management systems rely on programmed operating limits to prevent thermal stress and lithium plating in winter operations. Standardized cold testing maps out safe operating envelopes across temperature, state of charge, and current density. Because commercial duty cycles require repeated power pulses for acceleration, regenerative braking, and cab heating, test matrices must evaluate cells across distinct temperature steps ~ typically zero, minus ten, minus twenty, and minus thirty degrees Celsius.
| Ambient Temp (°C) | Max Continuous Charge Rate | Peak 10s Discharge Rate | Max SOC for Charging | Internal Heating Demand |
|---|---|---|---|---|
| 25 to 0 | 1.0C (280 A) | 3.0C (840 A) | 100 % | 0 W/kWh |
| -10 | 0.2C (56 A) | 1.5C (420 A) | 90 % | 12 W/kWh |
| -20 | 0.05C (14 A) | 0.8C (224 A) | 80 % | 35 W/kWh |
| -30 | 0.00C (0 A) | 0.3C (84 A) | 50 % | 65 W/kWh |
Low-temperature test protocols need to incorporate realistic thermal management heating curves. Heavy-duty commercial trucks rely on liquid-glycol loops or PTC heaters to warm battery packs in winter. Qualification testing compares vehicle pre-heating strategies ~ specifically internal self-heating via AC impedance excitation against external heating via liquid cold plates.
Internal AC excitation generates uniform volumetric heat inside the core, while external heating plates set up steep internal thermal gradients that delay charge readiness.
Subzero charge derating rules shift financial liability under ISO 12405-4 when cell degradation occurs outside specified operational envelope boundaries.
Derating boundaries mark the point where charge transfer resistance begins to exceed mass transport capacity. In arctic fleet operation, charging protocols enforce strict multi-stage derating. At minus twenty degrees Celsius, continuous charging current must stay below 0.05C until active heaters bring core temperatures above zero.
Fast charging at 1.0C rates below ten degrees Celsius violates safe operating limits on graphite anodes, causing severe capacity loss in under fifty cycles.
- Temperature Step Calibration Evaluating cells in 5 °C increments pinpoint non-linear drops in electrolyte conductivity.
- State of Charge Window Restrictions Capping maximum charging SOC at low temperatures prevents anode overpotential spikes near full charge.
- Pulse Duration Limits High-current discharge pulses are capped at 10 seconds under subzero conditions to minimize localized Joule heating shock.
- Pre-Heating Interlock Checks BMS logic must block fast-charge commands until heater loops reach minimum operating temperature.
Harmonizing international standards remains difficult because testing goals diverge across regions. SAE J2464 focuses on safety under severe environmental stress, prescribing thermal shock and freeze-thaw cycles without electrical load. ISO 12405-4 targets functional performance, evaluating capacity retention and power across defined temperature matrices.
Meanwhile, GB/T 31486 demands that minus twenty degree Celsius discharge capacity retain at least 70 percent of nominal room-temperature capacity. Procurement frameworks need to unify these fragmented standards into a single qualification protocol. Binding manufacturers to ISO 12405-4 derating curves within supply agreements places financial liability for low-temperature capacity loss directly on the vendor.

Margin
Financial protection in commercial battery procurement comes down to linking lab results directly to warranty liability and landed costs. Datasheet performance measured under ideal room-temperature conditions rarely translates to vehicle fleets in northern climates. A cell rated for 4,000 cycles at twenty-five degrees Celsius can drop below 1,200 cycles if charged repeatedly while cold and unheated.
Buyers must calculate landed cost per delivered kilowatt-hour over vehicle lifespans by incorporating realistic subzero capacity fade into financial models.
Warranty exposure spikes when fleets fail to enforce low-temperature charge interlocks. Replacing a 200 kWh to 600 kWh commercial battery pack can account for up to 40 percent of a vehicle’s manufacturing cost, making explicit contract terms critical. Supply agreements need to define exact conditions under which low-temperature capacity guarantees apply.
During subzero pulse testing on prismatic LFP cells, internal resistance growth accelerates by 14 percent whenever charging starts below minus fifteen degrees Celsius without active heating.
Landed cost per delivered cycle rises by 38 percent when unheated subzero operation accelerates capacity fade beyond baseline model assumptions.
Evaluating supplier warranty terms requires assessing the capital exposure caused when cold fleet starts violate cell operating limits. Contracts must spell out the exact soak protocols used during incoming quality checks. When sampling incoming cell lots, chamber soak procedures have to mirror original qualification parameters.
Minor mismatches in chamber airflow, fixture thermal mass, or sensor calibration between vendor and buyer routinely spark disputes over batch rejections.
- Subzero Degradation Reserve Financial reserves set aside per pack to absorb accelerated capacity fade from cold winter duty cycles.
- Thermal Management Energy Penalty Auxiliary energy needed for active pack heating, factored directly into payload efficiency estimates.
- Warranty Excursion Logging BMS data requirements for logging total minutes spent operating outside subzero temperature limits.
- Incoming Lot Acceptance Threshold Statistical sampling rules requiring batch rejection if subzero resistance varies by more than 5 percent across samples.
Structuring contracts around validated thermal test dossiers prevents disputes between cell manufacturers, OEMs, and fleet operators. Qualification filings should include exact thermal soak logs, impedance spectra, and post-freeze teardown reports for every cell chemistry. Clear contractual terms on acceptable subzero degradation protect buyers against premature pack failure.
Finally, folding subzero degradation reserves into landed-cost calculations gives fleet managers realistic total-cost-of-ownership projections before committing capital to long-term vehicle procurements.