Microscopic Reference Electrode Drift Corrections in Commercial Format Three Electrode Battery Life Testing
Correcting microscopic reference electrode drift requires diagnostic OCV relaxation alignment and graphite phase plateau offset calculations during life testing.


Probe
Inserting micro-sensors as third electrodes into sealed commercial cells enables separate measurements of anode and cathode potentials under load. Standard full-cell voltage readings lump both interfaces together, concealing kinetic limitations, solid electrolyte interphase growth, and the onset of lithium plating. Placing a microscopic reference element directly inside the active volume of an 18650, 21700, pouch, or prismatic cell provides an unpolarized baseline to isolate those individual behaviors.
Physical integration into commercial cells involves threading thin metallic micro-wires between electrode wraps or inserting them into the jellyroll center cavity. Polyimide-insulated copper or nickel micro-wires with a pure lithium deposit at the exposed tip are the standard setup. Alternatively, lithium-tin alloy or gold micro-wires can be lithiated in situ before testing.
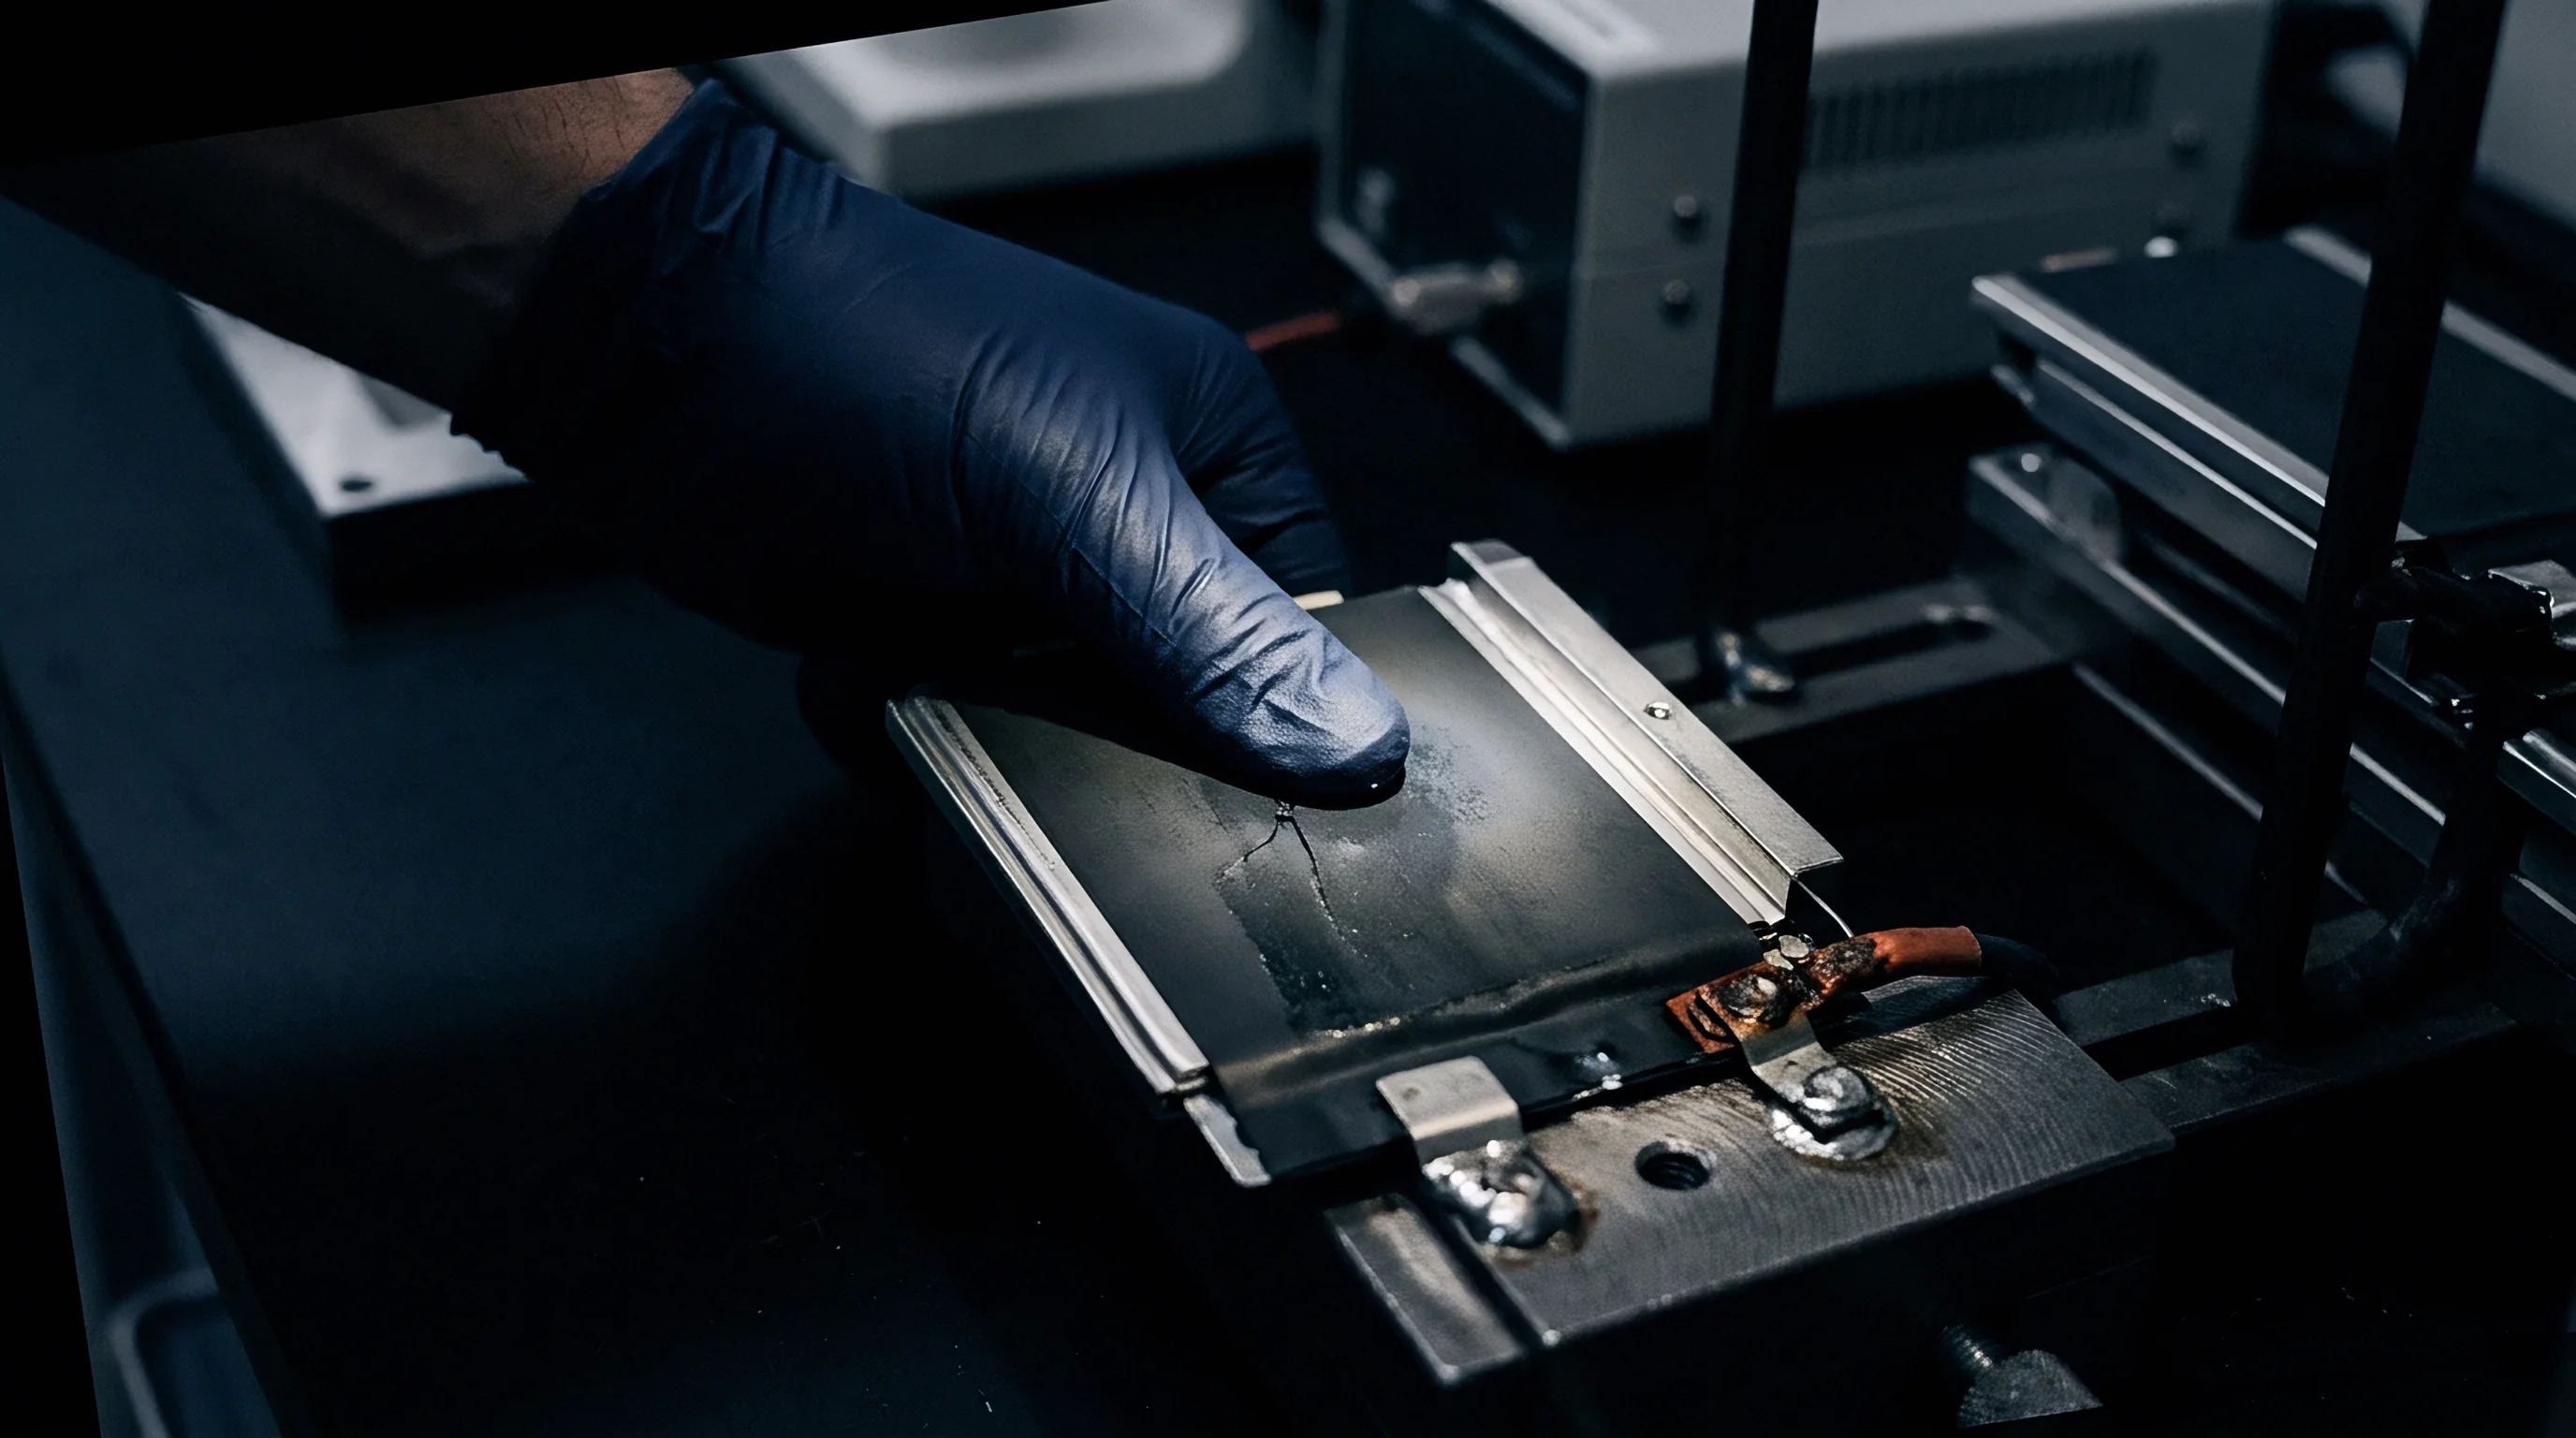
Micro-Wire Geometry in Commercial Formats
Polyimide-sheathed conductors enter cell housings through modified gaskets or seal edges. In pouch cells, micro-wires pass through the heat-sealed perimeter foil using specialized polymer grommets that keep out moisture and prevent solvent loss. In cylindrical formats like 21700 cells, probes feed through modified top caps or laser-drilled ports in the steel canister.
The exposed sensing tip sits directly in the liquid electrolyte, isolated from mechanical contact with either current collector.
- Pure lithium wire micro-sensors consist of a fifty to one hundred micrometer diameter copper core plated with metallic lithium, offering a direct zero-volt reference potential against Li/Li+ in conventional alkyl carbonate solvents.
- Lithium-tin alloy micro-elements utilize pre-lithiated Sn micro-wires forming a two-phase alloy plateau that offers greater mechanical rigidity and lower chemical reactivity than pure lithium metal.
- Gold-coated copper micro-wires form a lithium-gold alloy during an initial low-current charge pulse, establishing an in-situ reference with reproducible thermodynamic potential.
- Polymer-coated micro-capillaries route ionic pathways through liquid-filled micro-glass tubes, isolating the sensing metal from convective electrolyte flow in the jellyroll overhang.
Sensor placement determines how much geometric ohmic drop contaminates the half-cell potential signal. Positioning the reference micro-wire outside the primary current path minimizes uncompensated electrolyte resistance, preventing large voltage offsets during high-rate charging.
An unpassivated metallic lithium reference wire exhibits up to 35 millivolts of baseline potential shift during the initial 200 hours of continuous electrolyte contact at 45 degrees Celsius.

Electrolyte Wetting and Interfacial Contact
Stable ionic transport between the exposed tip and surrounding liquid keeps charge transfer resistance low. Poor wetting around the sensor raises high-frequency impedance and introduces electromagnetic noise into recording channels. As a result, cell preparation requires high-vacuum electrolyte impregnation to saturate the micro-wire sheath thoroughly.
Placing reference wire entry points away from the primary current path maintains measurement stability by avoiding ionic gradient distortions across the jellyroll.


Instability
Potential drift in microscopic reference elements stems from ongoing chemical and physical interactions inside the cell. Even though reference electrodes carry zero net current during measurement, the chemical potential of the sensing material degrades through side reactions with organic solvents, trace contaminants, and breakdown products.
In commercial cells using carbonate electrolytes with additives like fluoroethylene carbonate or vinylene carbonate, the reference tip continually forms a solid electrolyte interphase. This reaction consumes active lithium from the wire, shifting its open-circuit potential away from the theoretical Li/Li+ redox couple.

Chemical Degradation at the Reference Interface
Metallic lithium oxidizes continuously in alkyl carbonate solvents. Trace water in commercial electrolytes reacts with hexafluorophosphate salts to form hydrofluoric acid, which attacks metallic lithium micro-wires ~ converting active lithium into lithium fluoride and releasing hydrogen gas inside the casing. This corrosion steadily changes the effective surface area and thermodynamic potential of the reference electrode.
Lithium-tin and lithium-bismuth alloy micro-wires form protective surface films that resist acid attack better than pure lithium. However, phase shifts within the alloy matrix still trigger step-wise potential jumps as lithium dissolves into the electrolyte during high-temperature storage.
| Drift Mechanism | Driving Reaction Cause | Potential Shift Rate | Format Impact | Primary Diagnostic Marker |
|---|---|---|---|---|
| Chemical Dissolution | HF acid attack on active lithium metal wire surface | 15 to 50 μV/h | Higher in pouch cells due to moisture permeability | Baseline voltage step during resting cycles |
| Additive Consumption | Continuous FEC decomposition on reference tip | 5 to 20 μV/h | Uniform across pouch and cylindrical cells | Gradual upward drift of working potentials |
| Ionic Crosstalk | Transition metal ion deposition on reference tip | 30 to 80 μV/h | Accelerated at high temperature and high SOC | Abrupt impedance spike on reference channel |
| Alloy Phase Migration | De-lithiation of Li-Sn or Li-Bi wire substrate | 10 to 30 μV/h | Higher in fast-charge high-temperature life tests | Quantized potential steps at phase transitions |

Ionic Crosstalk and Local Field Inhomogeneity
High current densities across the jellyroll create uneven potential gradients in the inter-electrode space. Dissolved transition metal ions ~ manganese, nickel, and cobalt ~ migrate from the cathode and deposit onto the reference surface. Manganese deposition forms parasitic galvanic micro-cells on lithium micro-wires, shifting local electrochemical potential by tens of millivolts over hundreds of operating hours.
As the sensor interface degrades, recorded half-cell potentials drift away from true thermodynamic values, often causing engineers to blame the wrong electrode for observed cell degradation.
Measured anode potential dips during fast charging can reflect intrinsic electrode kinetics rather than reference electrode passivation artifacts.

Recalibration
Algorithmic corrections recover half-cell accuracy by anchoring recorded values to stable thermodynamic baselines. Extended cycle testing yields time-series voltage data that blend real electrode degradation with sensor drift, making periodic recalibration steps during test cycles essential to separate the two signals.
Lithium intercalation into graphite follows well-defined thermodynamic phase transitions, creating distinct features in differential capacity curves at known open-circuit potentials relative to Li/Li+.

Phase Transition Anchor Points in Graphite Anodes
Differential voltage curves recorded during low-rate discharge show distinct OCV plateaus for specific lithium intercalation stages. The transition between stage two and stage one lithiated graphite creates a sharp differential voltage peak at eighty-five millivolts versus Li/Li+. Because this equilibrium depends solely on graphite’s crystal structure, its potential stays fixed over the battery’s lifespan, offering a dependable internal benchmark.
Comparing the recorded peak potential against its theoretical value isolates the exact reference drift at that cycle milestone. Interpolating these offset values across continuous cycling datasets creates a dynamic correction vector.
- Record baseline full-cell and half-cell potentials during a low-rate C/50 reference cycle at twenty-five degrees Celsius.
- Calculate the differential voltage spectrum across the discharge capacity range to identify the graphite stage two transition peak.
- Determine the measured potential offset between the observed peak voltage and the theoretical eighty-five millivolt reference value.
- Fit a multi-segment polynomial curve to the series of potential offsets calculated at successive diagnostic rest intervals.
- Subtract the resulting time-dependent offset array from raw anode and cathode potential time-series data.
Applying uncorrected three-electrode cycle datasets to lifetime degradation modeling violates test standards for accelerated battery qualification, invalidating warranty claims on degradation rate targets.

Is Real-Time Potential Alignment Feasible during Continuous Cycling?
Intermittent rest periods built into automated test schedules supply zero-current measurements without derailing overall aging protocols. Inserting a thirty-minute open-circuit rest every fifty cycles allows tracking of reference potential relaxation. As working electrodes relax toward equilibrium at zero current, matching these relaxation curves to baseline thermodynamic models enables real-time alignment.
Automated test scripts process relaxation data live, applying instantaneous offset adjustments to prevent drift accumulation over thousands of test hours.
Contractual testing agreements specify that any dataset exhibiting uncorrected reference electrode drift exceeding two millivolts per hundred hours triggers mandatory test pause and sensor recalibration.


Distortion
Uncorrected reference drift distorts individual electrode channels during long-term testing. Upward drift lowers measured anode potentials below their true thermodynamic values, creating false signs of high polarization. Conversely, downward drift conceals dangerous conditions where the negative electrode drops below zero volts versus Li/Li+.
Identifying the exact onset of metallic lithium plating on graphite anodes during fast charging requires potential resolution better than five millivolts.
Lithium Plating Boundary Misclassification
Anode overpotential tracking relies on sub-millivolt accuracy to pinpoint when negative electrode potential drops below zero volts versus Li/Li+. If reference potential drifts upward by twenty millivolts over five hundred cycles, an anode running at positive ten millivolts shows up as negative ten millivolts. Technicians reading this value will report premature lithium plating, halting fast-charge development based on false data.
- Spurious cathode overpotential spikes occur when downward reference drift falsely elevates recorded positive electrode potentials above upper cutoff thresholds, triggering false degradation alerts.
- Masked lithium deposition events take place when positive reference drift hides true negative anode potential excursions below zero volts, allowing destructive lithium dendrite growth to go undetected.
- Artificial impedance rise attribution arises when drift-induced voltage offsets distort electrochemical impedance spectroscopy arcs, leading engineers to assign full-cell resistance growth to the wrong electrode.
- Distorted side-reaction kinetic constants result from fitting Arrhenius aging equations to uncorrected potential datasets, generating inaccurate solid electrolyte interphase growth models.

Worked Lifetime Sensitivity in Nickel-Rich Formats
A thousand-hour cycle test on a high-capacity 21700 cell demonstrates how reference potential decay alters observed degradation pathways. Consider a fast-charge testing protocol operating a nickel-manganese-cobalt cell at two C rates at forty-five degrees Celsius.
| Cycle Milestone | Raw Anode Potential | Corrected Anode Potential | Accumulated Drift | Operational Diagnostic Conclusion |
|---|---|---|---|---|
| Cycle 1 | 12 mV vs Li/Li+ | 12 mV vs Li/Li+ | 0 mV | Normal intercalation kinetics confirmed |
| Cycle 250 | -8 mV vs Li/Li+ | 6 mV vs Li/Li+ | -14 mV | False lithium plating alarm triggered in raw data |
| Cycle 500 | -22 mV vs Li/Li+ | 8 mV vs Li/Li+ | -30 mV | Severe false plating error in uncorrected baseline |
| Cycle 750 | 5 mV vs Li/Li+ | -18 mV vs Li/Li+ | +23 mV | True active lithium plating masked by positive drift |
| Cycle 1000 | 18 mV vs Li/Li+ | -28 mV vs Li/Li+ | +46 mV | Critical lithium dendrite accumulation hidden |
The tabulated data illustrates how uncorrected reference drift completely reverses diagnostic conclusions during extended cycling. By cycle one thousand, positive drift masks a severe negative anode potential excursion, leaving active lithium plating completely unmonitored.
A positive reference potential shift masks early anode lithium plating during low-temperature fast charging.
Misinterpreting drift-induced potential offsets as true kinetic overpotentials leads to premature cell redesigns, adding tens of thousands of dollars in wasted prototype tooling costs.


Audit
Commercial battery procurement relies on accurate life-testing datasets to establish long-term cell warranties and warranty reserves. When cell manufacturers present three-electrode validation dossiers to prove fast-charge safety and degradation margins, buyers inspect the underlying reference electrode drift correction algorithms. Raw channel logs provide the necessary verification proof.
Verification of drift correction integrity requires full disclosure of raw voltage channel data, temperature profiles, and mathematical transform scripts. Binders containing only pre-processed half-cell curves fail technical due diligence standards.

Dossier Integrity and Raw Data Requirements
Technical qualification packages submit both uncorrected sensor outputs and mathematical adjustment files to demonstrate test transparency. Reviewers cross-check diagnostic rest cycles against reported differential voltage peaks to confirm that correction vectors reflect real physical reference shifts. Standardized qualification dossiers append full algorithmic source files, raw current logs, and calibration timestamps to ensure complete auditability.
Modified cells fail standard shipping qualification, as transport testing strictly demands unaltered production units.
Modified cells equipped with internal reference electrodes cannot serve as legal transport testing samples under dangerous goods regulations.

Regulatory Transport File Segregation
Dangerous goods certification guidelines dictate strict physical identity between tested cell lots and shipped production units. Section 38.3 of the UN Manual of Tests and Criteria requires compliance testing on unaltered, mass-production commercial cells. Inserting micro-reference wires alters cell mechanical structure, hermetic sealing, and internal short-circuit risk profiles, rendering three-electrode cells invalid for UN 38.3 certification.
Sourcing dossiers must separate electrochemical diagnostic datasets generated on modified three-electrode cells from formal safety certification dossiers generated on standard commercial cells. Technical files handed to compliance authorities carry test summaries from unmodified production lots to maintain transport compliance across international borders.
Whether standardized automated drift-correction software will achieve formal international consensus among standards bodies remains an open question for cell qualification practices.