Auditing Factory Quality Dossiers for Hidden Life Test Anomalies
Auditing raw battery cycling time-series exports reveals hidden test anomalies, temperature manipulations, and truncated statistical data in vendor dossiers.

Trace
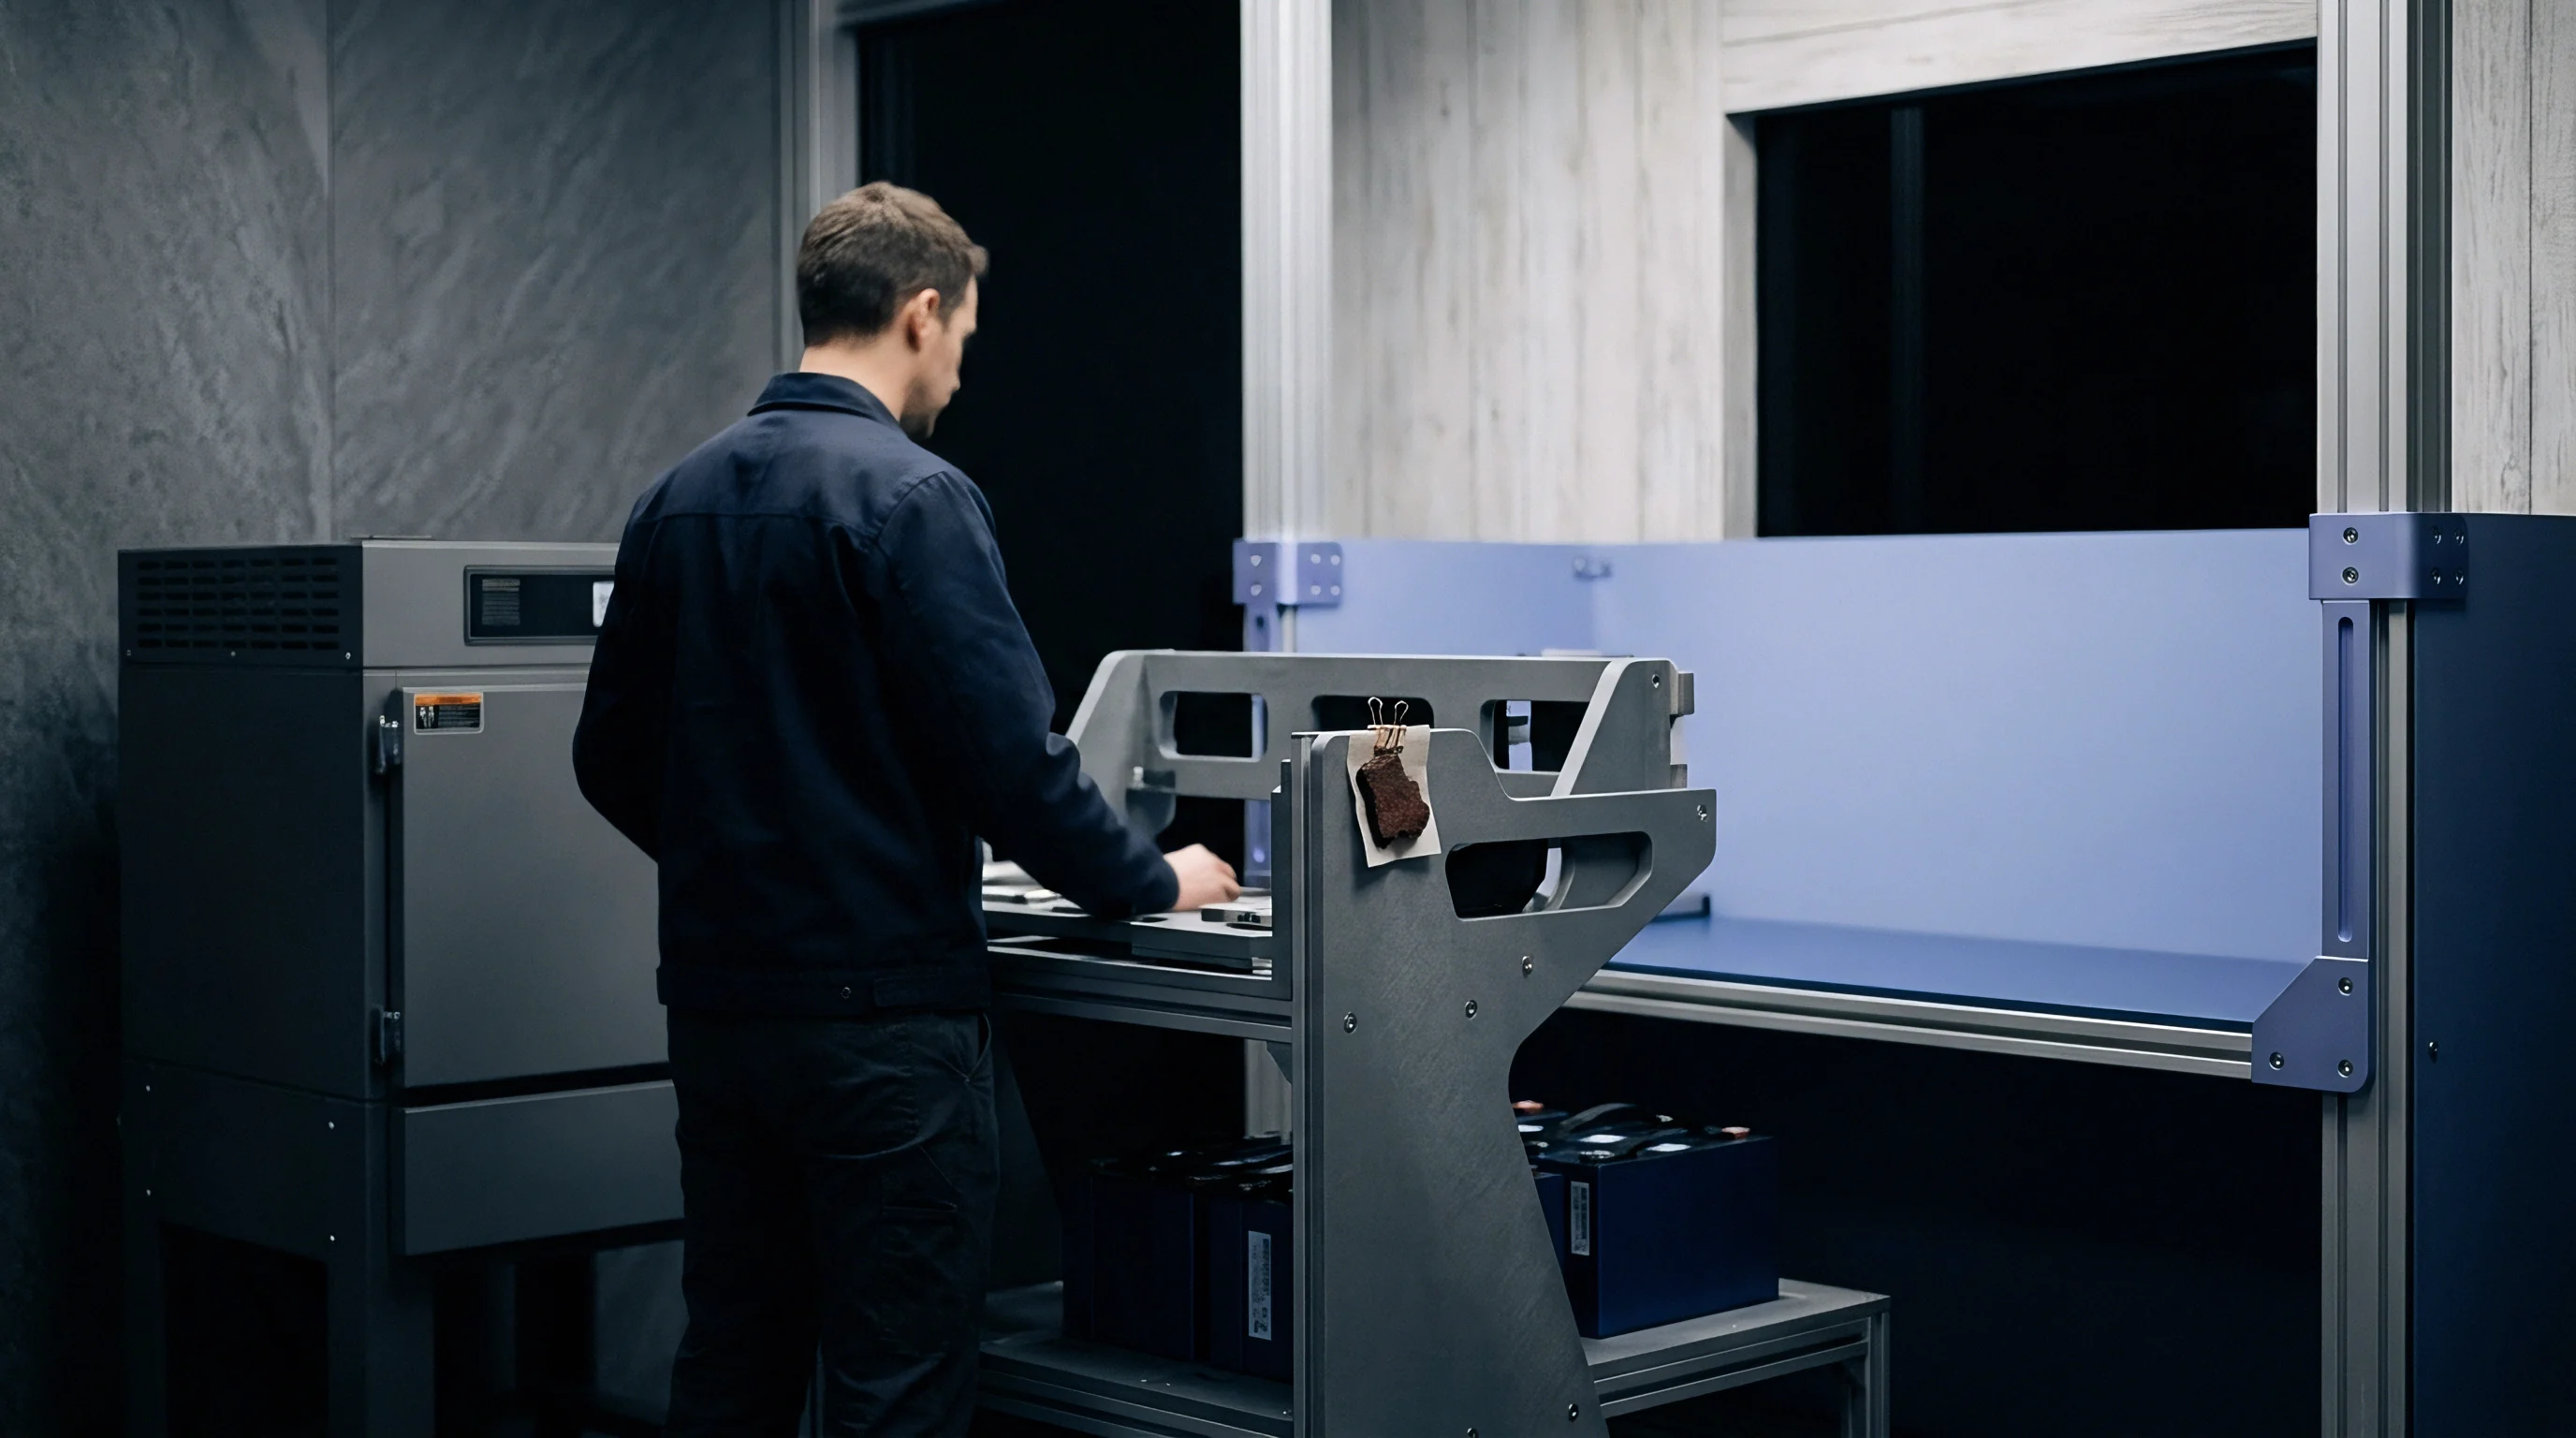
Factory qualification packages present raw battery cycler exports alongside high-level summary charts. Engineering teams reviewing cell documentation frequently discover that summarized cycling metrics obscure critical irregularities hidden within time-series records. Raw voltage, current, capacity, and temperature log lines recorded at one-hertz sampling rates carry the physical record of cell performance.
Summarized charts in standard quality dossiers smooth out these data points, masking temporary channel pauses, current adjustments, or manual rest insertions.

Raw Time-Series Data Integrity in Cycling Dossiers
Inspection of second-by-second galvanostatic cycling exports reveals systematic omissions in test records. Automated cycling channels generate vast text files containing millions of data rows over months of life testing. Cell vendors facing deadline pressures or tight capacity retention targets sometimes compress or filter these exports.
Filtering out data rows during high-stress regime changes, such as the transition from constant current to constant voltage charge, prevents buyers from detecting localized lithium plating or early gas generation events.
Discrepancies in timestamp continuity signal physical testing interruptions. When a cycler channel stops due to thermal alarms, grid power fluctuations, or channel board failures, the cell sits at open circuit voltage. This rest period allows electrolyte relaxation, gradient dissipation, and transient capacity recovery.
Upon restarting, the cell exhibits an artificial performance boost. A quality dossier that strips out timestamp gaps creates the impression of continuous, uninterrupted degradation, masking the fact that the cell received dozens of unrecorded rest periods that extended its apparent cycle life.
Discrepancies between cycling log timestamps and environmental chamber calibration records reveal unrecorded test interruptions.
Raw voltage steps disclose anomalies. Systematic audit of the voltage column in uncompressed CSV files reveals instances where upper cut-off thresholds were subtly expanded in late cycle stages. Raising the charge cut-off voltage from 4.20 volts to 4.22 volts adds nominal capacity back into the discharge step, offsetting real electrochemical degradation.
This manipulation maintains the retention curve above the standard eighty percent threshold for several hundred additional cycles. Direct analysis of raw step-by-step terminal voltages exposes these threshold adjustments immediately.

Filtering Artifacts and Automated Interpolation Signatures
Algorithmic curve smoothing routinely masks sudden voltage spikes caused by transient internal micro-short circuits. Micro-shorts occur when localized dendrites bridge separator pores before burning out through localized Joule heating. On an unfiltered channel log, a micro-short appears as a sharp single-second voltage drop during charge, followed by immediate recovery.
Software filters applied by testing facilities clean these artifacts under the guise of noise reduction. Deleting these transient points eliminates early warning signs of separator degradation and safety risks.
Fabricated or synthetic data streams leave mathematical footprints within time-series files. Genuine battery cycler hardware records internal measurement noise, drift in analog-to-digital converters, and tiny current ripples. Synthetic cycle data generated by script polynomial fits exhibits perfectly uniform standard deviations and smooth step transitions.
Calculating higher-order statistical moments across raw current and voltage columns identifies data streams generated by software algorithms rather than real physical test channels.
- Timestamp gap indicates paused cycling channels where cells rest unrecorded to recover voltage before resuming test steps.
- Voltage step variance signals adjusted cutoff thresholds intended to inflate apparent discharge capacity during late degradation stages.
- Coulombic ratio spike reveals unlogged lower-rate recharge sweeps designed to rebalance solid electrolyte interphase layers.
- Data point decimation hides transient micro-short voltage drops by reducing record logging frequencies from one hertz to millihertz levels.
Missing cycle intervals are frequently attributed to automated data compression scripts designed to conserve server storage space during extended multi-channel testing.


Decay
Electrochemical degradation leaves undeniable physical marks across capacity retention metrics during long-term cycling. Solid electrolyte interphase growth, active material loss, and transition metal dissolution proceed according to predictable kinetic laws. Quality dossiers displaying non-physical degradation trajectories warrant rigorous electrochemical auditing.
Cells cannot bypass fundamental thermodynamics; deviations from expected aging curves indicate manipulated testing conditions or selective reporting.

Differential Capacity Peak Shifts and Phase Degradation
Mathematical differentiation of charge and discharge curves converts voltage plateaus into distinct electrochemical peaks. Plotting dQ/dV against voltage transforms subtle plateaus into clear indicators of structural state-of-health. As active lithium ions trap inside the solid electrolyte interphase layer or cathode particles fracture, differential capacity peaks shift in potential and shrink in magnitude.
A genuine life test exhibits progressive peak broadening and voltage drift caused by impedance growth. Dossiers presenting perfectly stable dQ/dV peak positions alongside fifty percent capacity loss contain physical impossibilities.
Cathode phase transformations dictate voltage profiles in nickel-rich layered oxide chemistries. In high-nickel NMC materials, phase transitions at high states of charge induce crystal lattice strain, resulting in localized particle cracking and accelerated capacity drop-off. An authentic degradation curve for an NMC811 cell subjected to 1.0 C cycling demonstrates a two-stage decay slope: a linear phase driven by solid electrolyte interphase growth followed by a non-linear rollover corresponding to structural particle failure.
Quality dossiers showing purely linear degradation out to two thousand cycles at high C-rates have suppressed physical reality through adjusted cycling parameters.
Cycling NMC811 cylindrical cells at 45 degrees Celsius under 1.0 C charge rates accelerates capacity fading to 80 percent retention within 600 cycles when rest intervals drop below ten minutes.
Coulombic efficiency metrics expose micro-short circuits. Precise coulombic efficiency logging serves as the premier diagnostic tool for evaluating parasitic side reactions. During stable cycling, high-quality lithium-ion cells demonstrate coulombic efficiency values between 0.9995 and 0.9999.
Drops below this range indicate ongoing electrolyte consumption or active lithium isolation. Conversely, dossiers reporting coulombic efficiency values exceeding 1.0000 without explanation reveal cycler calibration drift or improper current integration algorithms.

Coulombic Efficiency Plateau Artifacts under Extended Cycling
Coulombic efficiency calculations compare discharged ampere-hours against charged ampere-hours for every individual cycle. Software filtering within cycler software can disguise real capacity loss and obscure true cycle-to-cycle efficiency variance. When vendor dossiers present coulombic efficiency as a flat line without high-frequency instrumentation noise, the underlying data has undergone mathematical manipulation.
Real chemical systems exhibit noise stemming from ambient laboratory temperature variations and sensor thermal drift.
| Measurement Metric | Genuine Cell Behavior | Dossier Anomaly Signature | Underlying Manipulation Method |
|---|---|---|---|
| Coulombic Efficiency | Progressive noise within 0.9992 to 0.9998 range | Flatline at exactly 1.0000 across 1,000 cycles | Software output clamping and current integration truncation |
| dQ/dV Peak Height | Monotonic decay with potential shift toward higher charge voltage | Constant peak position despite 20% total capacity fade | Synthetic curve interpolation from mathematical templates |
| Discharge Capacity Curve | Two-stage decay featuring linear loss followed by non-linear rollover | Strictly linear retention slope exceeding 2,500 cycles | Exclusion of failed test channels and artificial dataset trimming |
| Internal Resistance Growth | Parabolic or exponential increase over cumulative throughput | Step-down drops in resistance midway through testing | Unrecorded rest periods or chamber temperature increases |
Accepting flat coulombic efficiency datasets without raw voltage integration leads directly to field pack failures within twelve months of active deployment.

Thermal
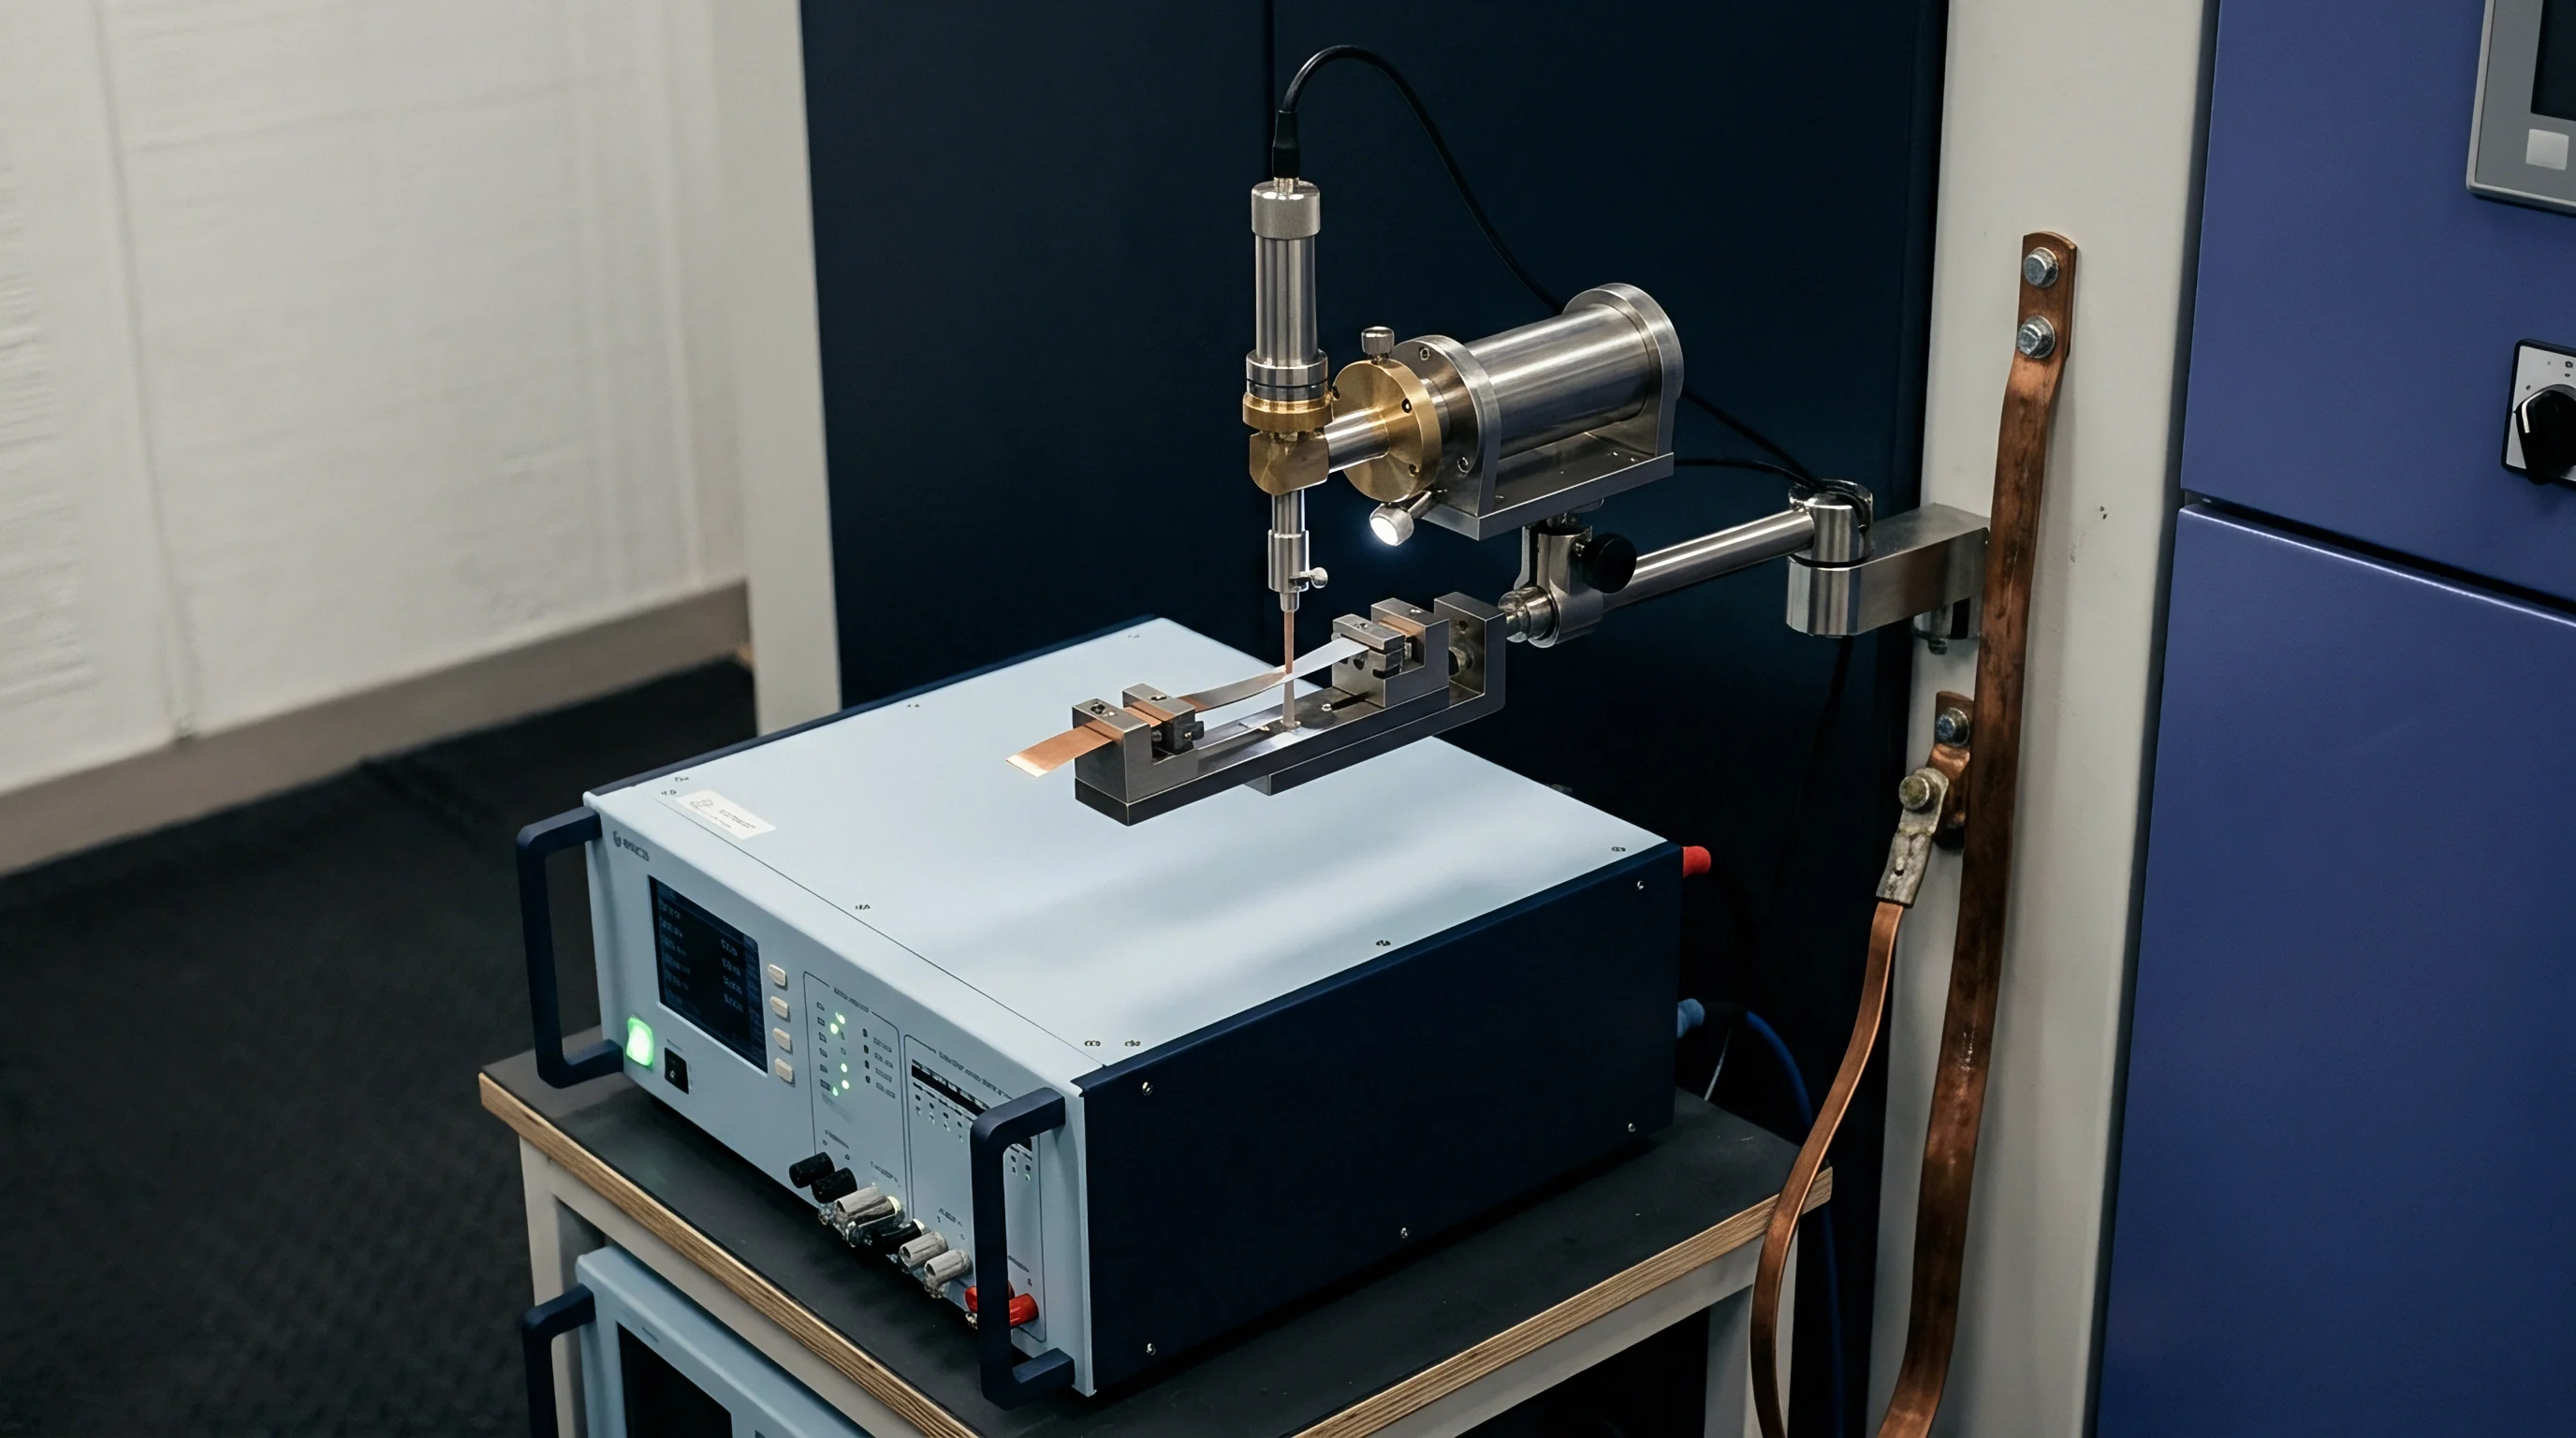
Ambient temperature stability during galvanostatic life testing governs the degradation kinetics of lithium-ion cells. Thermal chamber management directly controls solid electrolyte interphase formation rates, lithium ion diffusion constants, and electrolyte viscosity. Testing cells at elevated temperatures reduces internal impedance, artificially inflating round-trip energy efficiency and discharge capacity in high C-rate tests.
Conversely, under-reporting chamber temperatures masks high-stress thermal degradation. Quality dossiers must include continuous, independent thermal logging for every testing channel.
Environmental Chamber Temperature Drift and Rest Interruption
Chamber cooling failures introduce artificial capacity recovery steps in long-term cycling datasets. When environmental chambers fluctuate by three to five degrees Celsius due to compressor cycles or room air conditioning changes, cell surface temperatures shift accordingly. Higher temperatures temporarily boost ionic conductivity within the electrolyte, yielding an apparent recovery in discharge capacity.
An auditor cross-referencing facility environmental logs against cycler datasets can spot unrecorded temperature drifts that alter degradation slopes.
Resting intervals between charge and discharge steps dissipate internal heat accumulation and alter active particle stress. High-rate cycling without rest periods elevates core cell temperatures, triggering thermal degradation mechanisms. Vendors seeking to pass life tests under benign apparent conditions insert extended thirty-minute rest steps between charge and discharge cycles.
This rest step allows core temperature dissipation and concentration gradient relaxation, preventing the cell from experiencing the real thermal stress encountered in continuous duty-cycle applications.
A coulombic efficiency curve that remains perfectly flat across several hundred cycles usually indicates smoothed software output rather than physical measurement.

Sensor Placement Distortion across High Rate Test Channels
Thermocouple positioning directly dictates the measured skin surface reading during multi-C-rate discharge steps. Attaching temperature sensors to aluminum busbars or terminal tabs yields lower temperature readings than placing them at the central casing surface where internal heat generation peaks. Quality dossiers omitting sensor location schematics or thermal camera verification photos often obscure bad thermal sensor setups designed to under-report maximum operating temperatures.
Pack density inside environmental chambers impacts local airflow distribution. Packing hundreds of cells onto a single testing rack restricts air circulation, creating localized hotspots. Cells situated in stagnant air zones run hotter than cells near cooling ducts, experiencing accelerated aging that skews the test lot results.
Auditing thermal dossiers demands spatial mapping of cell channel placements within test chambers to verify uniform environmental conditions across all test units.
- Chamber thermal mapping matches external ambient sensor telemetry against individual cycler channel temperature logs.
- Fan duty cycle verification confirms continuous forced air circulation during high current discharge phases across all test racks.
- Sensor attachment audit verifies thermal couple adhesive integrity directly on central cell casing surfaces rather than fixtures.
- Rest interval timing validates that thermal stabilization durations between charge and discharge cycles remain uniform throughout testing.
Whether factory temperature sensors were deliberately shifted off cell caps or merely placed in dead airflow zones during high-rate discharge cycles remains an open question for line inspectors.


Sampling
Statistical reliability evaluations demand comprehensive failure distribution records across full manufacturing lots. Standard qualification processes require testing statistical samples under identical stress conditions until reaching defined end-of-life parameters. Factory dossiers that report cycling statistics for only a hand-picked subset of initial test channels introduce extreme survival bias into reliability calculations.
When Do Truncated Cycling Datasets Signal Early Cell Mortality?
Abrupt termination of channel logging at eight hundred cycles suggests intentional exclusion of late-stage accelerated capacity fade. In a thirty-cell qualification batch, individual units exhibit manufacturing variance in electrode coating thickness, tab welding integrity, and separator alignment. Cells with minor defects experience rapid capacity knee-points and early failure.
When vendor dossiers omit channels that dropped below eighty percent retention prematurely, the reported mean cycle life reflects only the best-performing units in the lot.
Truncating test duration before full population failure prevents accurate Weibull analysis. Estimating field warranty risks demands capturing early infant mortality modes alongside main wear-out mechanisms. Truncating life testing at a predetermined target cycle count without running cells to failure masks the onset of catastrophic failure modes like internal short circuits or lithium plating propagation.
Standard IEC 62660-1 section 7.2 dictates continuous logging of cell surface temperature during capacity tests, and missing thermal telemetry invalidates life test certification.

Weibull Slope Distortions from Drop out Censorship
Removing early failing cells from reliability calculation shifts the calculated shape parameter toward artificial uniformity. The Weibull shape parameter, beta, defines failure characteristics. A beta value below 1.0 indicates infant mortality caused by quality defects, while a beta between 2.0 and 4.0 signifies normal wear-out degradation.
Artificially removing early dropouts increases the calculated beta slope while shifting the characteristic life parameter, eta, to higher values. This manipulation makes a inconsistent cell population appear highly stable and mature.
- Extract raw cycle life endpoint counts for every individual test channel within the qualification lot.
- Sort lifetime cycle values in ascending order and rank each failure event numerically.
- Calculate Bernard median ranks for each test position to establish unreliability percentages.
- Plot log-log transformation of cycle numbers against median rank unreliability values.
- Fit linear regression to calculate the Weibull shape parameter beta and characteristic life eta.
| Dataset Condition | Sample Size (n) | Weibull Shape (Beta) | Characteristic Life (Eta) | Projected B10 Life |
|---|---|---|---|---|
| Uncensored Full Population | 30 | 1.85 | 1,420 cycles | 420 cycles |
| Censored Top 80% Retained | 24 | 3.42 | 1,680 cycles | 890 cycles |
| Censored Top 50% Retained | 15 | 5.10 | 1,850 cycles | 1,240 cycles |
| Data derived from qualification lots subjected to 1.0 C continuous cycling at 25 degrees Celsius to 80 percent capacity retention cutoff. | ||||
Truncated cycling datasets that exclude early channel dropouts always yield overly optimistic lifespan projections during commercial lot evaluation.


Audit
Procurement teams validate battery vendor documentation against underlying raw cycling records before authorizing mass production orders. Direct CSV exports prevent summary chart manipulation, while unverified test files elevate warranty risk. Transitioning from high-level dossier review to automated time-series data verification protects battery pack integrators from severe financial exposure.
Establishing systematic parsing scripts and mandatory data formatting standards ensures transparent quality verification across global supply chains.
Contractual Raw File Requirements and CSV Parsing Checks
Supply agreements require unedited cycler log exports delivered in standard comma-separated text formats alongside every batch shipment. Engineering specifications must incorporate strict data governance requirements. Demanding raw binary or plain text files directly from cycler brands eliminates the vendor’s ability to manipulate data in spreadsheet applications before delivery.
Automated verification scripts execute integrity algorithms across raw time-series files. These scripts scan time columns for non-monotonic step increments, detect dropped channel rows, and cross-reference instantaneous current measurements against integrated total discharge capacity. Identifying discrepancies between cycler step timers and integrated charge values surfaces software tampering instantly.
Automated parsing enables comprehensive checks of massive testing datasets that manual sampling could never achieve.

Commercial Risk Exposure from Unverified Qualification Dossiers
Unqualified lithium-ion cells entering commercial field deployment introduce severe financial liabilities through early warranty replacements. Field pack replacements consume profit margins rapidly, while safety failures damage brand reputation irreversibly. Auditing raw factory dossiers functions as a fundamental risk management filter.
Identifying hidden life test anomalies during early vendor qualification prevents costly capital commitments to substandard battery chemistries.
Rigorous dossier auditing enforces accountability on cell manufacturers. When vendors realize buyers possess the analytical capabilities to detect raw time-series manipulation, statistical truncation, and thermal test cheating, quality transparency improves across production lots. Sourcing teams gain crucial leverage during price and warranty negotiations by anchoring discussions in verified electrochemical reality.
Standard procurement addendums requiring uncompressed raw binary log files shift the legal burden of proof onto the cell manufacturer in premature capacity loss litigation.