Quantifying Micro Reference Electrode Impedance Artifacts in High Rate Lithium Metal Fast Charging Metrology
Micro reference electrodes distort local current flux and add high frequency phase shifts requiring offset correction and baseline decoupling for valid fast charge metrology.
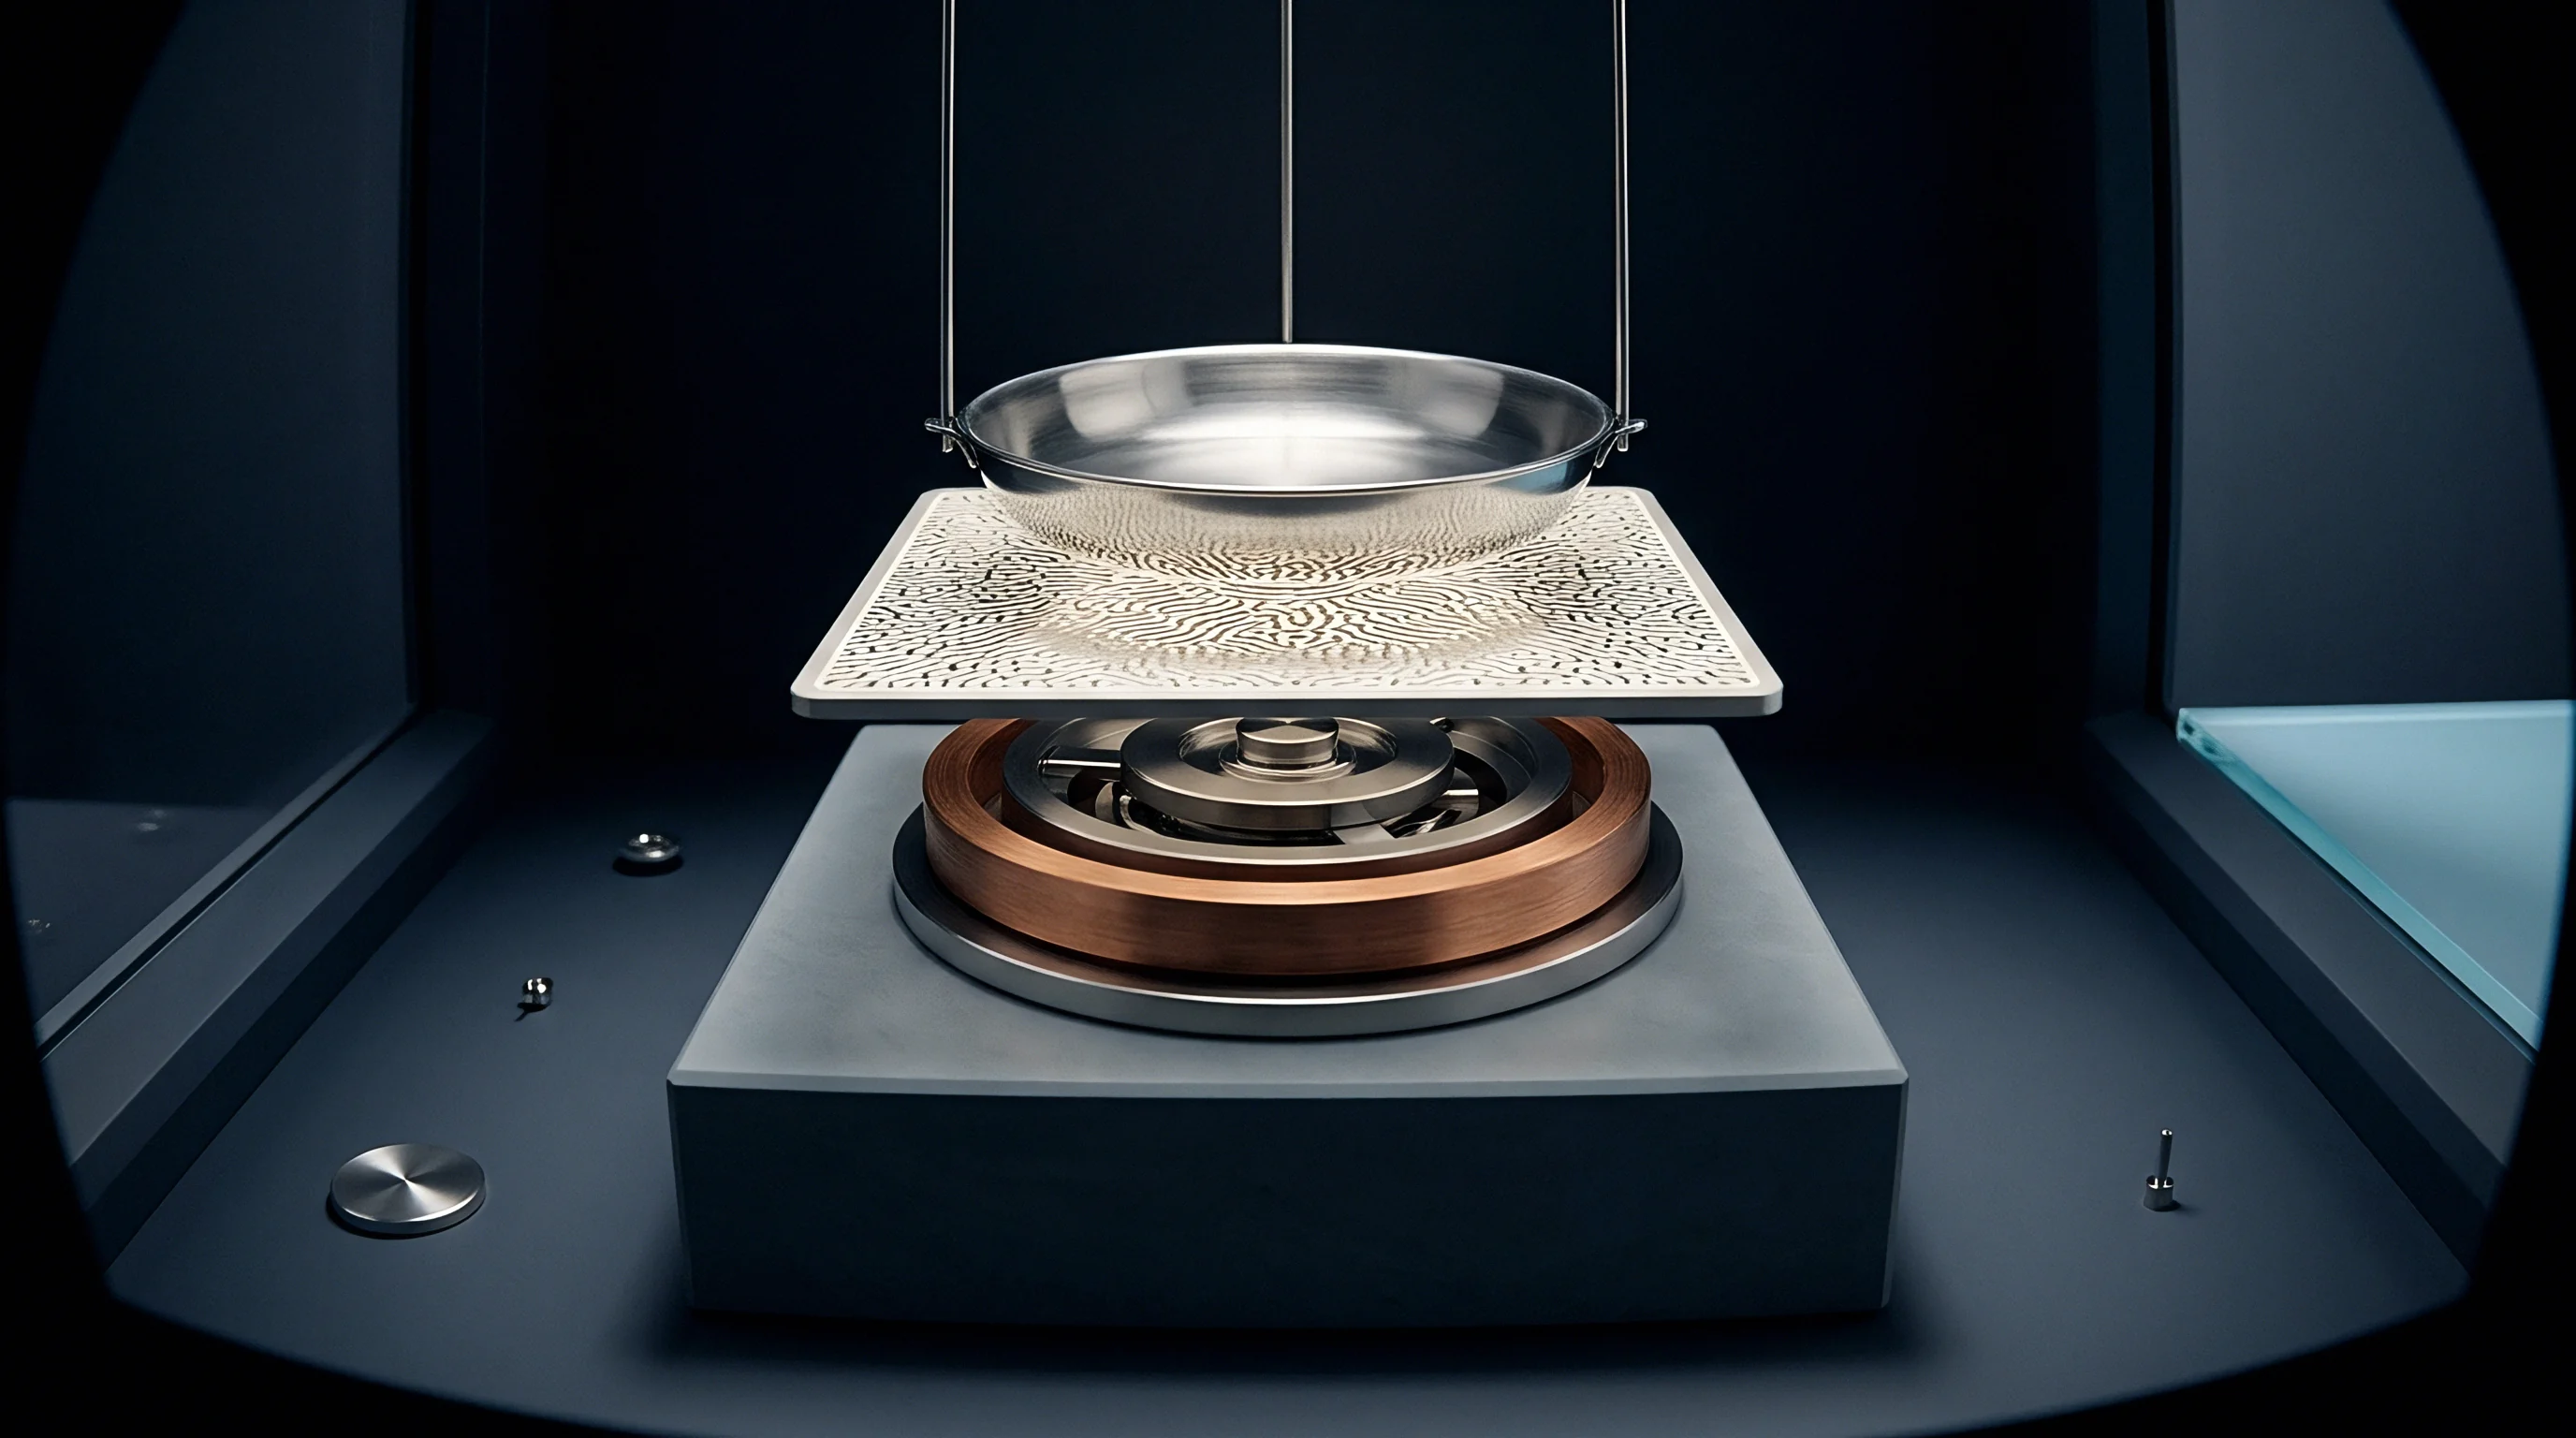

Wire
Placing a micro reference electrode into a lithium metal cell distorts the electric field between the working and counter electrodes. Fast charging at flux densities above 4 mA/cm² requires current lines to strike the planar lithium interface orthogonally if deposition is to stay uniform. When a physical probe ~ such as a 25-micrometer lithium-coated copper or gold wire ~ is embedded in the separator, it behaves as an ionic insulator.
Current lines bend around the wire, concentrating flux at the adjacent working electrode while leaving a shadowed zone directly beneath the wire footprint.
That disturbance creates an immediate geometric artifact: rather than sampling the unperturbed equipotential plane at that position, the probe averages the distorted field across its exposed surface. During high-rate charging, the uncompensated ohmic drop between the probe tip and the anode interface introduces substantial measurement error.
Much of this distortion comes down to probe placement.
Setting the reference wire closer to the lithium anode cuts the electrolyte resistance included in the measurement, but bringing it nearer the separator interface pinches current lines and compresses the polymer membrane. That mechanical compression squeezes out pore volume, depressing ionic conductivity and steepening the local potential gradient. The resulting error in anode potential scales directly with both current density and probe offset distance.
| Wire Diameter (µm) | Contact Resistance (kΩ) | Geometric Field Distortion (%) | Uncompensated IR Drop (mV) | Plating Detection Delay (s) |
|---|---|---|---|---|
| 10 | 125.0 | 1.8 | 8.4 | 0.12 |
| 25 | 48.0 | 4.2 | 19.6 | 0.35 |
| 50 | 22.5 | 9.6 | 42.0 | 0.88 |
| 100 | 10.2 | 21.5 | 91.5 | 2.10 |
Insulated micro-wires with exposed active tips present complicated boundary conditions of their own. If the bare tip is longer than the separator is thick, the probe spans several equipotential lines across the gap, turning the sensed signal into a weighted spatial average rather than a local point reading. In fast-charge testing, that spatial averaging rounds off the sharp negative overpotential transients that mark the onset of lithium dendrites.
A 50-micrometer lithium wire inserted between separator membranes shifts measured anode overpotential by 42 millivolts at a charge flux of 6 milliamperes per square centimeter.
Embedding physical reference probes introduces several operational failure modes during ultra-fast charging:
- Separator puncture defect occurs when mechanical load pushes the wire tip through a thin polyolefin separator, creating a soft short that bleeds the reference potential during high-rate pulses.
- Local current focusing arises from the dielectric mismatch between the metal core and the surrounding electrolyte, raising local flux by up to 30 percent along the wire boundary.
- Mechanical stress concentration indents the soft lithium surface beneath the probe, accelerating dendrite nucleation under clamped cell pressure.
- Asymmetric flux shadow leaves an underutilized footprint on the cathode directly opposite the probe, skewing state-of-charge balance across the active area.
Resolving these distortions requires finite element simulation of the primary and secondary current distributions around the wire. Without correction factors from spatial modeling, recorded anode potential traces consistently understate the actual thermodynamic driving force for plating during fast-charge pulses.
Overlooking the field disruption caused by the wire yields skewed overpotential data, which tends to trigger early charge cutoffs and inflate apparent degradation rates.

Electrolyte Concentration Polarization and Local Transients
Salt concentration gradients build quickly across the cell at high current densities. Charging a lithium metal cell at 6 mA/cm² strips cations from the cathode while accumulating them at the anode, setting up steep concentration polarization. The resulting profile through the separator follows Nernst-Planck transport, generating a liquid junction potential across the inter-electrode gap.
A micro reference electrode tracks the local electrochemical potential of lithium ions wherever it sits in that evolving gradient. As salt concentration shifts during fast current steps, the local lithium-ion activity around the probe drifts with it. That activity change moves the reference baseline independently of whatever charge-transfer chemistry is taking place at the working electrode.
Ohmic losses shift alongside the concentration profile.
This baseline drift accumulates over repeated cycling. Calculating the actual concentration polarization means tracking transport parameters ~ the cation transference number, the salt diffusion coefficient, and electrolyte activity coefficients. In common carbonate electrolytes with 1.0 M LiPF6, the lithium-ion concentration beneath a wire sitting 10 micrometers from the anode can fall below 0.2 M within 120 seconds at a 5C charge rate.
Depletion on that scale shifts the reference potential by tens of millivolts under Nernstian behavior. Without compensation for this drift, the recorded anode potential reads artificially positive against a true chemical standard, suggesting a safe operating margin even after the anode has slipped below 0 V versus Li/Li+ and begun growing dendrites.
Reference potential drift accelerates whenever electrolyte salt depletion exceeds the diffusion limit of the porous separator matrix.

Chemical Incompetence of Active Reference Materials
Finding chemically stable probe materials for lithium metal cells remains difficult. Pure lithium wire provides an unambiguous thermodynamic reference, but it reacts continuously with liquid electrolyte. The resulting solid electrolyte interphase on the probe surface steadily alters its interfacial charge-transfer resistance over time.
Alternative reference chemistries each introduce distinct trade-offs under fast charge:
- Lithium-aluminum alloy forms stable multi-phase plateaus near 0.35 V versus Li/Li+ and reacts more slowly with carbonate solvents, but volume changes across phase transitions disrupt mechanical contact with the separator.
- Gold-lithium alloy forms readily by lithiating gold wire in situ to give reproducible potentials, yet ongoing lithium diffusion into the core causes continuous baseline drift over extended cycling.
- Lithium iron phosphate coated micro-wires deliver a flat two-phase response at 3.42 V versus Li/Li+, but high internal electronic and ionic resistances damp their response to transients above 10 mA/cm².
- Li4Ti5O12 coated titanium wire offers zero-strain stability at 1.55 V versus Li/Li+, though the thicker coating adds to probe diameter and worsens geometric flux distortion.
Degradation of the reference material shows up as baseline hysteresis across charge-discharge cycles. As parasitic reactions consume the active lithium reserve on the wire, the reference potential drifts erratically, making it easy to misjudge when the anode reaches its polarization threshold.
Cell builders often blame baseline drift on bulk electrolyte breakdown instead of recognizing the local salt depletion developing right at the wire tip.

Coupling

Can High Frequency Phase Angle Shift Mask Lithium Plating?
Potentiostat sense leads add stray capacitance to high-impedance measurement paths. Because micro reference electrodes have tiny active surface areas ~ typically between 10^-5 and 10^-3 cm² ~ their interfacial impedance is inherently high. Pairing a reference wire that has a 50 kΩ interfacial resistance with 100 pF of cable and input capacitance places an unintentional RC low-pass filter straight into the sensing loop.
That stray filtering distorts the measured signal.
At high frequencies in electrochemical impedance spectroscopy (EIS), this RC filter introduces pronounced phase lag. During three-electrode measurements under fast charging, that lag skews the high-frequency intercept and the working electrode’s charge-transfer arc, showing up on Nyquist plots as an artificial inductive loop or a depressed semicircular arc.
| Applied Frequency (kHz) | True Interfacial Phase (deg) | Measured Signal Phase (deg) | Phase Angle Error (deg) | Artifact Classification |
|---|---|---|---|---|
| 0.1 | -2.1 | -2.3 | -0.2 | Negligible phase delay |
| 1.0 | -12.4 | -15.8 | -3.4 | Minor capacitive distortion |
| 10.0 | -35.6 | -58.2 | -22.6 | Severe RC phase shift |
| 50.0 | -18.2 | -84.5 | -66.3 | Inverted phase artifact |
| 100.0 | -5.4 | -112.0 | -106.6 | False inductive loop generation |
Above 1 kHz, high-impedance probes distort the spectrum noticeably. When characterizing a lithium anode during 4C fast charging, genuine charge-transfer resistance often falls below 1 Ω·cm². Under those conditions, even slight capacitive coupling through the reference probe can swamp the real electrochemical response.
Subclause 4.2 of standard testing guidelines rejects electrochemical impedance spectrum data showing phase angle inversions above ten kilohertz.
A brief calculation shows how quickly this distortion builds. Take a 25-micrometer reference wire in a pouch cell with an input resistance R_ref of 45 kΩ, driven by its small contact area and surface SEI layer. Hook that probe to a potentiostat through a 1.5-meter coaxial cable carrying 120 pF of stray capacitance C_stray.
The cutoff frequency f_c of the resulting filter evaluates to:
f_c = 1 / (2 pi R_ref C_stray) = 1 / (2 3.14159 45000 120e-12) = 29.47 kHz
At an EIS frequency f of 10 kHz, the phase error phi_error contributed purely by the cabling is:
phi_error = -arctan(f / f_c) = -arctan(10000 / 29470) = -18.7 degrees
By 50 kHz ~ a routine frequency for tracking ohmic electrolyte resistance during pulse charging ~ the phase error reaches:
phi_error = -arctan(50000 / 29470) = -59.5 degrees
A phase error of that magnitude leads the instrumentation to fold real ohmic resistance into the capacitive charge-transfer arc, overstating the anode’s charge-transfer resistance by more than 300 percent. Test channels then log phantom impedance growth and throttle charge rates on cells that could safely take higher current flux.
Whether deconvolution algorithms can cleanly separate real high-frequency plating kinetics from instrument-induced phase lag across changing C-rates is still unresolved.


Calibration

Symmetric Cell Validation Baselines
Isolating probe artifacts from actual electrode kinetics requires a reliable baseline, which symmetric architectures provide. Placing the reference wire at the geometric midpoint of a lithium-lithium or cathode-cathode cell eliminates thermodynamic asymmetry between the working electrodes.
In a balanced Li-Li symmetric cell at low current flux, the potential measured between the probe and either electrode should sit at exactly half the cell voltage. Any deviation from that 50 percent mark directly reflects geometric offset, uncompensated resistance differences, or localized concentration gradients.
Small misalignments compound rapidly under load.
Systematic calibration isolates these effects.
A structured calibration routine isolates physical probe artifacts from real cell kinetics:
- Assemble a symmetric Li-Li cell with the reference wire centered in the chosen separator under 0.5 MPa of mechanical stack pressure.
- Apply an initial 0.1 mA/cm² pulse for 10 seconds to record the ohmic baseline before concentration gradients develop.
- Measure the steady-state offset between working electrode 1 and the probe to determine the geometric displacement factor d_offset.
- Run a zero-bias EIS sweep from 100 kHz down to 10 Hz to extract sensing-path capacitance C_stray and probe impedance R_ref.
- Step current density from 1 mA/cm² to 10 mA/cm² in 1 mA/cm² increments, recording the voltage transient at each stage.
- Extract the concentration polarization profile by subtracting the ohmic drop from each potential transient.
- Engage active cable shielding and tune potentiostat feedback compensation until the phase error at 10 kHz drops below 1 degree.
Driven shielding cuts capacitive pickup substantially during high-rate pulses. Placing an active guard around the signal core ~ driven at the wire’s exact potential ~ removes the voltage differential across the inner dielectric. This suppresses effective stray capacitance by over two orders of magnitude, pushing the instrumentation cutoff well past the EIS measurement band.
Four-point sensing eliminates cable contact impedance while leaving the internal micro-wire charge transfer resistance uncorrected.

Four Probe Differential Measurement Protocols
Wiring micro reference electrodes into fast-charge fixtures requires true four-probe sensing. Conventional three-electrode setups route current through the working and counter electrodes while sensing between working and reference leads, but characterizing the probe’s own impedance under high rates requires splitting current-delivery and voltage-sensing leads directly at the micro-wire.
The sensing channels demand differential amplifiers with input impedances above 10^12 Ω to avoid drawing current through the wire and polarizing its surface. If input bias current creeps past 10 pA, continuous redox reactions will drift the reference baseline over extended cycling.
Clause 6.3 of the fast-charge qualification standard requires differential four-point correction before anode potential traces can be submitted for thermal safety compliance.


Ledger

Fast Charging Protocol Validation Risk
Faulty reference metrology creates substantial financial exposure during cell development and supplier qualification. Fast-charge protocols are tuned to operate right at the edge of lithium plating; an uncorrected +25 mV bias in the measured anode potential will cause test engineers to push charging currents well past safe electrochemical limits.
Overstating charge capability shows up later as field failure. Cells screened under flawed test protocols often clear early short-term audits, then develop rapid capacity loss, micro-shorts, and thermal failures once built into production packs. Warranty claims and pack replacements quickly dwarf what proper calibration would have cost up front.
| Artifact Magnitude (mV) | Inferred Fast-Charge Capability | True Anode Potential (V vs Li/Li+) | Overpotential Miscalculation (%) | Financial Risk Exposure |
|---|---|---|---|---|
| +5.0 | 4C (15 min charge) | +0.012 | 8.5 | Baseline warranty coverage |
| +15.0 | 5C (12 min charge) | -0.003 (Mild Plating) | 24.0 | Moderate recall exposure |
| +30.0 | 6C (10 min charge) | -0.018 (Severe Plating) | 52.0 | High field failure risk |
| +50.0 | 8C (7.5 min charge) | -0.035 (Dendrite Spikes) | 95.0 | Catastrophic thermal liability |
Uncalibrated measurements undermine qualification data. When procurement tenders specify 10-minute charging to 80 percent state of charge, suppliers typically submit three-electrode test reports to prove compliance. Without independent verification of probe impedance and geometric artifacts, buyers end up accepting overstated performance figures that break down in vehicle validation.
Writing calibration requirements into cell sourcing contracts protects procurement budgets. Sourcing audits need to examine raw high-frequency phase curves, probe geometries, and symmetric cell baselines before approving fast-charge claims, ensuring that reported operating windows reflect real interfacial stability rather than instrumentation artifacts.
Test setups that rely on uncalibrated reference probes consistently understate the risk of lithium plating under fast-charging conditions.