LFP Cell Aging Mechanics under Low Rate Galvanostatic Testing
Low-rate galvanostatic testing isolates lithium loss from material degradation, providing true chemical health metrics that standard factory checks mask.

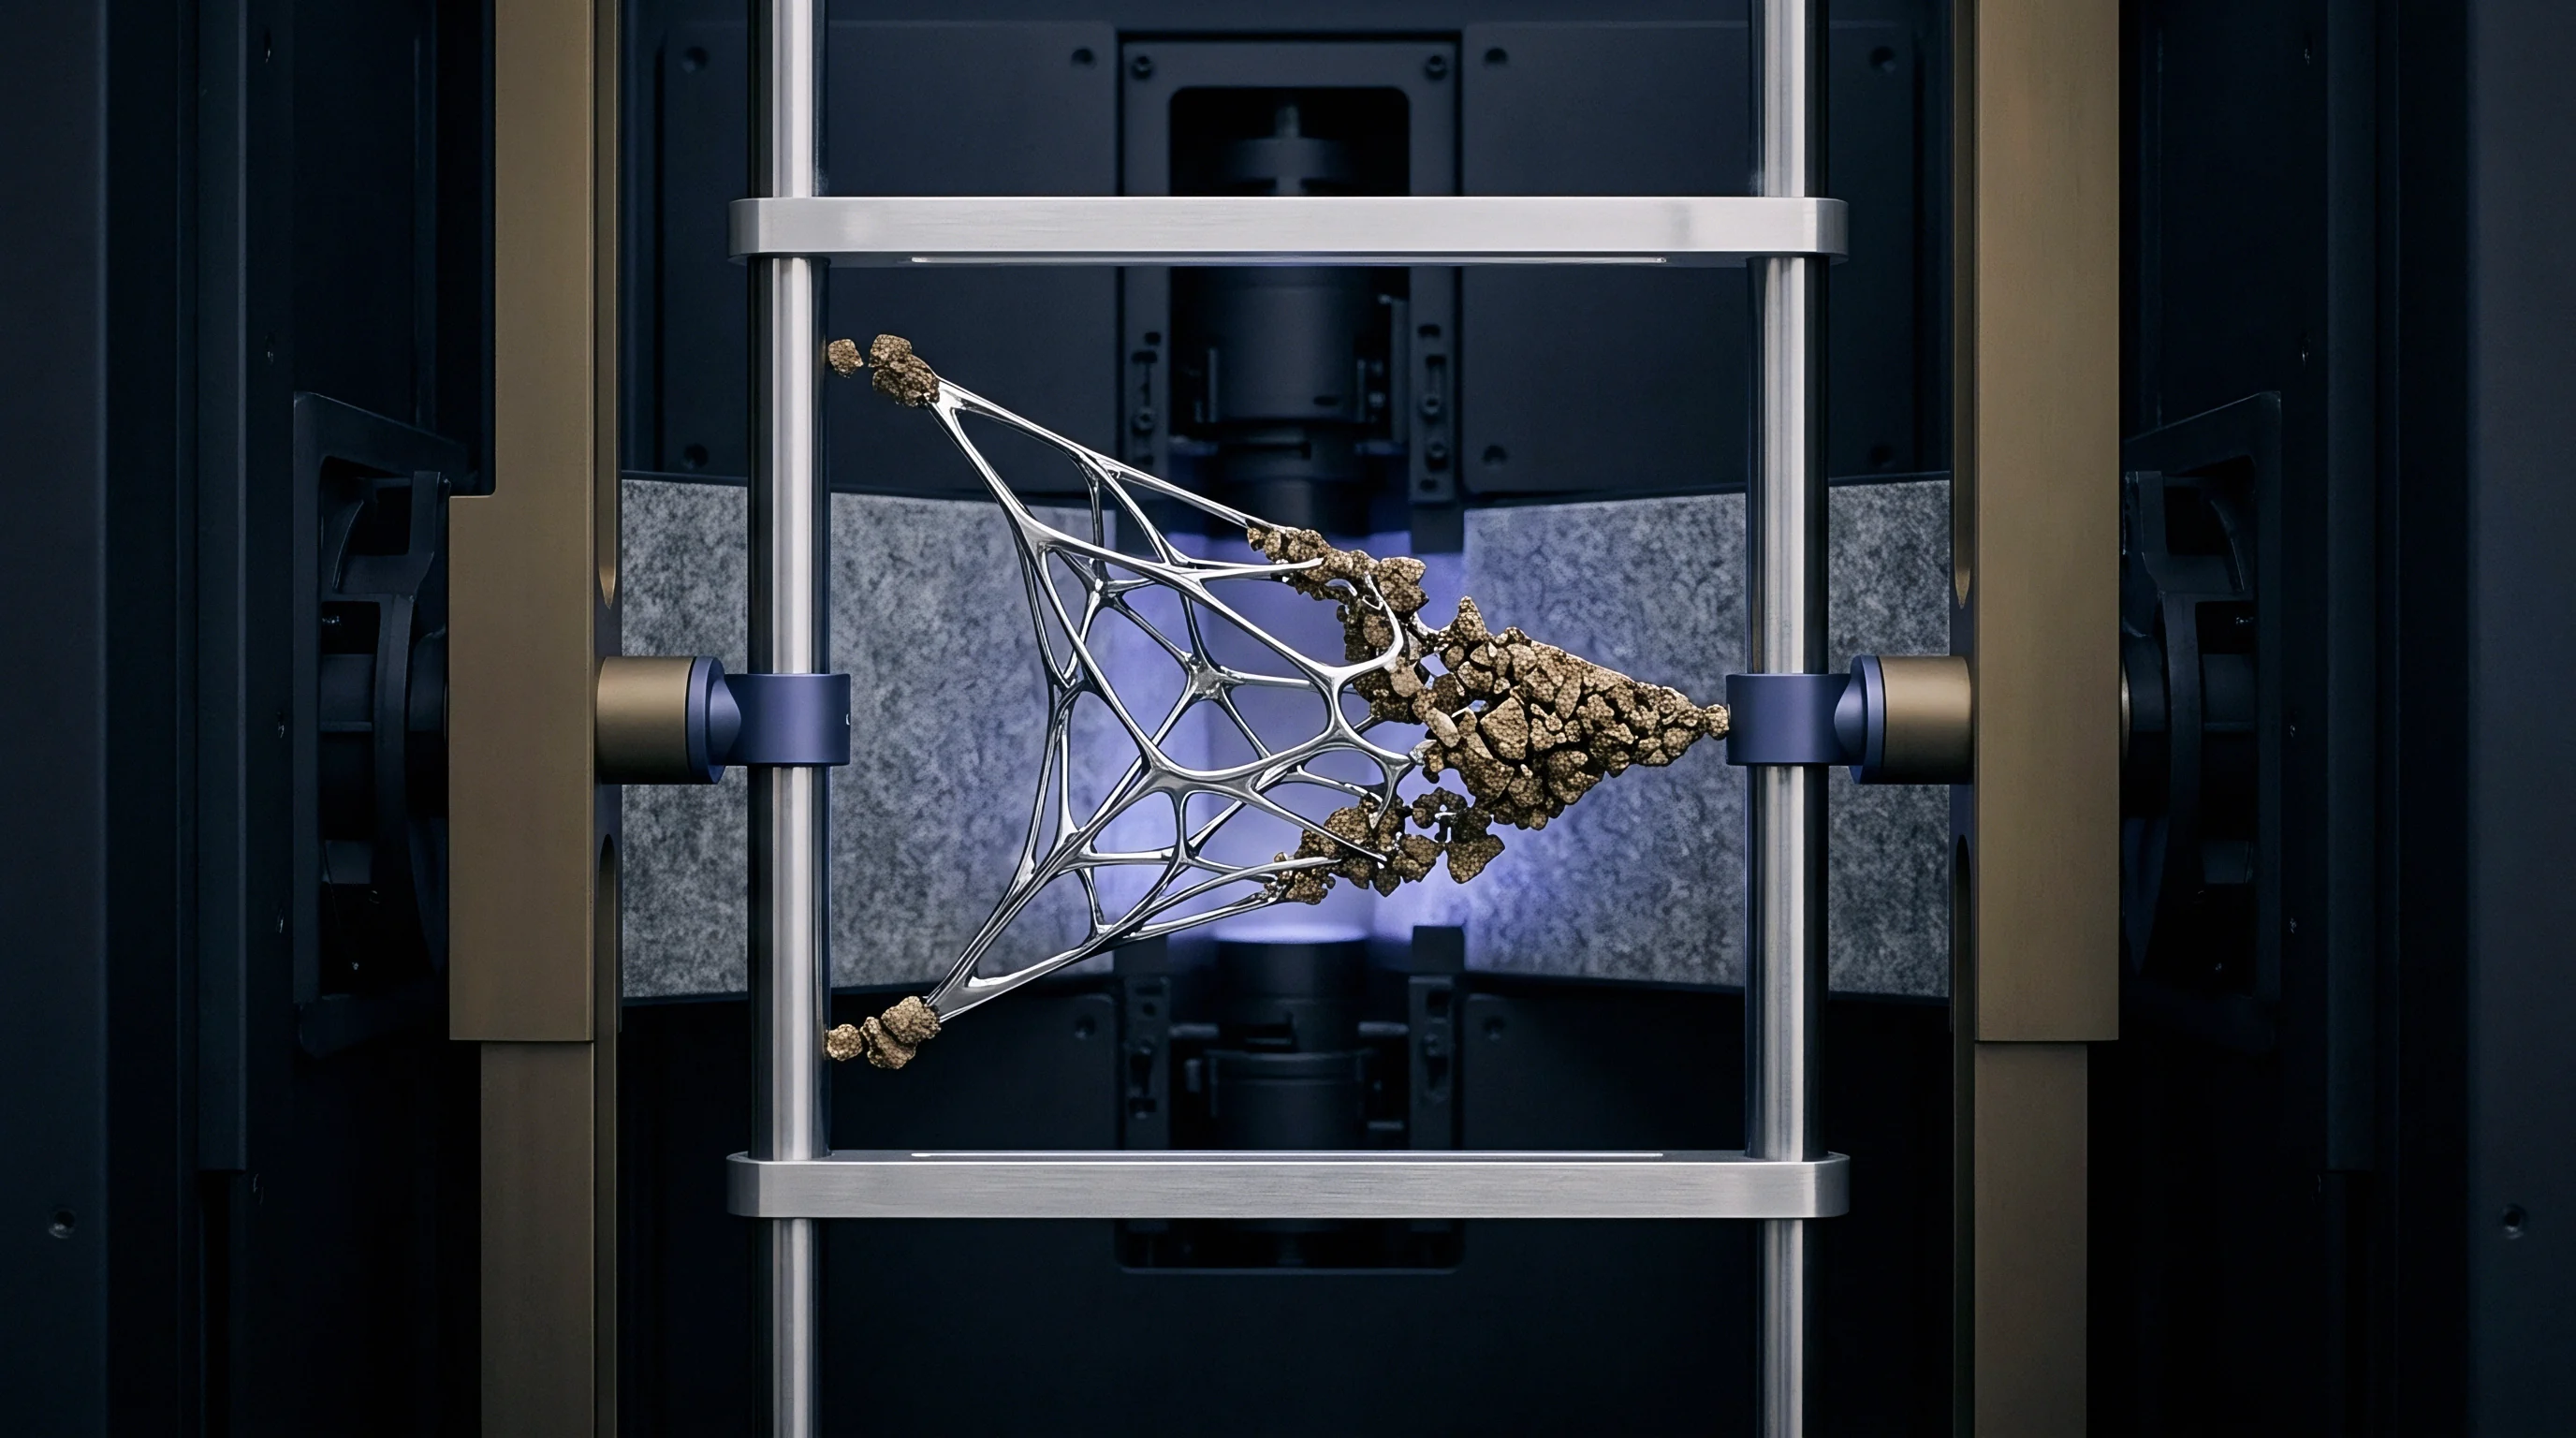
Decomposition
Galvanostatic testing between C/20 and C/100 strips ohmic drops and kinetic overpotentials from cell measurements. Operating near zero current isolates thermodynamic behavior, exposing phase transitions that standard 1C cycling masks behind heat and internal resistance. While high-rate testing hides microstructural changes inside the iron phosphate matrix under localized overpotentials, low-rate characterization lets the electrode system reach quasi-equilibrium at every state of charge.
The resulting voltage curve serves as a high-resolution map of phase behavior and active lithium availability.
Aging in lithium iron phosphate cells involves several degradation modes happening at once: phase separation in the positive electrode occurs alongside graphite intercalation steps in the negative electrode. Standard capacity checks measure total extracted charge, bundling every loss mechanism into one number. Differential capacity analysis breaks the flat galvanostatic plateau into detailed redox peaks, separating loss of active positive material from loss of active negative material and loss of lithium inventory.
Operating at low currents ensures that peak positions reflect chemical potential rather than transport limitations inside the electrolyte pores.
Loss of active lithium inventory dominates early aging in lithium iron phosphate cells. Side reactions at the graphite interface consume cyclable lithium ions during solid electrolyte interphase formation and repair. Even while the raw voltage curve stays flat, peak locations in differential capacity space shift relative to the state-of-charge axis as available lithium shrinks.
Tracking the distance between positive and negative phase transition features reveals the precise rate of lithium trapping inside the anode film. Low-rate testing isolates this shift because kinetic sluggishness no longer blurs the transition edges.
C/50 galvanostatic assays at 25°C capture differential capacity peak shifts of less than 2 millivolts, isolating lithium inventory loss from active mass degradation.
Active material loss follows different kinetic pathways at each electrode. Structural damage in the positive electrode stems from lattice strain during phase changes between triphylite and heterosite phases. Microcracking at grain boundaries isolates active primary particles, cutting the capacity available for lithium insertion.
On the negative electrode, degradation involves graphite exfoliation, particle cracking, and site blocking by decomposed electrolyte products. Low-rate galvanostatic curves track these losses independently by measuring peak areas across specific voltage intervals.
Differential voltage analysis provides complementary clarity by plotting the rate of voltage change against delivered capacity. Inflection points in differential voltage curves identify phase boundaries within the graphite host matrix, specifically transitions between stage one, stage two, and higher-order intercalation compounds. As the negative electrode loses active site capacity, graphite phase transitions occur over smaller absolute capacity windows.
Comparing low-rate differential capacity profiles against differential voltage plots separates structural particle damage from electronic isolation caused by collector corrosion or tab degradation.
Lithium loss drives early capacity fade. Low-rate galvanostatic testing works well here because it is sensitive to internal stoichiometric offsets. When lithium ions are permanently trapped in side-reaction products, the operating alignment between positive and negative electrodes shifts.
The positive electrode operates over an incomplete stoichiometric window, remaining partially lithiated at full cell charge. Low-rate characterization quantifies this thermodynamic shift without interference from concentration gradients across the porous electrode thickness.
Low-rate galvanostatic assays highlight specific failure features across cell life:
- Anode Lithium Trapping reduces cyclable charge while preserving the structural intercalation host capacity of both synthetic and natural graphite matrices.
- Cathode Phase Isolation detaches primary lithium iron phosphate particles from the conductive carbon mesh through microcracking along the crystal boundary.
- Electrolyte Decomposition Products deposit inside negative electrode pore networks, increasing localized diffusion resistance during extended trickle holds.
- Collector Interface Degradation increases contact resistance between the current collector foil and the active material coating, shifting voltage endpoints during low C-rate sweeps.
Decomposing galvanostatic data quantitatively requires baseline matching against fresh cell characteristics. Fresh cells show uniform peak separation and clear phase boundaries on both charge and discharge sweeps. Aging compresses peak heights and broadens full-width at half-maximum values.
Low-rate data collection captures subtle shoulder features that signal localized phase imbalances across heterogeneous electrode coatings, giving an early diagnostic signature long before standard 1C discharge tests report capacity drop-off.
Thermodynamic models rely on these isolated curves to fit half-cell open-circuit voltage profiles to full-cell measurements. Combining a pristine positive electrode reference curve with an aged negative electrode reference curve reproduces the low-rate cell voltage response with high fidelity. The fitting procedure calculates the precise capacity alignment offset, outputting explicit mass loss figures for each component.
In this way, low-rate testing bridges internal electrochemical health and benchtop measurement non-destructively.
The mechanical stability of the iron phosphate lattice under slow lithiation regimes introduces an analytical choice for long-term monitoring: whether low-rate galvanostatic holds induce self-healing effects in stress-damaged graphite particles remains an open question for lifetime modeling.

Iron
Lattice strain in lithium iron phosphate materials comes from the structural mismatch between lithiated and de-lithiated phases. The transition between triphylite (LiFePO4) and heterosite (FePO4) proceeds via a two-phase reaction with an extremely flat open-circuit voltage plateau at 3.42 volts against a pure lithium reference. During rapid discharge, phase boundaries move under severe non-equilibrium conditions, concentrating mechanical stress within individual crystallites.
Low-rate galvanostatic testing minimizes kinetic overpotential, allowing phase transformation fronts to advance smoothly across particle domains.
Near-equilibrium cycling exposes particle-level degradation mechanics that high C-rates mask under thermal expansion. Iron dissolution into the organic carbonate electrolyte represents a persistent chemical decay pathway in iron phosphate systems. Trace acid species, generated when moisture reacts with fluorine-bearing salts to form hydrofluoric acid, attack the positive electrode framework.
Dissolved iron cations migrate through the separator membrane toward the negative electrode, reducing into metallic iron clusters on the graphite surface.
Metallic iron deposits on the negative electrode act as localized catalytic sites for secondary electrolyte breakdown. The solid electrolyte interphase layer, designed to passivate the graphite surface, experiences mechanical disruption from growing iron deposits. Low-rate holds extend the time spent at elevated states of charge, accelerating trace metal dissolution and subsequent deposition dynamics.
Operating at C/50 rates provides the low ionic flux environment required to measure the true rate of parasitic side reactions occurring at the graphite-electrolyte interface.
Phase transition kinetics under near-equilibrium conditions depend directly on particle size distribution and conductive coating uniformity. Carbon coating defects expose raw iron phosphate surfaces to direct electrolyte contact, promoting localized acid attack and iron leaching. Low-rate galvanostatic testing reveals these coating imperfections through micro-step variations in the voltage profile that standard testing sweeps through too quickly for voltage sensors to resolve.
Continuous exposure to low-rate galvanostatic holds at upper voltage limits accelerates iron dissolution and degrades anode film stability faster than equivalent dynamic cycling.
Graphite staging transitions reflect the structural response of the negative electrode during low-rate lithium insertion. As lithium ions intercalate into the graphite host lattice, the carbon structure shifts through distinct phases from stage four up to stage one (LiC6). Each transition produces a discreet step in chemical potential.
Low-rate testing maps these steps with precise voltage plateau definition, allowing engineers to track structural graphite loss independently from positive electrode degradation.
Mechanical stress accumulation varies significantly across operational C-rates due to concentration gradients within individual active particles. Table 1 compares kinetic and thermodynamic metrics across different galvanostatic testing regimes.
| Test Rate | Thermal Gradient (°C) | Overpotential Loss (mV) | Phase Boundary Resolution | Dominant Aging Mechanism Detected |
|---|---|---|---|---|
| C/100 | < 0.1 | 2 to 5 | Ultra High (< 1 mV) | Parasitic SEI Growth & Metal Dissolution |
| C/50 | < 0.2 | 5 to 12 | High (< 3 mV) | Lithium Inventory Trapping |
| C/20 | 0.3 to 0.8 | 15 to 35 | Moderate (5 mV) | Combined Mass & Lithium Loss |
| C/5 | 1.2 to 2.5 | 60 to 120 | Low (15 mV) | Electrode Macro-Cracking |
| 1C | 4.5 to 12.0 | 250 to 450 | Unresolved | Thermal Strain & Plating Risk |
Iron phosphate particles undergo isotropic lattice volume changes of roughly 6.8 percent during complete charge and discharge cycles. Repeating these phase changes at ultra-low rates allows structural micro-voids to form along phase boundary interfaces within large grains. Over time, these voids coalesce into full particle fractures, isolating sub-domains from the electronic network.
The voltage profile tracks this structural isolation through a gradual reduction in total plateau capacity during low-rate holds.
Acid attack on the iron phosphate cathode intensifies when cells sit at elevated states of charge under galvanostatic trickle conditions. Hydrofluoric acid strips iron ions from the outer surface of active material grains, leaving behind a lithium-depleted, amorphous phosphate shell. This passivating surface layer increases charge-transfer resistance across the electrode-electrolyte interface.
Low-rate galvanostatic sweeps measure this resistance growth as a steady widening of voltage hysteresis between charging and discharging branches.
Temperature stability during low-rate galvanostatic testing alters the rate of parasitic film growth on the negative electrode. Higher ambient temperatures boost ionic transport within the solid electrolyte interphase while accelerating chemical degradation pathways. Running low-rate tests at elevated ambient temperatures isolates chemical decay mechanisms from mechanical stress factors, providing clean data for Arrhenius degradation modeling.
A simple rule of thumb governs near-equilibrium diagnostic sweeps: lower C-rates reveal true thermodynamic health, while higher C-rates measure transport bottlenecks.

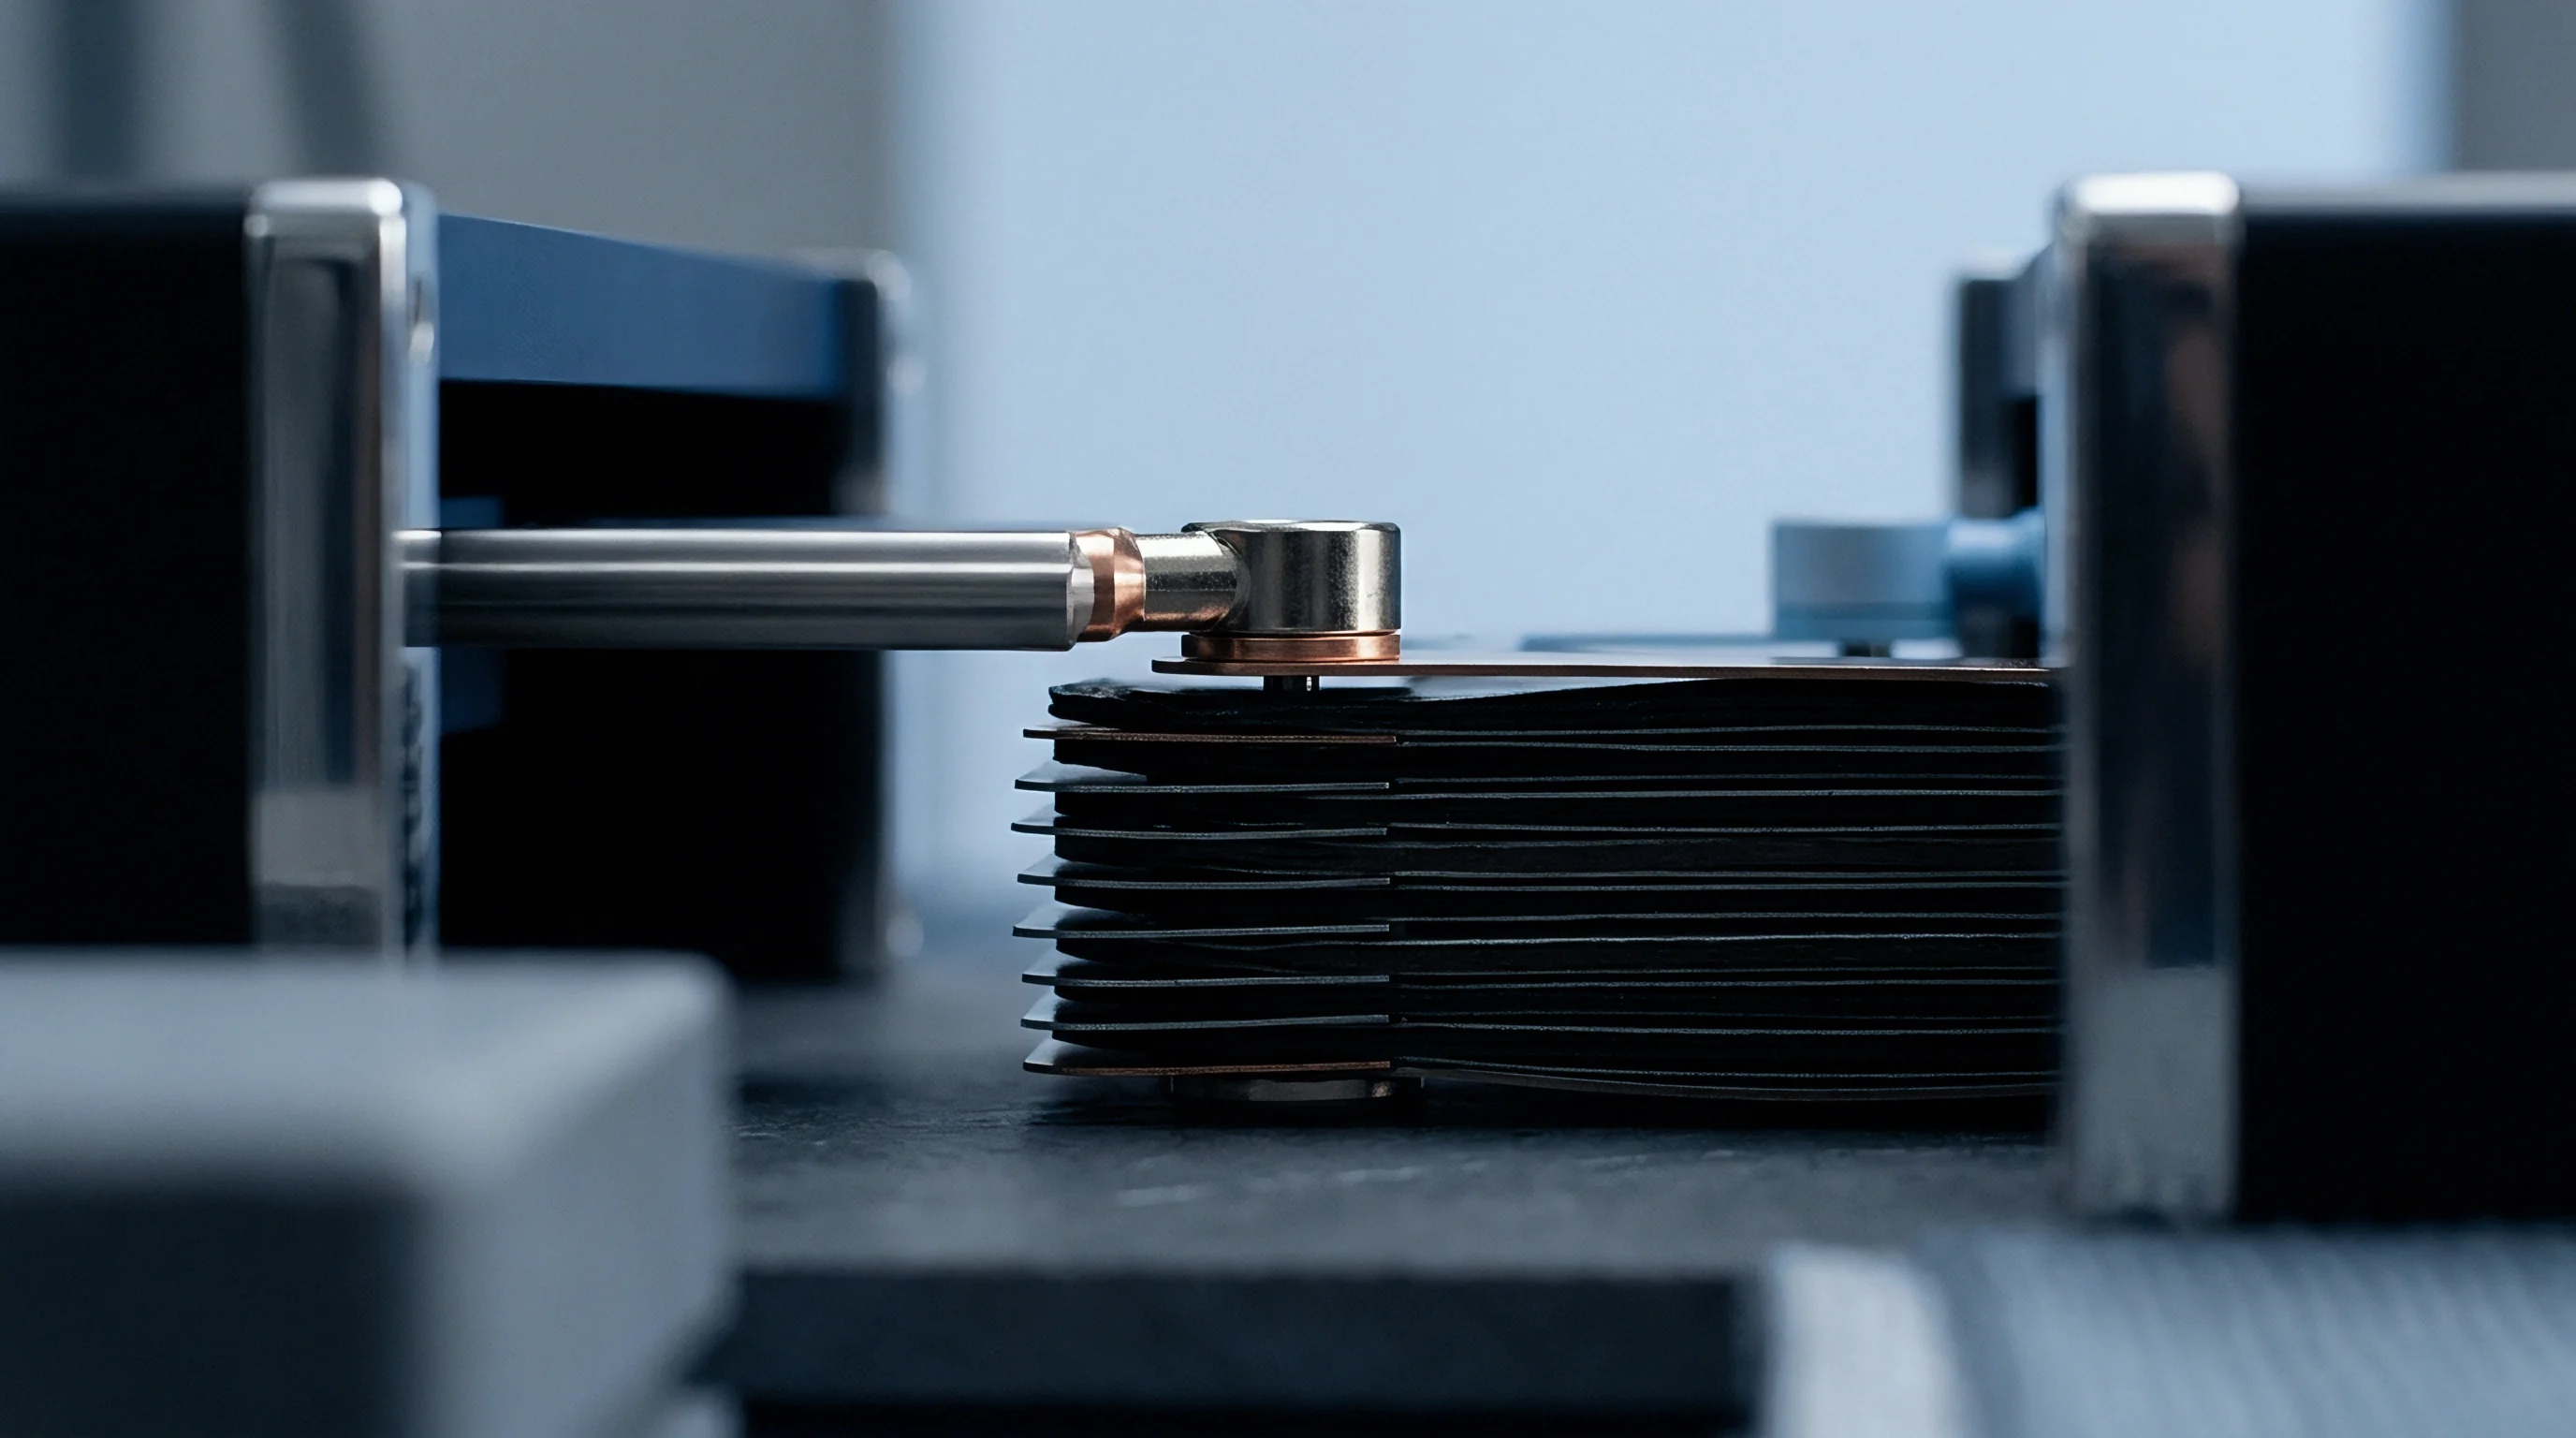
Channel
Test channel hardware dictates the diagnostic accuracy of low-rate galvanostatic measurements. Low current testing requires high-precision current drivers and analog-to-digital converters to keep instrument noise from corrupting differential capacity calculations. Standard cycle-testing equipment lacks the current stability required to execute C/50 sweeps without drift.
Current noise translates directly into artificial voltage spikes when calculating derivatives, rendering diagnostic peaks unusable for quantitative modeling.
High-resolution cyclers use 24-bit analog-to-digital conversion architecture to record microvolt-level potential changes across long testing sweeps. Voltage resolution must remain below 10 microvolts to capture subtle inflection points in the flat lithium iron phosphate voltage curve. Current control accuracy must exceed 0.005 percent of full-scale range.
Current instability introduces slope errors into differential capacity plots, masking genuine chemical transformations behind test channel artifacts.
Thermal chamber stability represents another strict requirement for low-rate testing channels. Ambient temperature fluctuations shift open-circuit cell potentials due to the entropic heat coefficient of the cell materials. A temperature fluctuation of 1°C induces a voltage change of several hundred microvolts in lithium iron phosphate cells ~ a magnitude that matches or exceeds the diagnostic signals tracked during differential capacity analysis.
Testing chambers maintain temperatures within tight tolerances to prevent environmental noise from obscuring structural data.
Thermal drift distorts differential curves: baseline qualification tests showed that test channel controls drifting by 0.8°C produced phantom peaks in differential capacity plots mimicking cathode active mass loss. Eliminating these thermal artifacts required re-qualifying the environmental chambers to a maximum spatial variation of 0.1°C across all channel positions.
Does Low Rate Galvanostatic Testing Expose Hidden Degradation?
Extended low-rate testing reveals degradation mechanisms that bypass standard high-rate quality control protocols. High C-rate screening measures total delivered energy under combined thermal and transport stress. Cells with minor coating inhomogeneities, micro-cracks, or localized lithium plating often deliver nominal capacity at 1C rates due to thermal softening of the electrolyte.
Low-rate galvanostatic assays eliminate thermal flattery, forcing the cell to operate strictly within its thermodynamic boundary conditions and exposing localized structural defects.
Noise filtering plays a central role in processing low-rate galvanostatic raw data. Numerical differentiation of sampled voltage and current vectors amplifies high-frequency measurement noise. Applying naive finite-difference schemes produces unusable differential capacity spectra.
Advanced mathematical smoothing techniques, such as Savitzky-Golay filtering or cubic spline interpolation, preserve peak height and position while removing measurement artifacts. The filter window width balances noise reduction against signal distortion.
Executing a reliable low-rate galvanostatic diagnostic assay demands strict adherence to sequential operational steps:
- Mount the cell inside a thermal chamber stabilized to 25.0°C with maximum spatial drift under 0.1°C.
- Execute a resting period of 4 hours to ensure structural thermal equilibrium throughout the cell volume.
- Apply a full constant current charge sweep at C/50 rate until reaching the upper cut-off voltage specified on the datasheet.
- Hold cell potential at the upper cut-off voltage until charging current drops below C/1000 rate.
- Rest the cell in open-circuit condition for exactly 2 hours to capture initial relaxation potential.
- Execute a full constant current discharge sweep at C/50 rate down to the lower cut-off voltage limit.
- Extract raw voltage, current, and time arrays at precise sampling intervals not exceeding 10 seconds.
- Process the raw data stream using a calibrated Savitzky-Golay polynomial filter to generate clean dQ/dV profiles.
Galvanostatic Intermittent Titration Technique (GITT) offers an alternative low-rate assay protocol, applying sequential current pulses separated by long open-circuit relaxation periods. This technique measures transient overpotential and true thermodynamic equilibrium potential as functions of state of charge. Combining low-rate continuous sweeps with GITT pulses allows engineers to separate solid-state diffusion kinetics from parasitic surface reaction losses across the entire lithiation range.
Data acquisition rates require careful configuration during long-duration low-rate testing. Low sampling rates miss sudden voltage transitions during graphite phase changes, blunting differential capacity peaks. High sampling rates generate massive data volumes that slow down numerical filtering algorithms without improving signal quality.
Setting voltage-change triggers alongside fixed time-interval sampling captures critical phase boundary transitions while optimizing computational efficiency.
Baseline drift correction ensures long-term comparative accuracy across multi-month aging studies. Test channels undergo periodic recalibration using reference voltage sources to prevent hardware amplifier drift from skewing long-term data sets. Small calibration errors in channel voltage amplifiers lead to false conclusions regarding lithium inventory decay rates over extended monitoring programs.
Failure to isolate ambient electromagnetic interference on low-rate test channels resulted in forty thousand dollars in repeated assay costs when unshielded signal cabling corrupted a six-week qualification sweep.

Variance
Supplier datasheets present cell performance metrics optimized under favorable laboratory conditions. Standard rating protocols rely on 1C discharge rates, moderate temperatures, and aggressive cut-off voltages to maximize published capacity numbers. High-rate testing obscures early-stage electrochemical degradation by generating internal Joule heating.
Internal heat lowers electrolyte viscosity and increases solid-state lithium diffusion rates, masking underlying active material loss and lithium inventory depletion.
Low-rate galvanostatic testing strips away operational flattery, presenting an unvarnished view of cell health. A cell retaining 90 percent capacity under standard 1C cycling may exhibit severe thermodynamic degradation when evaluated at C/50 rates. Operating at C/50 removes thermal assistance, exposing capacity losses caused by particle isolation, localized plating, and solid electrolyte interphase thickening.
Buyers relying solely on standard datasheet metrics risk deploying compromised cells into demanding long-life applications.
The gap between standard datasheet metrics and low-rate diagnostic realities spans multiple operational parameters. Table 2 details how standard supplier testing obscures structural decay mechanisms that low-rate galvanostatic assays reliably expose.
| Performance Metric | Standard Datasheet Method (1C) | Low-Rate Assays (C/50) | Observed Discrepancy Cause |
|---|---|---|---|
| Capacity Retention | Overestimates usable charge by 3 to 7 percent | Measures absolute stoichiometric limit | Joule heating lowers internal cell impedance during 1C test |
| Lithium Loss Detection | Unresolved until overall capacity drops > 15% | Detects < 1% lithium inventory loss | High C-rate overpotential masks subtle curve shifts |
| Cathode Microcracking | Blended into total internal resistance increase | Identified via positive electrode peak shrinkage | Dynamic rate dynamics hide particle-level electronic isolation |
| Anode Staging Health | Completely invisible in standard voltage slope | Resolves individual graphite intercalation steps | High ionic flux blurs structural step transitions |
| Thermal Sensitivity | Confounded by cell self-heating during test | Isolated strictly to chamber temperature | 1C currents produce core-to-surface thermal gradients |
Five production lots were rejected following differential capacity assays that revealed advanced lithium inventory depletion despite the cells passing the factory 1C capacity acceptance check. Standard factory checks failed to identify that 6 percent of the cyclable lithium resided inside secondary anode reaction films. Low-rate galvanostatic curves identified this shift immediately through characteristic peak attenuation in the differential capacity domain.
Capacity claims published in marketing literature frequently depend on wide operational voltage windows. Manufacturers rate cells down to 2.0 volts or up to 3.65 volts to maximize nominal amphour ratings. Low-rate galvanostatic testing shows that operating at these extreme voltage limits accelerates iron dissolution and electrolyte degradation without adding meaningful energy content.
Near-equilibrium sweeps show that 98 percent of total energy storage capacity sits within the stable 3.0 to 3.45 volt band.
Evaluating incoming cell batches requires explicit diagnostic criteria to separate acceptable production variances from underlying chemical defects:
- Differential Capacity Peak Alignment must match baseline reference values within a 5 millivolt window across the primary positive electrode redox feature.
- Graphite Staging Resolution must show clear, distinct inflection points during low-rate discharge sweeps without premature step blunting.
- Voltage Hysteresis Gap between charge and discharge low-rate curves must not exceed 40 millivolts at the 50 percent state-of-charge point.
- Total Stoichiometric Capacity extracted at C/50 must align with theoretical electrode mass loading targets within a 1.5 percent tolerance band.
Attributing capacity disparities to initial cell formatting variations, incomplete electrolyte wetting, or artificial stress from extended holds near maximum potential ignores the basic physics of battery diagnostics: low-rate testing measures intrinsic chemical state, whereas high-rate testing measures temporary kinetic throughput capability.
Low-rate testing protects procurement practices from accepting cells with latent degradation defects. Batch-to-batch variations in electrode slurry mixing, coating thickness, and calendar aging express themselves clearly under low-rate galvanostatic analysis. Establishing incoming inspection criteria based on low-rate differential capacity profiles ensures that imported cell batches meet lifetime expectations before integration into high-value energy storage systems.
A 4 percent low-rate capacity deficit attributed to a two-hundred-cycle cathode activation requirement proved under diagnostic analysis to be accelerated lithium consumption masquerading as material conditioning.

Obligation
Cell qualification records establish the legal foundation for transport safety filings and commercial warranty enforcement. Under international dangerous goods transport frameworks, lithium iron phosphate cells must successfully complete UN 38.3 testing protocols before entering commercial freight channels. While UN 38.3 focuses on mechanical, thermal, and electrical safety hazards, underlying electrochemical degradation directly influences cell structural response under mechanical stress testing.
Low-rate galvanostatic testing identifies structural weaknesses that compromise transport compliance over extended operational life cycles. Cells experiencing severe microcracking, iron dissolution, or internal gas evolution from low-rate parasitic reactions exhibit reduced tolerance to UN 38.3 T.3 vibration and T.4 mechanical shock tests. Internal structural detachment of electrode coatings from current collectors, invisible during basic voltage checks, leads to internal short circuits when subjected to mechanical vibration profiles on transport test rigs.
The EU Battery Regulation imposes strict obligations regarding carbon footprint calculations, recycled content declarations, and performance durabilities. Technical documentation must demonstrate sustained performance metrics verified under standard diagnostic conditions. Low-rate galvanostatic assays provide the baseline empirical data required to validate lifetime state-of-health performance models required by regulatory auditors.
Omitted or inaccurate aging data risks product sales suspensions and mandatory market recalls across participating regulatory jurisdictions.
UN 38.3 test summaries remain valid only while cell structural and chemical specifications remain within certified production design tolerances.
Commercial supply contracts must reflect the technical realities revealed by low-rate galvanostatic testing. Standard warranty clauses that define cell end-of-life as an 80 percent nominal capacity retention under 1C cycling leave buyers exposed to premature field failures. A cell may maintain 80 percent capacity at high rates while losing over 30 percent of its cyclable lithium inventory, leaving it exceptionally vulnerable to thermal runaway during unexpected overcharge events.
Contractual risk allocation requires embedding clear, explicit low-rate characterization protocols into procurement agreements. Buyers must secure the right to audit incoming cell lots using low-rate differential capacity methodologies. Rejection thresholds should link directly to low-rate metric shifts, such as maximum allowable peak position drift or voltage hysteresis expansion, rather than relying solely on simple high-rate discharge tests executed at factory gates.
The buyer holds incoming shipments until low rate sweeps confirm lithium inventory compliance across statistical sample sets. Integrating these empirical verification steps into quality control processes protects downstream integrators from assuming financial liability for hidden manufacturing defects. Sourcing practices that skip low-rate verification remain exposed to early warranty claims, shipping delays, and costly field retrofits.
Section 8.2 of standard supply master agreements establishes that incoming batch acceptance relies on supplier certificate of analysis documents unless the buyer delivers certified third-party laboratory test reports demonstrating non-conformity to low-rate differential capacity baselines within forty-five days of port arrival.