Quantifying Non Linear Capacity Rollover Mechanics in High Nickel Cathode Formulations
High-nickel cathode rollover stems from high-voltage H2-H3 phase strain and microcracking; contractually bound dQ/dV and resistance growth limits protect assets.


Onset
High-nickel cathode formulations ~ specifically nickel-manganese-cobalt oxides with over 80 percent nickel (NMC811) and nickel-cobalt-aluminum (NCA) variants ~ degrade in two distinct stages. Early on, capacity loss follows a predictable, sub-linear trend driven by solid electrolyte interphase growth at the graphite anode and steady consumption of cyclable lithium. Once the cell hits a critical threshold, degradation accelerates sharply, bending the state-of-health curve downward.
This non-linear capacity rollover drops remaining discharge capacity from 85 percent to under 60 percent in just tens of cycles, breaking the linear extrapolation models used in financial yield projections.
This non-linear rollover is triggered by a structural phase change inside the nickel-rich cathode particles at high states of charge. Extracting lithium ions past 75 percent state-of-charge ~ corresponding to cell voltages above 4.15 V against lithium ~ causes the crystal lattice to shift rapidly from the hexagonal H2 phase to H3. The H2-to-H3 transition induces severe anisotropic contraction: the c-axis shrinks by more than 7 percent, while the a-axis barely moves.
The resulting internal shear stress overcomes the grain boundary strength of polycrystalline secondary particles, cracking the material along its grain boundaries throughout the cathode.
Differential voltage analysis reveals that the onset of non-linear capacity rollover correlates with a 40 percent acceleration in high-voltage peak shift rate measured under C/10 reference cycles at 25 degrees Celsius.
Microcracks expose fresh cathode crystal facets directly to the liquid carbonate electrolyte. These raw, highly catalytic surfaces react with solvent molecules to form organic passivating layers alongside gaseous byproducts ~ oxygen, carbon dioxide, and carbon monoxide. The surface reconstruction converts active layered material into electrochemically inactive rocksalt and spinel phases, consuming liquid electrolyte and releasing transition metal ions into solution.
Localized internal resistance spikes as a result, distorting current density across the electrode stack.
Electrolyte depletion from intergranular wetting and gas generation starves active pores in the separator and electrode coatings. As localized ionic resistance climbs, charge-transfer kinetics degrade unevenly across the current collector surface. Localized overpotentials then force adjacent areas to carry higher current loads during fast-charge pulses, driving dynamic cell degradation further.
Microstructural Grain Boundary Degradation
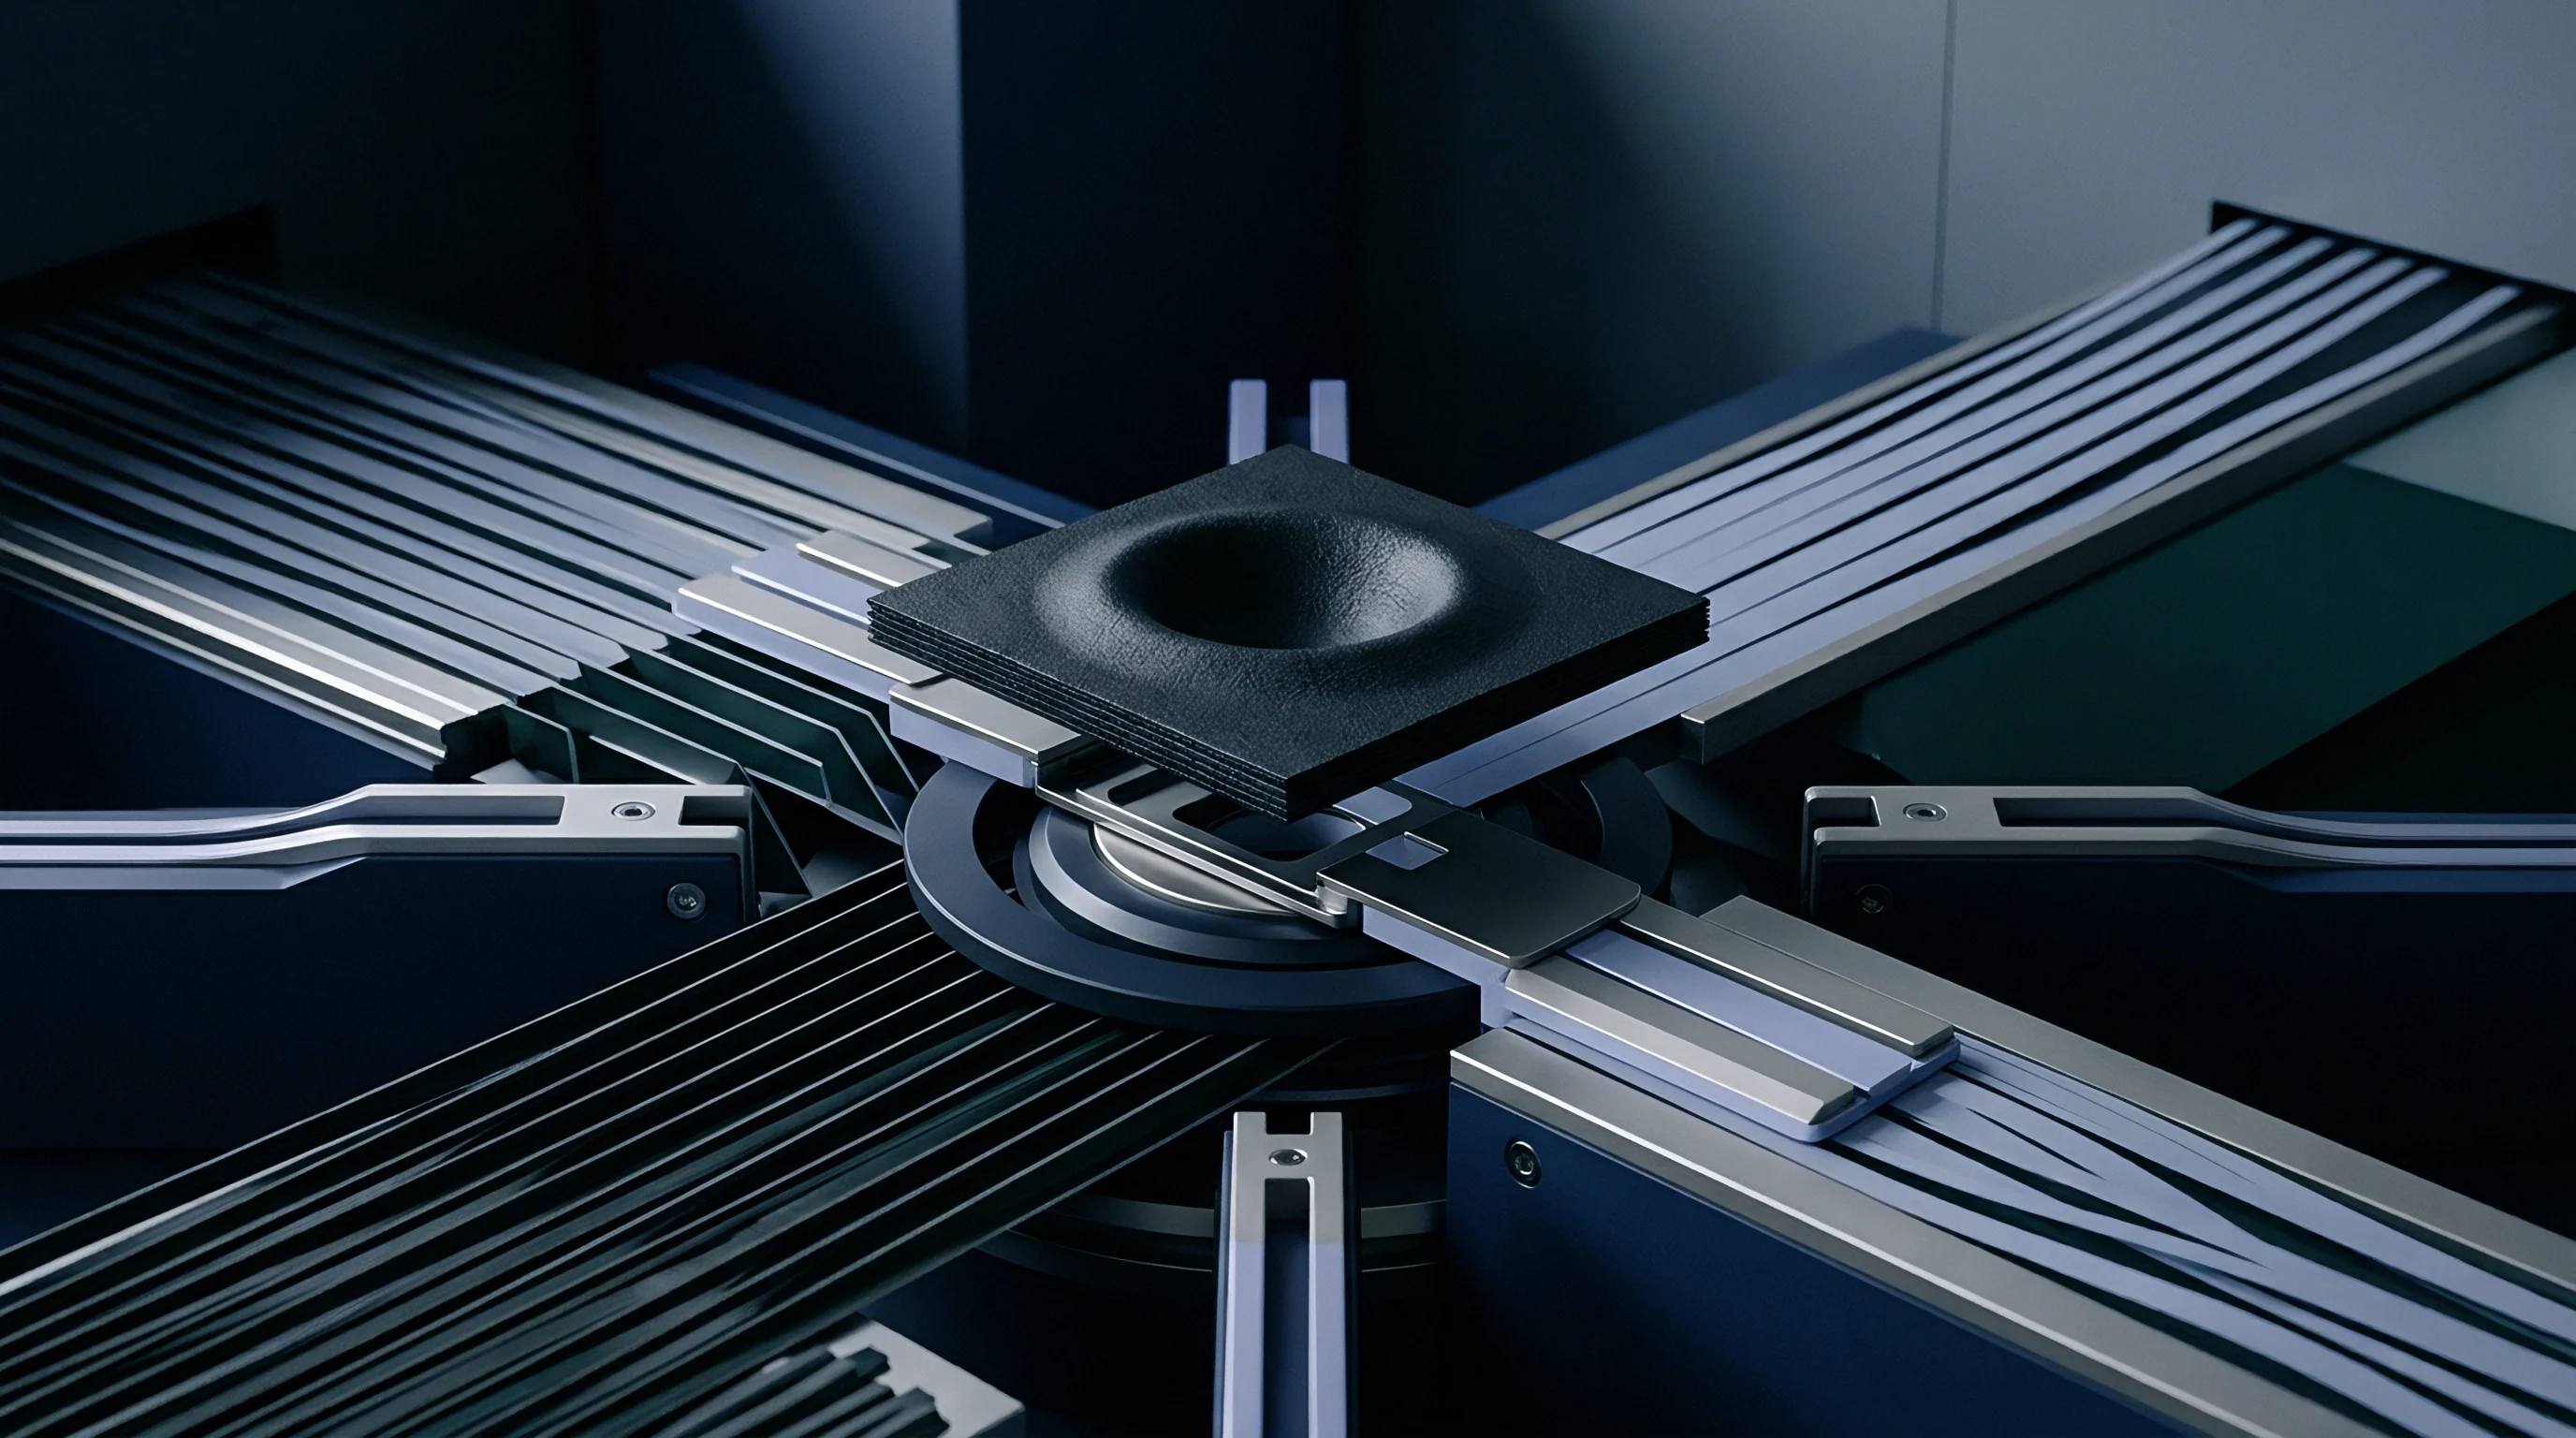
Polycrystalline secondary spheres made of primary grains between 200 nanometers and 2 micrometers break down under deep cycling. Strain accumulating along grain boundaries concentrates mechanical stress during every cycle. Once that strain hits a critical threshold, intergranular fractures propagate from the particle core to the surface, forming capillary networks that draw liquid electrolyte deep into the interior.
| Cathode Stoichiometry | Upper Cut-Off Voltage | c-Axis Lattice Contraction | Typical Rollover Cycle Window | Impedance Growth Rate Post-Rollover |
|---|---|---|---|---|
| LiNi0.80Co0.10Mn0.10O2 (NMC811) | 4.20 V | 7.2 % | 600 – 850 cycles | 3.8x baseline |
| LiNi0.85Co0.10Mn0.05O2 (NMC85) | 4.25 V | 8.1 % | 450 – 650 cycles | 5.2x baseline |
| LiNi0.90Co0.05Mn0.05O2 (NMC90) | 4.30 V | 9.4 % | 300 – 450 cycles | 8.1x baseline |
| LiNi0.88Co0.09Al0.03O2 (NCA) | 4.20 V | 7.6 % | 500 – 750 cycles | 4.4x baseline |
Primary particle orientation inside the secondary sphere controls how stress is distributed during phase shifts. Random crystallographic orientations generate multi-directional stress vectors, raising the likelihood of boundary cleavage during deep discharge cycling. Single-crystal high-nickel variants mitigate this by eliminating internal grain boundaries, though single-crystal particles face higher risks of macro-scale fracture under heavy compression during electrode calendering.


Strain
Uneven strain across high-nickel electrode layers directly governs particle fracturing and electrolyte consumption rates. Dynamic strain monitoring shows that volume changes in the cathode compress the separator during charge and relax during discharge. In commercial pouch and cylindrical formats, this cyclic breathing causes mechanical fatigue in the jellyroll, degrading the physical contact between the separator and electrode interfaces.
Transition metal dissolution accelerates non-linear rollover. Manganese, cobalt, and nickel ions dissolved from exposed cathode grain surfaces cross the liquid electrolyte and deposit on the graphite anode. There, they break down the passivating solid electrolyte interphase.
The exposed graphite then reacts with electrolyte solvents, growing a resistive secondary film of lithium fluoride and lithium carbonate that continually drains cyclable lithium.
Anode Lithium Plating Feedback Loops
Impedance growth at the anode shifts the graphite electrode’s equilibrium potential during fast charging. As the passivating film thickens and resistance climbs, the kinetic overpotential needed for lithium insertion forces the local anode potential below 0 V relative to Li/Li+. Metallic lithium then plates directly onto the graphite surface rather than intercalating into the carbon lattice.
Plated lithium reacts aggressively with carbonate solvents, forming mossy and dendritic structures with high surface areas. This layer ties up active lithium, consumes liquid electrolyte, and blocks ionic access to underlying graphite pores. The resulting flow bottlenecks heighten local current density discrepancies, pushing adjacent regions into overpotential regimes and accelerating self-sustaining capacity rollover.
Transition metal migration to the anode accelerates when cathode operating voltage exceeds 4.20 V, doubling manganese dissolution rates for every 5 degrees Celsius temperature increase above 35 degrees Celsius.
Cathode microcracking, transition metal dissolution, anode film growth, and metallic lithium plating form a closed feedback loop. Once lithium plating covers more than 15 percent of the active anode surface area, degradation permanently shifts from linear aging to rapid rollover. Running cells within shallow depth-of-discharge windows limits the severe anisotropic strain that initiates particle cracking in the first place.


Electrolyte
Liquid electrolyte formulations in high-nickel cells must balance high-voltage oxidation resistance at the cathode with low-impedance film formation at the anode. Standard mixtures of lithium hexafluorophosphate (LiPF6) in carbonate solvents ~ such as ethylene carbonate, dimethyl carbonate, and ethyl methyl carbonate ~ decompose rapidly above 4.10 V. Trace moisture reacts with LiPF6 to form hydrofluoric acid, which attacks transition metal oxide bonds on exposed cathode surfaces.
Additives including vinylene carbonate (VC), fluoroethylene carbonate (FEC), and 1,3-propane sultone (PS) form sacrificial layers that suppress solvent oxidation and metal dissolution. However, higher additive concentrations raise initial charge-transfer impedance at both electrode interfaces. Over repeated cycles, these molecules are gradually consumed as they repair film on newly cracked surfaces, eventually exhausting the electrolyte’s additive reserve.

Chemical Evolution and Gas Generation
When electrolyte additives run low, parasitic reactions accelerate. Without passivating agents protecting the surface, carbonate solvents oxidize directly on the high-nickel cathode, generating acid species and gases inside the cell. Carbon dioxide, carbon monoxide, oxygen, and volatile fluorocarbons build internal pressure and push liquid electrolyte out of active separator pores.
- Vinylene Carbonate Depletion accelerates cathode transition metal dissolution once liquid phase concentrations drop below 0.2 weight percent within the total electrolyte mass.
- Fluoroethylene Carbonate Reduction stabilizes the anode film against lithium plating up to 300 cycles before consumption permits rapid impedance growth.
- Sulfone Class Additives maintain interfacial film stability under elevated temperature aging but increase initial cell direct-current resistance by up to 12 percent.
- Lithium Difluorophosphate Co-Salts reduce charge-transfer resistance across fractured cathode primary grains while suppressing HF acid generation within the bulk liquid phase.
Gas bubbles trapped inside electrode pores starve ionic pathways, creating dry spots that force current through the remaining wet areas. These localized current bottlenecks raise local C-rates beyond design limits, generating thermal hotspots that drive secondary phase breakdown. This trade-off between additive concentration and initial direct-current resistance continues to set the upper ceiling on cycle life in high-density nickel-rich formulations.


Quantification
Tracking non-linear capacity rollover requires precise diagnostic metrics measured during ongoing cycle aging. Standard terminal capacity monitoring fails to warn of impending rollover because capacity curves frequently stay flat or strictly linear until 10 to 30 cycles before the knee point. Advanced diagnostic methods isolate internal failure mechanisms well before rapid capacity loss sets in.
Differential capacity analysis (dQ/dV) tracks the derivative of discharge capacity against terminal voltage during low-rate reference cycles. The voltage position and area of specific dQ/dV peaks reflect phase transformation kinetics and the remaining cyclable lithium. A low-voltage peak shifting toward higher potentials during charge signals rising polarization, while peak area shrinkage measures lithium loss.
When the graphite phase transition peak shifts by more than 15 millivolts over 50 cycles, non-linear rollover typically follows within 100 cycles.

Coulombic Efficiency Deficit and Resistance Inflexion
High-Precision Coulombic Efficiency (HPCE) measurements quantify parasitic reaction currents during early cycling. Standard cell cyclers have drift rates around 100 parts per million, masking subtle parasitic losses. Equipment accurate to within 10 parts per million resolves coulombic efficiency deficits down to 99.98 percent, offering early insight into electrolyte breakdown rates.
Electrochemical Impedance Spectroscopy (EIS) tracks real and imaginary impedance from 10 kilohertz down to 10 millihertz. Charge-transfer resistance (R_ct) and passivating film resistance (R_sei) grow along distinct paths as the cell ages. While R_ct remains stable during early linear degradation, it climbs exponentially right before rollover, driven by cathode microcracking and surface rocksalt phase formation.
Contractual performance specifications must mandate HPCE monitoring during cell qualification, as a baseline efficiency below 99.92 percent at 0.5C and 45 degrees Celsius indicates impending rollover prior to cycle 500.
Anode overhang tracking complements differential voltage analysis. Unused graphite along electrode edges acts as a slow lithium reservoir, taking in lithium during charge and releasing it during extended rest periods. Failing to compensate mathematically for overhang relaxation distorts lithium loss estimates, throwing off predictions of when rollover will start.
- Establish Baseline Reference Cycles using C/20 charge and discharge rates at 25 degrees Celsius every 50 standard operating cycles to isolate thermodynamic capacity from kinetic overpotential losses.
- Compute Differential Capacity Derivative Vectors to detect shift rates in the H2-to-H3 phase transition peak above 4.10 V.
- Extract Mid-Frequency Real Impedance Intercepts from EIS Nyquist plots to quantify charge-transfer resistance growth across both electrode interfaces.
- Calculate Incremental Coulombic Efficiency Deficits across consecutive C/2 charge-discharge cycles to evaluate liquid additive consumption rates.
- Apply Non-Linear Degradation Curve Fitting using dual-exponential models to calculate the cycle index where the capacity derivative dQ/dN changes sign.
Relying solely on 1C cycling data without low-rate reference cycles hides internal polarization growth caused by charge-transfer overpotentials. A cell might deliver 82 percent rated capacity at 1C while its low-rate thermodynamic capacity remains at 88 percent. Once internal resistance crosses a critical limit, 1C capacity can plummet to 50 percent in just 20 cycles, unsettling pack thermal management and setting off system fault flags.


Validation
Validating high-nickel cell longevity requires test matrices that separate voltage stress, temperature effects, and mechanical strain. Accelerated life testing that relies on high C-rates at elevated temperatures often misses real-world rollover mechanics. High C-rates induce localized heating while reducing the time spent at upper cut-off voltages, paradoxically suppressing high-voltage oxidation and phase-change lattice damage.
Decoupled qualification matrices combine stepped-voltage storage, dynamic drive-cycle simulation, and targeted fast-charge pulse profiles. Upper cut-off voltage testing isolates chemical degradation by holding cells at 4.20 V, 4.25 V, and 4.30 V at 45 degrees Celsius under continuous float conditions. This decouples electrolyte oxidation and transition metal dissolution rates from the mechanical strain caused by lattice breathing during cycling.

Accelerated Testing Matrix Design
Dynamic life testing uses variable fast-charging steps tailored to real-world state-of-charge windows. Fast-charging between 10 percent and 50 percent state-of-charge carries minimal lithium plating risk due to low initial anode overpotentials and wide open-circuit voltage gaps. Pushing fast charges past 70 percent state-of-charge ~ where graphite intercalation requires lower current densities ~ dramatically accelerates non-linear rollover through localized plating.
| Test Protocol | Operating Conditions | Primary Degradation Mechanism Targeted | Acceleration Factor vs Real Field Profile |
|---|---|---|---|
| High-Voltage Float Storage | 4.25 V hold, 45 °C, 30 days | Electrolyte oxidation, TM dissolution | 4.5x time acceleration |
| Dynamic Fast-Charge Cycling | 1.5C (10-70% SOC), 1C discharge, 25 °C | Anode lithium plating, mechanical strain | 2.8x cycle acceleration |
| Thermal Shock Stressing | -20 °C to 55 °C cycling pulses | Mechanical microcracking, SEI fracture | 3.2x cycle acceleration |
| Deep DOD Full-Range Cycling | 100% DOD (2.5 V – 4.20 V), 0.5C, 35 °C | Cathode H2-H3 phase change strain | 1.9x cycle acceleration |
Verification protocols must establish strict pass-fail criteria based on internal resistance growth rather than terminal capacity alone. Requiring cell capacity retention above 80 percent at cycle 800 is incomplete without also capping internal direct-current resistance growth at 100 percent over the same baseline over that cycle interval.


Arbitration
Translating electrochemical degradation limits into procurement contracts requires clear technical boundaries around rollover onset. Standard supplier warranties cover linear capacity decay down to 80 percent of initial capacity, hiding exposure to abrupt failure mechanisms right after the warranty threshold. Engineering teams must define test metrics that catch latent microstructural defects before approving high-volume manufacturing.
Cell supply agreements need specific batch qualification parameters that account for chemical variations across production lots. Impurities like iron, copper, and moisture in cathode precursor materials accelerate transition metal dissolution, bringing forward the onset of non-linear rollover. Sourcing contracts that cap precursor magnetic impurities below 10 parts per billion help reduce early failure variance across delivered cell lots.

Procurement Risk Mitigation Specifications
Contractual specifications should govern cell lot acceptance by building non-destructive diagnostic checks directly into factory line audits. Lots showing excessive impedance variance or low baseline coulombic efficiency during initial grading must be isolated before pack assembly. Procurement documents specify target thresholds, operational limits, and dispute resolution criteria for high-nickel cell supply streams.
- Knee-Point Cycle Margin mandates that the capacity decay curve first-derivative derivative inflection shall not occur prior to cycle 700 under 0.5C charge, 1C discharge, 100 percent depth-of-discharge at 30 degrees Celsius.
- Direct-Current Resistance Multiplier caps allowable 10-second pulse resistance growth to 1.5 times initial baseline values prior to reaching 80 percent remaining nominal capacity.
- High-Precision Efficiency Threshold defines a minimum allowable average coulombic efficiency of 99.93 percent across cycles 20 through 100 during qualification batch testing.
- Batch Homogeneity Index requires the standard deviation of 1 kHz AC impedance across a 10,000-cell production lot to remain within 2.5 percent of the lot mean value.
To illustrate the financial risk of non-linear degradation, consider a purchase agreement for a 50-megawatt-hour order of 21700-format NMC811 cells priced at 85 US dollars per kilowatt-hour factory gate. If a delivered lot exhibits an uncompensated 15 percent variance in knee-point onset across batch samples ~ where 12 percent of cells enter rollover at cycle 450 while the rest reach it at cycle 750 ~ pack balancing systems quickly become overwhelmed by capacity divergence, triggering premature pack replacement under field warranty terms.
Factoring warranty exposure, field labor, freight, and downtime penalties into landed costs shows that a 3 US dollar per kilowatt-hour savings on cell purchase price can yield a net loss of 18 US dollars per kilowatt-hour over the life of the energy storage system. Contract terms requiring supplier reimbursement for premature rollover failures should rely on standardized diagnostic metrics ~ specifically dQ/dV peak shift acceleration rates and EIS charge-transfer resistance limits measured in independent lab testing.
Landed cost per delivered cycle is the definitive metric when evaluating high-nickel cell procurement. The higher upfront cost of single-crystal cathodes or advanced additive packages is easily offset when rollover onset moves from cycle 500 out to cycle 900. Sourcing strategies that pair microstructural characterization with diagnostic screening and clear contractual specifications protect long-term performance and preserve capital in high-density storage assets.