Non-Newtonian Rheology Fundamentals in Battery Pack Thermal Gap Fillers
Non-Newtonian gap filler rheology controls high-shear dispensing speeds, wet squeeze forces, and long-term settlement stability in battery pack assembly.


Yield

Rheological Modeling of High Particle Loaded Formulations
Highly loaded thermal pastes exhibit non-linear shear responses governed by dense filler packing fractions. Silicones or polyurethane resins are blended with ceramic media like aluminum oxide and boron nitride to dissipate heat across module interfaces. These solid particles occupy sixty to eighty-five percent of the compound volume.
Inter-particle friction and spatial jamming create an internal network that resists flow until applied shear stress overcomes a structural threshold.
Modeling this behavior relies on the Herschel-Bulkley constitutive model, relating shear stress, shear rate, and yield stress:
τ = τ0 + K · (˙γ)n
In this equation, τ represents total shear stress in Pascals, τ0 is the static yield stress in Pascals, K is the consistency index in Pascal-seconds to the power of n, ˙γ denotes shear rate in inverse seconds, and n defines the dimensionless flow behavior index. An n value of one indicates Bingham plastic behavior, whereas values below one signify shear-thinning. Battery gap fillers typically display flow behavior index values between 0.25 and 0.50, dropping effective viscosity by two orders of magnitude under rapid displacement.
| Filler Grade | Static Yield Stress (Pa) | Consistency Index K (Pa·sn) | Flow Behavior Index n | Thixotropic Index (10s⁻¹ / 100s⁻¹) | Bulk Density (g/cm³) |
|---|---|---|---|---|---|
| 2.0 W/m·K Silicone | 180 to 250 | 85 to 130 | 0.42 | 3.8 | 2.4 |
| 3.5 W/m·K Silicone | 320 to 450 | 160 to 240 | 0.34 | 5.2 | 2.9 |
| 6.0 W/m·K Non-Silicone | 550 to 820 | 310 to 480 | 0.26 | 7.4 | 3.3 |
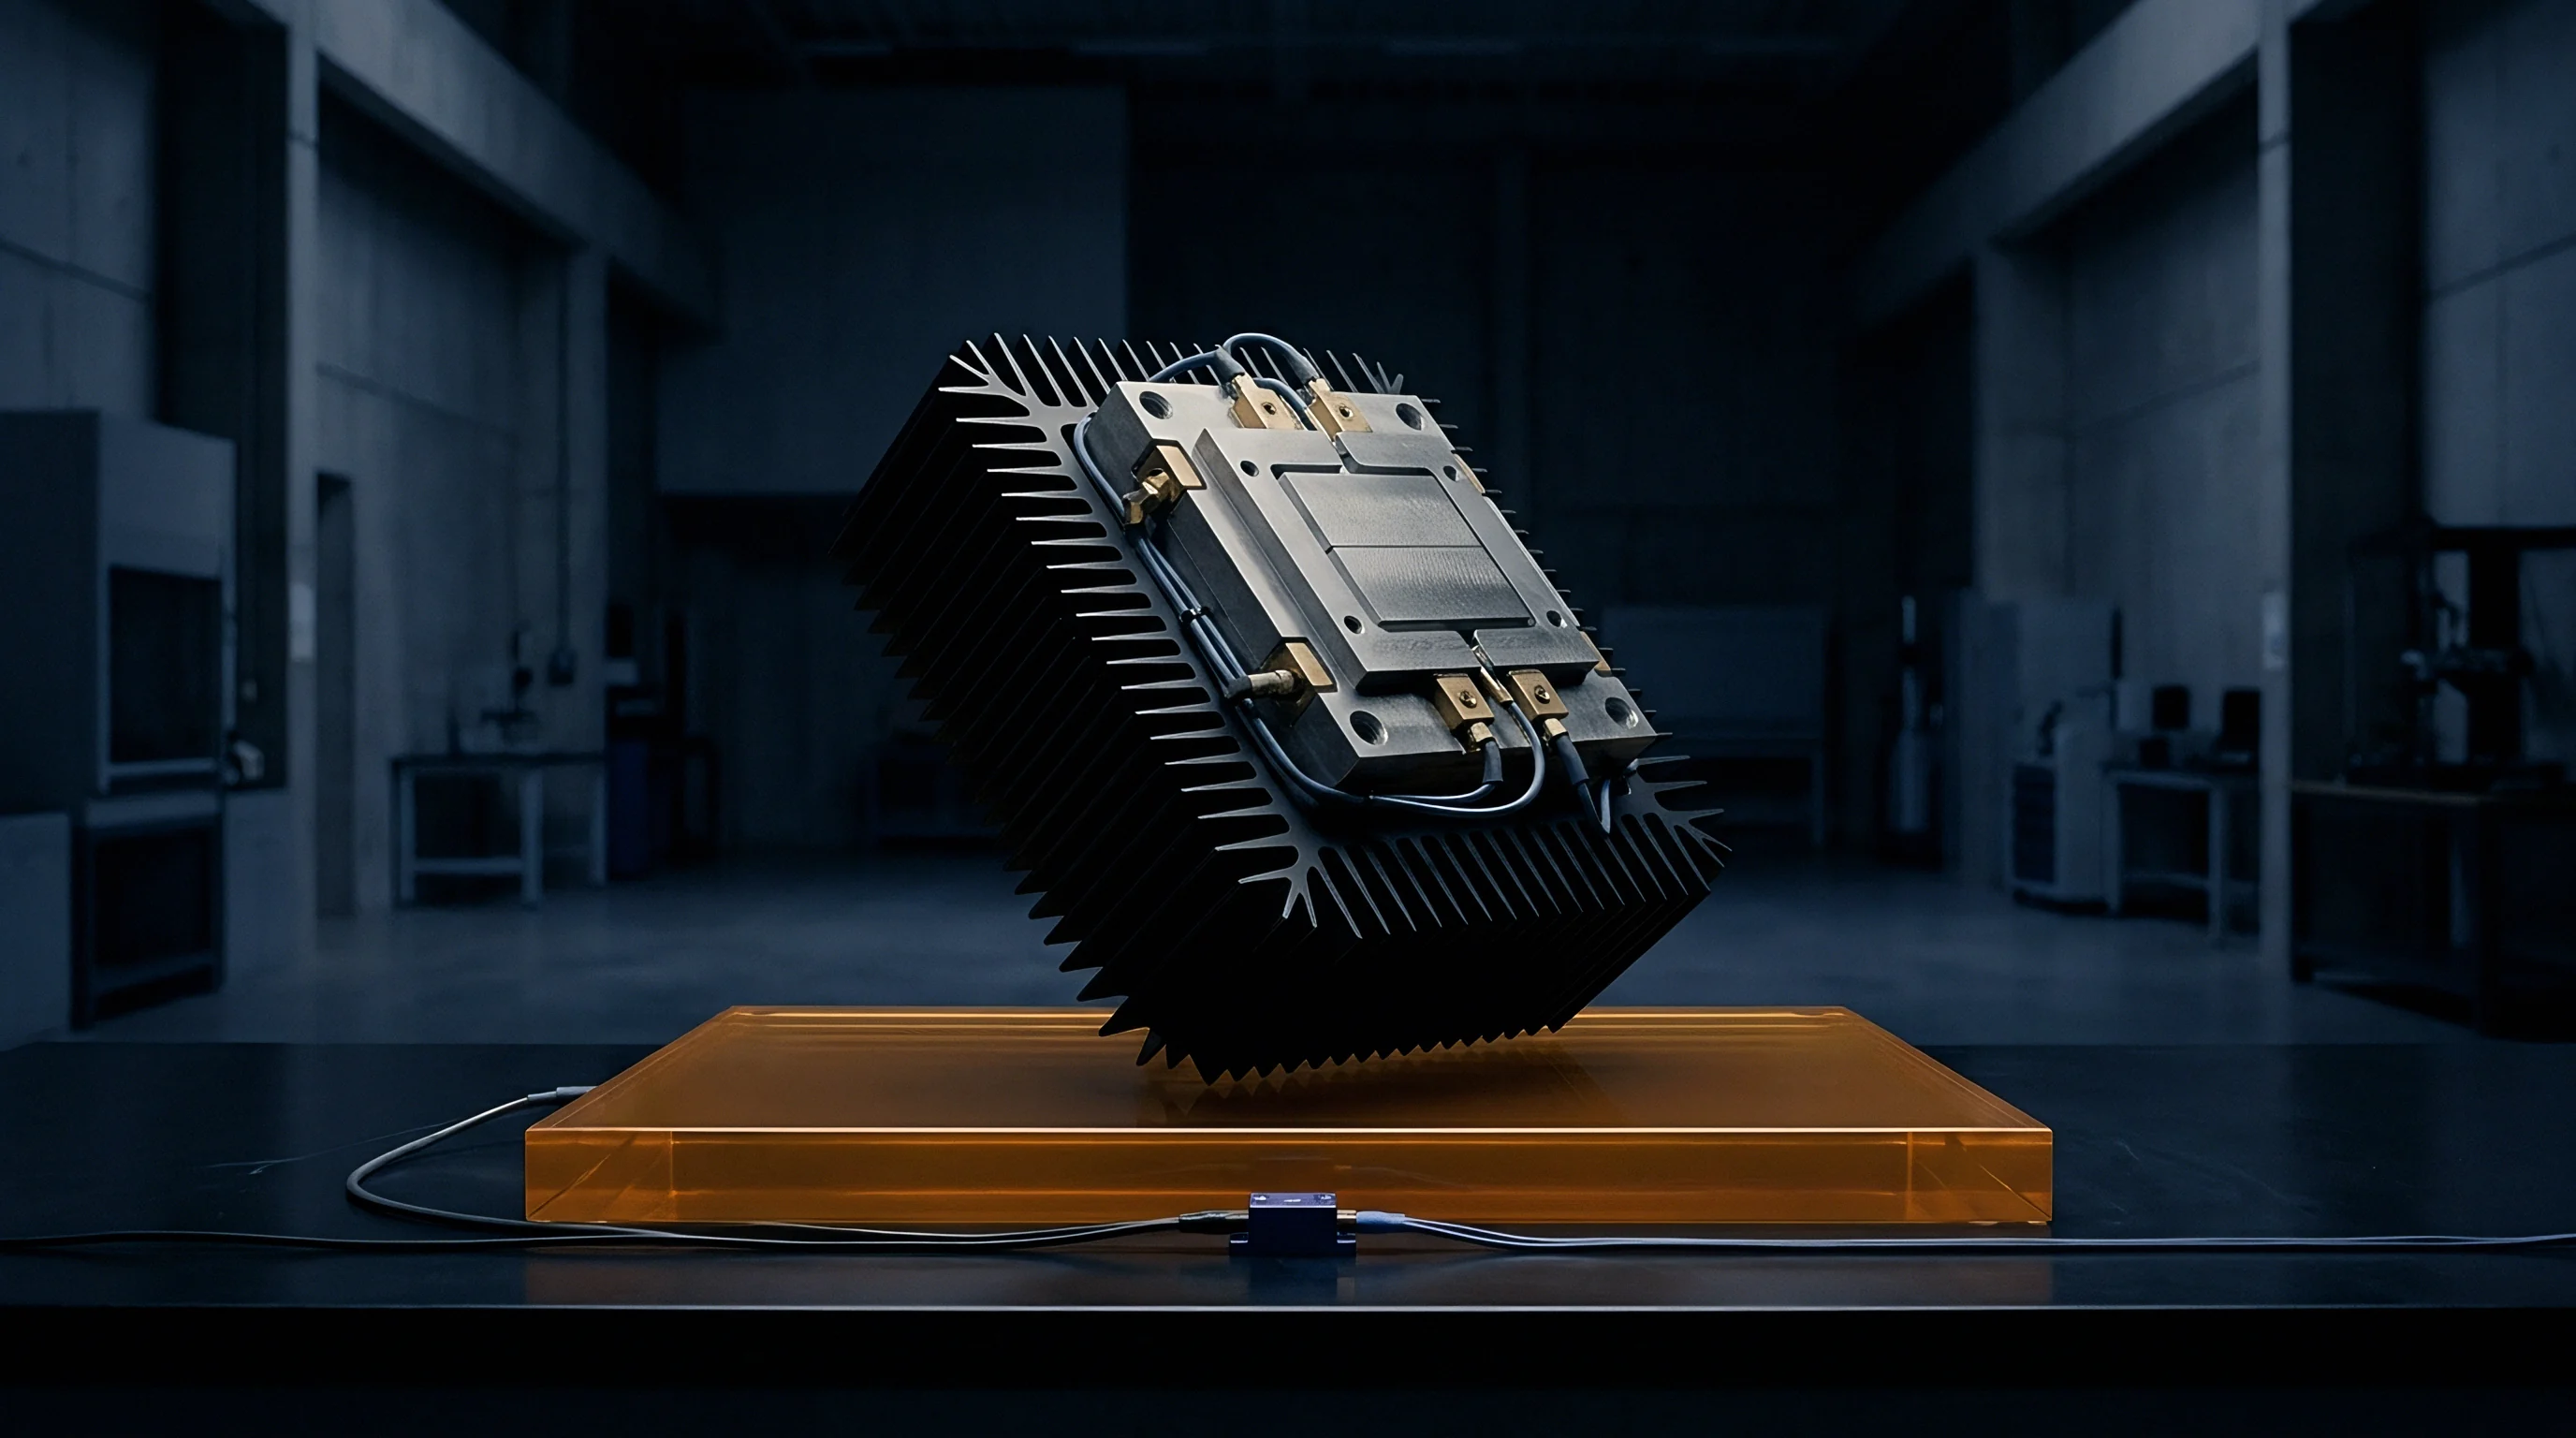
As high shear rates break agglomerates, the magnitude of static yield stress dictates whether an uncured gap filler holds its geometry after application to module side plates or cold plates. Low static yield stress permits material slumping prior to cell placement, causing compound run-off and air entrapment during structural seating.
Static Threshold Measurement Techniques and Creep Testing
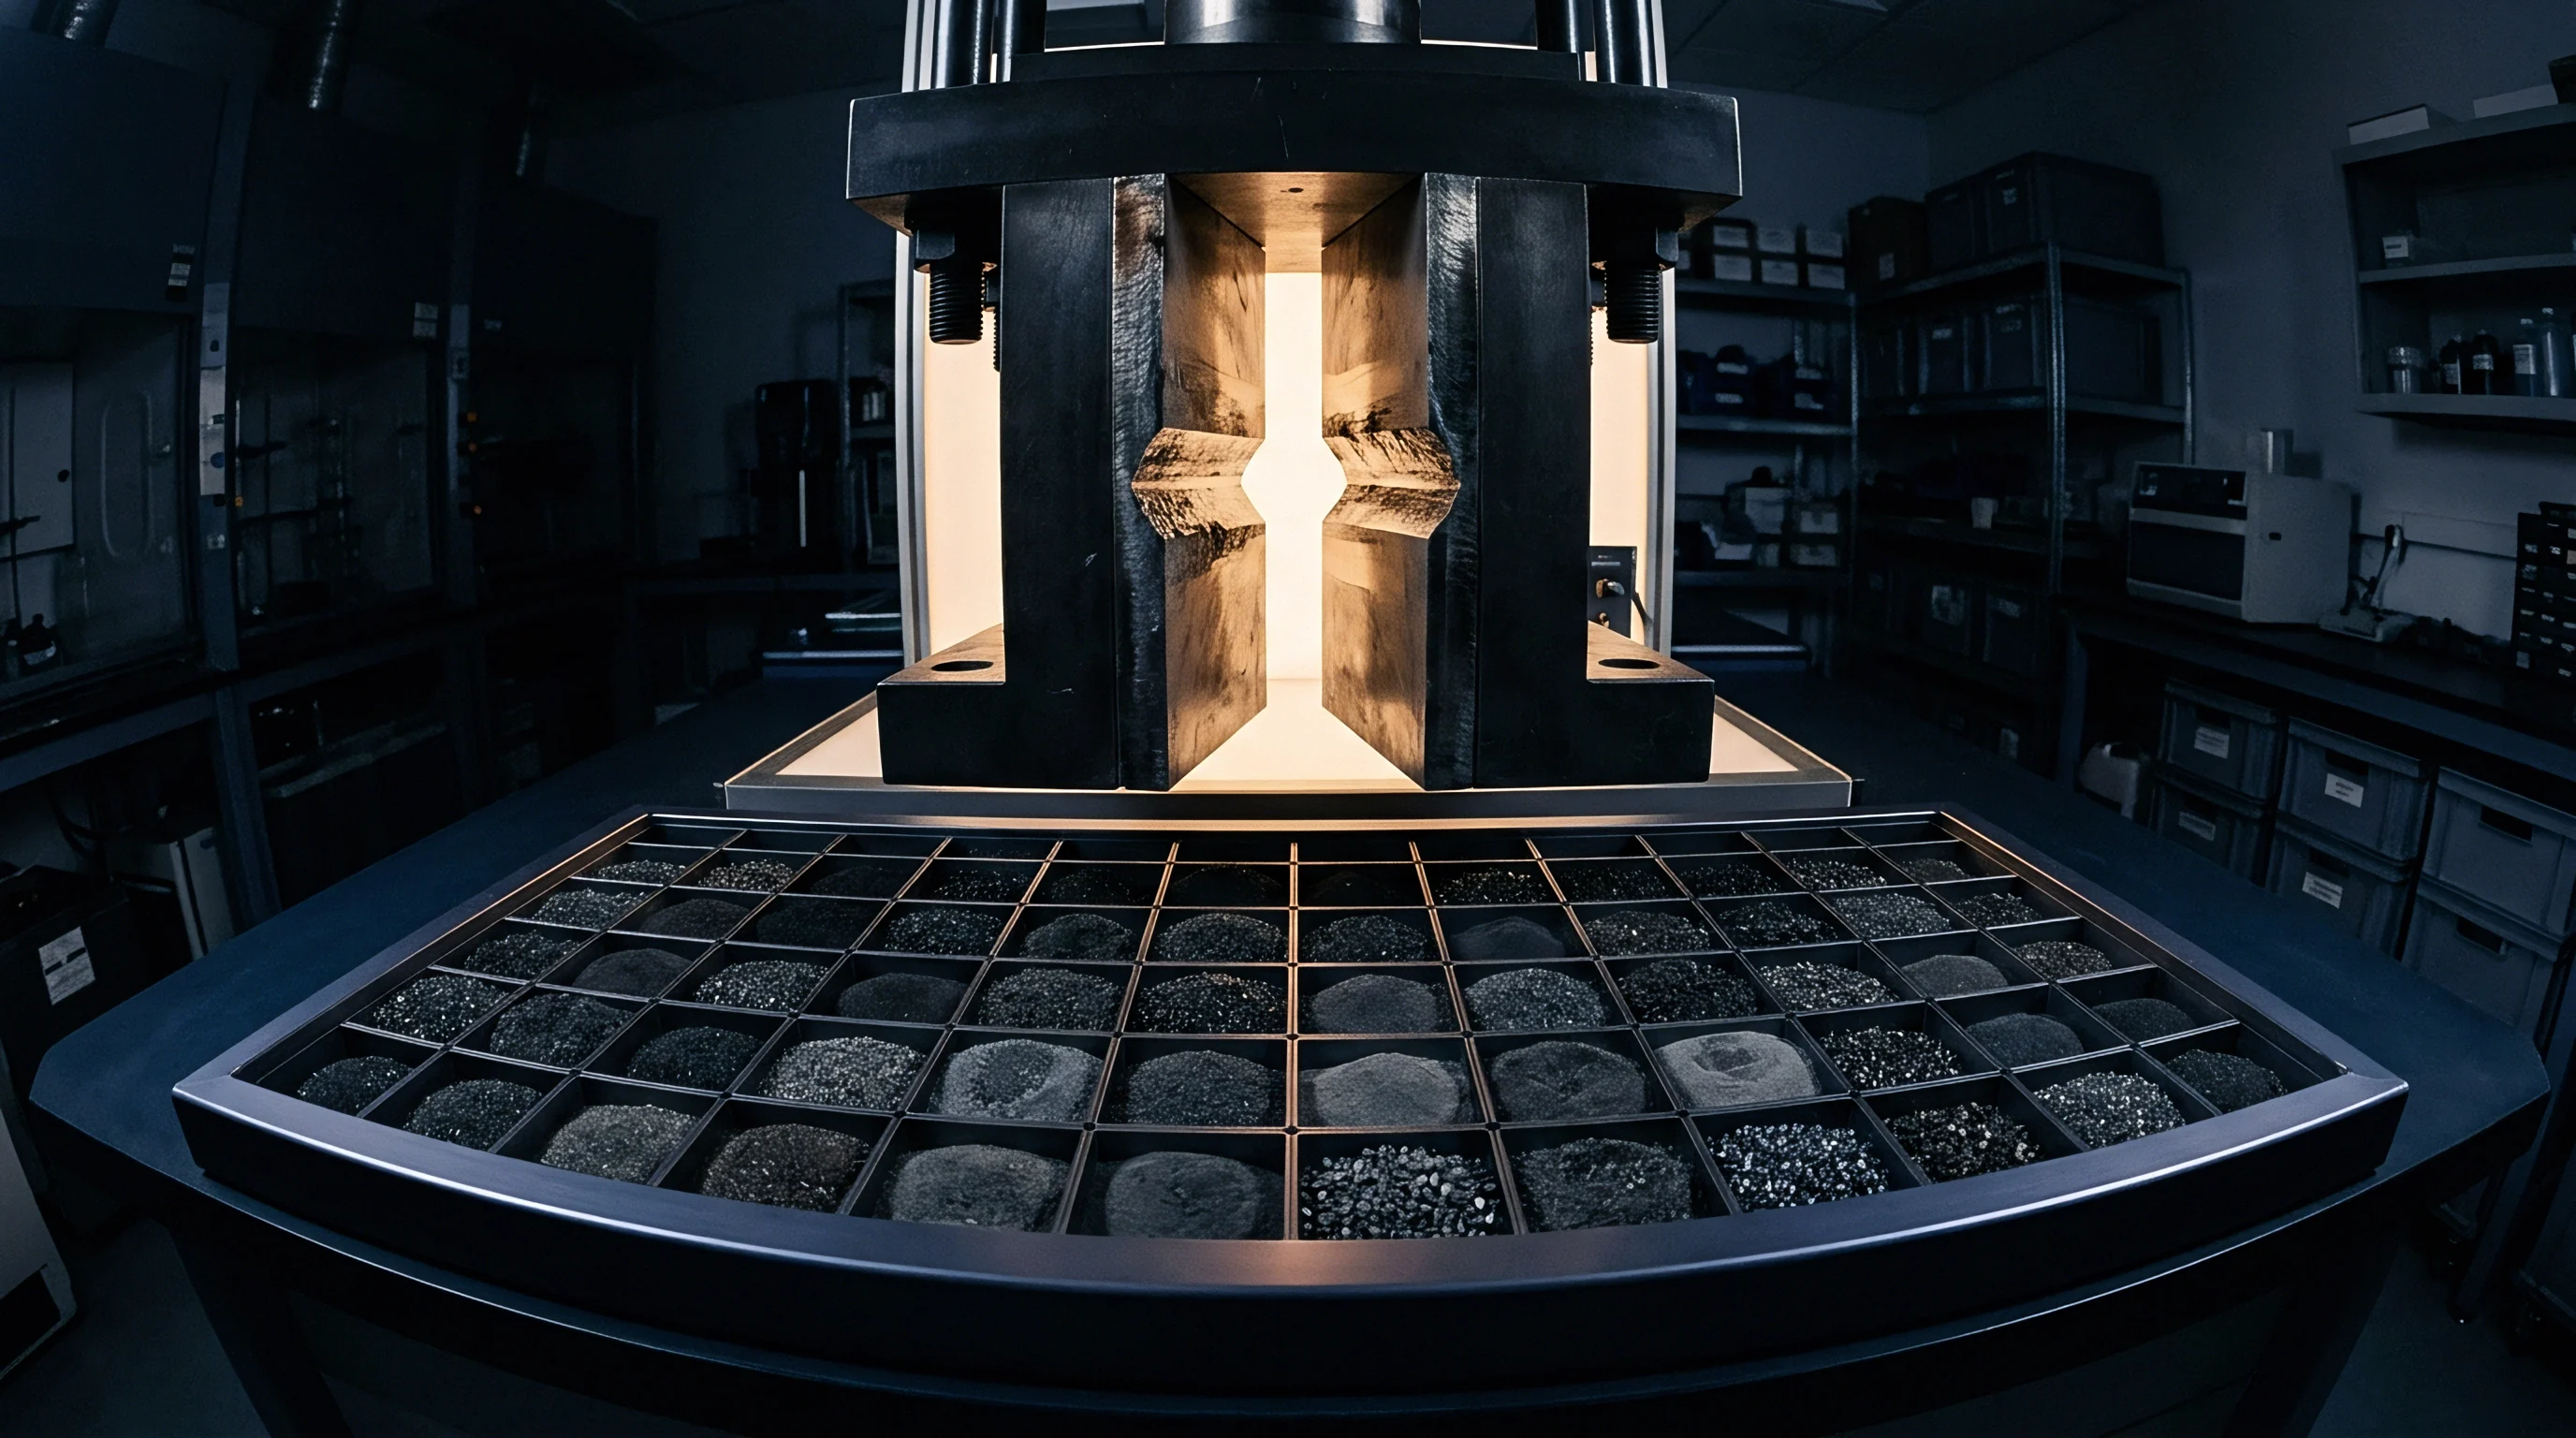
Standard rotational viscometers evaluate stress-strain curves through controlled stress ramps to identify breakdown points. Ramp testing applies an escalating force to a parallel-plate geometry while recording strain. The yield point manifests as the knee in the logarithmic stress-strain curve where elastic deformation shifts into steady viscous flow.
Vane geometries minimize wall slip during testing, providing truer measurements of bulk yield stress than smooth metal plates.
A static yield stress exceeding 350 Pa at 25 degrees Celsius prevents vertical slump on pouch cell side-plates during a forty-five minute open-time window prior to module insertion.
Creep and recovery experiments apply constant stress below the estimated yield point for ten minutes to measure delayed elastic deformation before releasing the stress. Materials with strong physical networks recover eighty to ninety percent of initial compliance. Insufficient elasticity leads to creep deformation when uncured modules move on assembly conveyors, shifting pre-dispensed material beads prior to final compression.
Whether ultra-high thermal conductivity gap fillers exceeding eight Watts per meter-Kelvin can maintain structural stability above sixty degrees Celsius without undergoing binder separation during extended vehicle operation remains an active field of study.

Displacement

Squeeze Flow Mechanics during Module Compression
Compressing wet paste during module seating requires low normal forces to protect pouch cell boundaries. When cell banks press down into wet gap filler pre-dispensed on an aluminum cold plate, the compound experiences planar squeeze flow. Module insertion speed dictates local shear rate across the fluid layer, which spikes as the gap narrows from several millimeters down to target bond line thickness.
The Stefan equation for planar squeeze flow, modified for power-law shear-thinning fluids, illustrates the steep rise in resistance force as gap height shrinks:
F = · n · · K
Here F represents compressive force in Newtons, R is plate radius in meters, h is instantaneous gap height in meters, and dh/dt denotes downward closing velocity in meters per second. The exponent on initial gap height h creates extreme non-linearity: reducing target bond line thickness by half increases compressive resistance force by a factor of four to eight depending on flow behavior index n.
| Compression Speed (mm/s) | Initial Gap (mm) | Target Gap (mm) | Viscous Shear Stress (kPa) | Peak Resistance Force (kN) | Footprint Area (m²) |
|---|---|---|---|---|---|
| 0.5 | 2.5 | 0.5 | 12.4 | 1.8 | 0.15 |
| 1.0 | 2.5 | 0.5 | 21.8 | 3.1 | 0.15 |
| 2.5 | 2.5 | 0.5 | 44.2 | 6.4 | 0.15 |
| 5.0 | 2.5 | 0.5 | 82.6 | 11.9 | 0.15 |
High-speed automation compresses modules in less than three seconds. Fast closure generates peak normal forces that threaten structural tolerances of thin-walled prismatic cell housings or pouch cell seals. While yield stress maintains structural height, slowing compression speed reduces resistance forces linearly at the expense of longer cycle times on high-volume production lines.

Wall Slip and Interfacial Boundary Conditions
Lubrication layers form near contact surfaces when concentrated particle suspensions undergo extreme shear gradients. Ceramic particles migrate away from high-shear boundaries near smooth metal walls, forming a thin, filler-depleted resin layer at the interface. This phenomenon ~ wall slip ~ alters bulk flow profiles from parabolic shear flow to plug-like translation.
Wall slip reduces effective compressive resistance during module installation, allowing faster gap closure under lower mechanical loads. Uncontrolled slip causes irregular material expulsion along module edges, generating uneven bead squeeze-out profiles as squeeze forces peak near completion. Surface roughness of cold plates directly influences slip magnitude: mill-finish aluminum promotes wall slip, while sandblasted or plasma-treated surfaces enforce a no-slip boundary condition that elevates peak normal forces during assembly.
- Interfacial void entrapment ~ Rapid compression cycles trap air pockets against rough module casings, creating localized thermal resistance bottlenecks that degrade heat transfer capacity.
- Cell wall deformation ~ Excessive normal forces during high-speed wet assembly exceed prismatic housing deflection thresholds, causing internal electrode misalignment or tab strain.
- Uneven bond line thickness ~ Non-uniform displacement forces drive material outward unevenly, leaving thin spots near center zones and excessive paste accumulations at module peripheries.
- Structural tie-rod overloading ~ Uncontrolled hydrostatic pressure during module insertion stretches mechanical retention bolts beyond designed pre-tension tolerances.
Contractual limits specifying module insertion force below two kilonewtons require rheological verification of squeeze flow stress at shear rates exceeding five hundred inverse seconds.
Incorrect management of compressive fluid dynamics creates cell housing deformation during automated closing, creating cell shorting hazards and scrap costs that exceed twelve percent of line throughput.


Pumping
Which Factors Accelerate Viscoelastic Stress Relaxation during Squeeze Flow?
Structural orientation inside polymer networks decays rapidly when high shear rates disrupt physical filler entanglements during pipe transfer. Automated dispensing systems route dual-component gap fillers from bulk drums through high-pressure delivery hoses, dosing valves, and static mixing nozzles. Shear rates inside supply lines scale inversely with tube radius, exceeding 5,000 s⁻¹ inside nozzle tips.
The volumetric pressure drop across smooth circular delivery lines for a non-Newtonian fluid follows the adapted Hagen-Poiseuille equation:
ΔP = (2 · L · K / R) · n
Where ΔP is pressure drop in Pascals, L is hose length in meters, R is inner hose radius in meters, and Q is volumetric flow rate in cubic meters per second. Smaller hose diameters dramatically elevate line backpressure, requiring heavy-duty progressive cavity pumps or hydraulic double-acting ram systems that raise equipment capital expense.
| Nozzle Diameter (mm) | Volumetric Rate (mL/s) | Wall Shear Rate (s⁻¹) | Pressure Gradient (bar/m) | Viscosity Decay (%) |
|---|---|---|---|---|
| 4.0 | 12.0 | 1,910 | 4.2 | 84.5 |
| 3.0 | 12.0 | 4,527 | 8.8 | 91.2 |
| 2.0 | 12.0 | 15,278 | 22.4 | 96.1 |
Pumping power requirements spike sharply when processing formulations filled with angular alumina aggregates due to particle interlocking near entrance orifices.

Automated Dispensing and Thixotropic Recovery Kinetics
Progressive cavity delivery systems force dense slurries through narrow nozzles at wall shear rates exceeding three thousand inverse seconds. High shear strips away particle-matrix interactions, drastically lowering operational viscosity. The compound exits the nozzle in a temporary low-viscosity state, allowing easy wetting of target substrates.
Post-dispense structural recovery obeys time-dependent thixotropic kinetics. The rebuild of elastic storage modulus (G’) following shear cessation governs material slump behavior. If viscosity recovery takes too long, pre-dispensed beads flatten, spread beyond placement tolerances, or drip off vertical surfaces.
If structural rebuild occurs too rapidly, the material resists wet-out when cells press into place three minutes later.
- Condition dual-component gap filler barrels at twenty-three degrees Celsius to stabilize baseline viscosity before connecting delivery lines.
- Purge feed lines at a controlled velocity until exit temperatures align within half a degree across dual supply channels.
- Calibrate progressive cavity dosing speed to synchronize nozzle output with robot tip velocity across cold plate channels.
- Measure post-dispense bead height across fifteen-minute increments to quantify thixotropic structural rebuild prior to cell placement.
Dispense line inner diameter selection determines wall shear rates and controls filler structure breakdown during high-speed automated application.
Transient delivery pressure spikes during cold startup stem from filler network agglomeration rather than chemical binder cross-linking.


Sedimentation

Hard Settling and Particle Network Breakdown
Gravitational forces drive heavy ceramic particles downward in low-viscosity liquid polymers during storage. High thermal conductivity gap fillers rely on dense ceramic media such as α-alumina, which possesses a specific gravity near 3.95 g/cm³, while silicone or polyether resin carriers possess densities near 0.98 g/cm³. This density differential generates a continuous downward settling force on suspended solids.
Settling velocity for dilute spherical particles follows modified Stokes’ Law:
v = /
In this equation, v denotes settling velocity in meters per second, ρp is particle density, ρf is fluid density, g is gravitational acceleration, r is particle radius, and η0 represents zero-shear matrix viscosity. In concentrated non-Newtonian suspensions, inter-particle interactions create a network yield stress τ0 that resists particle movement. Settling occurs only when net gravitational force per particle exceeds the local yield stress resistance across the particle surface area.
Phase separation creates an inhomogeneous compound where bottom regions in supply drums become dense and particle-packed, while top regions become resin-rich. Pumping resin-rich material degrades thermal conductivity, while pumping particle-dense sludge clogs metering valves and damages progressive cavity rotors.

Storage Rheology and Dynamic Yield Stress Retention
Extended warehouse shelf-life demands strong three-dimensional particle networks that withstand ambient vibration without collapsing. Transport vibration subjects drummed material to persistent low-frequency micro-strains; if micro-strain amplitudes exceed the linear viscoelastic limit (γc), the filler network degrades prematurely, lowering effective zero-shear viscosity and triggering hard settling.
- Static threshold verification ~ Retain low-shear zero-rate viscosity above two hundred Pascal-seconds to hold thirty-micron ceramic media in suspension during container transit.
- Continuous fluid loop design ~ Maintain continuous pipe movement at minimal shear rates to avoid localized particle packing in right-angle delivery joints.
- Temperature controlled holding ~ Preserve raw compound barrels between fifteen and twenty-five degrees Celsius to keep polymer matrix viscosity stable.
- Low-shear planetary agitation ~ Execute periodic slow paddle rotations before pump coupling when drum storage extends beyond thirty days.
Rheometer oscillation frequency sweeps track storage modulus (G’) against loss modulus (G”) across months of shelf storage. Stable gap fillers maintain G’ values significantly higher than G” across the entire storage temperature range, ensuring elastic structural behavior dominates viscous flow under static conditions.
- Viscoelastic frequency sweep records ~ Verification logs documenting storage modulus and loss modulus cross-over values across six strain frequency decades.
- Compression force response curves ~ Continuous load profiles recording peak resistance against gap height across three distinct assembly speeds.
- Thermal impedance test certificates ~ Measured thermal resistance metrics according to ASTM D5470 under applied pressures ranging from fifty to three hundred kilopascals.
- Thixotropic structure recovery curves ~ Time-series viscosity rebuild measurements following high-shear exposure in automated delivery tips.
Filler phase separation inside automated dispense pumps alters two-part mix ratios and compromises final thermal conductivity across the pack.
Automotive quality specifications requiring batch filler stability testing per ISO 3219 shift incoming compound rejection liability to chemical suppliers when static yield degradation exceeds fifteen percent after sixty storage days.


Impedance

Bond Line Thickness Optimization and Contact Resistance
Heat transfer across module interfaces depends directly on bond line thickness and surface contact quality. Conductive heat transfer through a planar gap filler layer follows Fourier’s Law:
q = / BLT
Here q represents heat flow rate in Watts, k is thermal conductivity in W/m·K, A is contact surface area in square meters, ΔT is temperature difference across the interface in Kelvin, and BLT signifies bond line thickness in meters. Total interface thermal resistance combines bulk thermal resistance and interfacial contact resistance:
Rtotal = + Rcontact,1 + Rcontact,2
Minimizing BLT directly reduces bulk thermal resistance. Non-Newtonian formulations must flow thin under moderate assembly clamping forces to achieve target bond line thicknesses down to 0.3 millimeters. Insufficient shear thinning forces engineers to increase clamp bolt torque, adding structural weight to pack frames to achieve desired heat transfer performance.
Contact resistance declines as applied pressure improves microscopic substrate contact. Non-Newtonian yield stress must collapse under assembly pressure to allow liquid resin and filler particles to fill microscopic surface asperities on raw extruded aluminum cold plates.

Viscoelastic Relaxation and In-Service Thermal Contact Stability
Polymeric gap fillers exhibit continuous stress dissipation after compression, altering mechanical reaction forces against module end plates. Once module compression completes and mechanical fasteners lock the pack geometry, the gap filler remains under constant strain displacement. The viscoelastic network begins stress relaxation, governed by a multi-mode Maxwell relaxation model:
E(t) = Σ Ei · exp(-t / τi)
Where E(t) represents relaxation modulus over time t, Ei represents mode elasticity, and τi represents characteristic relaxation time constants. Stress relaxation decreases reaction forces against cell walls by thirty to sixty percent over the first forty-eight hours post-assembly.
Excess stress relaxation combined with thermal cycling causes micro-void delamination if the gap filler shrinks or loses adhesion to cold plate surfaces. As cold plates expand during fast charging, non-Newtonian gap fillers must retain sufficient elasticity to flex with cell breathing during charge-discharge cycling without tearing or forming interfacial thermal air gaps.
Minimizing thermal resistance across module cold plates relies on selecting gap fillers whose shear-thinning response matches automated line speed while maintaining sufficient yield stress to prevent pump-induced void formation.