Standard Testing Schedules for Lithium Ion Battery Capacity Retention
Standard testing schedules isolate capacity retention by combining accelerated cycle and calendar aging with low-rate reference performance tests.


Schedules

Standardization Frameworks for Capacity Retention
Standard testing schedules isolate cell degradation rates through controlled electrical and thermal protocols. The international battery procurement environment relies on structured standards such as IEC 61960-3 for portable applications, IEC 62660-1 for electric traction, ISO 12405-4 for road vehicles, and the USABC electric vehicle battery test procedures. These schedules define specific current profiles, voltage limits, ambient temperatures, and rest periods to quantify net usable capacity over extended duty timelines.
Standard continuous cycling schedules evaluate capacity retention by repeatedly charging and discharging cells between specified cut-off voltages until usable capacity drops to a defined percentage of original nameplate capacity, typically 80 percent or 70 percent.
Test parameters directly dictate measured degradation curves. A standard cycle schedule typically applies a constant current charge at a rate of 0.5C or 1C until the upper cut-off voltage is reached, followed by a constant voltage step until current tapers to C/20. Discharge executes at a constant current rate, frequently set at 1C, down to the lower voltage threshold.
Thermal ambient controls are fixed strictly at 25 degrees Celsius for baseline comparison, or elevated to 45 degrees Celsius to accelerate kinetic degradation mechanisms. Deviations of as little as 2 degrees Celsius introduce measurable variances in solid electrolyte interphase film growth rates and lithium inventory consumption.
| Standard Designation | Charge Profile | Discharge Profile | Temperature Window | Termination Criteria |
|---|---|---|---|---|
| IEC 61960-3 | 0.2C CC-CV to 0.05C taper | 0.2C CC down to lower cut-off | 20°C ± 5°C | 500 cycles or 80% initial capacity |
| IEC 62660-1 | 1.0C CC-CV to 0.05C taper | 1.0C CC down to lower cut-off | 25°C ± 2°C / 45°C ± 2°C | 80% retention of nameplate capacity |
| ISO 12405-4 | Dynamic power profile per specification | Dynamic power profile per specification | 25°C ± 2°C | Contractual residual capacity limit |
| USABC Electric Vehicle Protocol | 1.0C CC-CV charging schedule | DST or FUDS dynamic discharge profiles | 30°C baseline (0°C to 52°C range) | 80% initial net delivered energy |
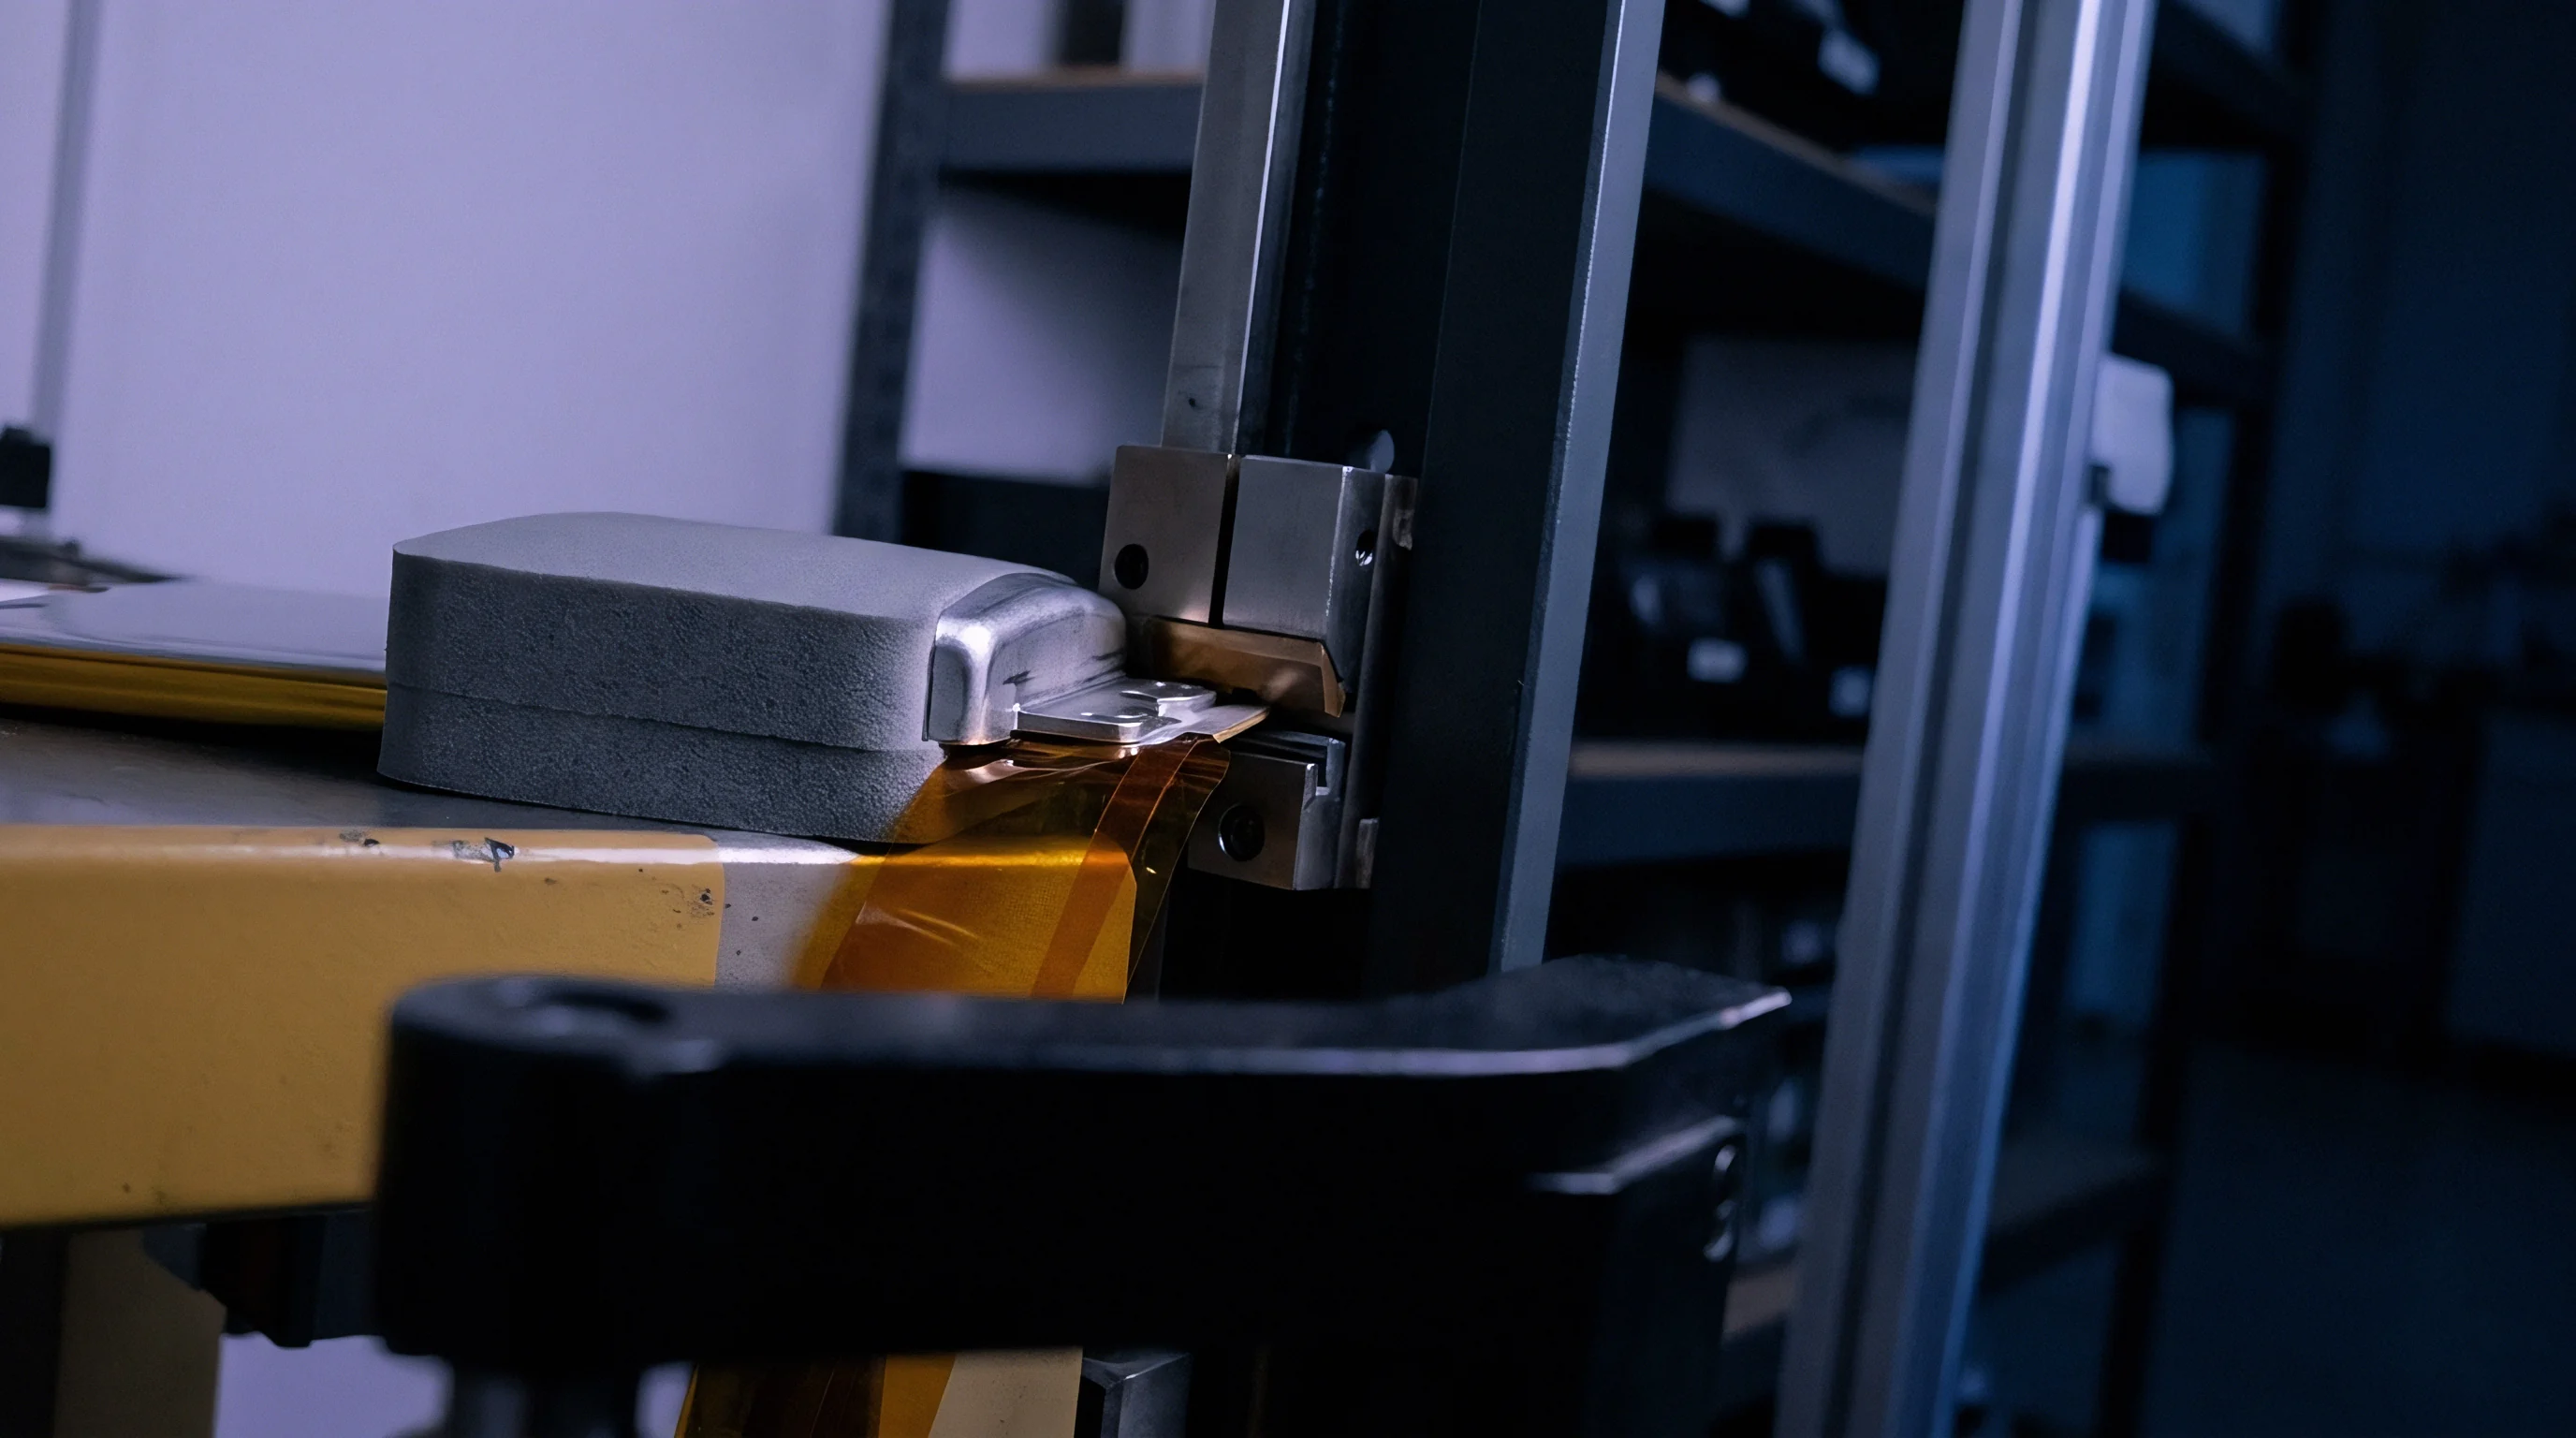
Continuous Cycling versus Calendar Aging Matrices
Capacity retention testing splits into two foundational regimes: cycle aging and calendar aging. Cycle aging regimes subject cells to continuous charge and discharge energy transfer, exposing active materials to repetitive volume changes, lattice strain, and mechanical microcracking. Calendar aging regimes isolate passive chemical degradation by storing fully or partially charged cells at static temperatures without current flow.
Storage test schedules mandate discrete state-of-charge checkpoints, commonly evaluating cells stored at 30 percent, 50 percent, 80 percent, and 100 percent state of charge across temperature environments ranging from 25 degrees Celsius to 60 degrees Celsius.
Capacity retention drops below 80 percent of initial nameplate C/5 rating after 1,200 continuous 1C/1C full-depth cycles at 25°C under IEC 61960-3 parameters.
Quantifying total capacity loss requires separating calendar aging losses from cycle-induced structural fatigue. During multi-year operational lifetimes, calendar aging accounts for substantial capacity fade, driven primarily by ongoing solvent reduction, transition metal dissolution, and electrolyte oxidation at the positive electrode interface. Qualification schedules that evaluate cycle life without parallel long-term static storage tracks fail to capture the true degradation trajectory of field-deployed assets.
The degree to which passive calendar decay accelerates under elevated operational temperatures during prolonged idle periods remains an open question in long-term capacity retention modeling.

Stress
Environmental and Operational Acceleration Drivers
Accelerated degradation protocols introduce heightened environmental and operational stress vectors to compress years of field exposure into weeks of laboratory channel time. Arrhenius relationships govern thermal acceleration, where elevating test ambient temperatures from 25 degrees Celsius to 45 degrees Celsius doubles the reaction kinetic rates of parasitic electrolyte breakdown. High-current charging introduces distinct degradation pathways by elevating local overpotentials.
When charging current rates push the negative electrode potential below 0 volts relative to the lithium reference potential, metallic lithium deposits onto the graphite anode structure rather than intercalating into carbon layers.
- Anode Lithium Plating occurs under high charge rates at low temperatures, consuming active lithium ions and creating dendritic structures that increase internal impedance and safety risks.
- Cathode Structural Degradation results from high upper cut-off voltages, inducing phase transitions, lattice parameter collapse, and microcracking within high-nickel layered oxide particles.
- Solid Electrolyte Interphase Thickening proceeds continuously through ongoing solvent reduction at the anode surface, depleting cyclable lithium and increasing charge-transfer resistance.
- Transition Metal Dissolution accelerates at elevated temperatures, releasing manganese, nickel, or cobalt ions into the electrolyte that migrate across the separator to poison the anode interphase.
State of Charge Windowing Effects
The depth of discharge and the operational state-of-charge range heavily influence cell retention trajectories. Shallow cycling schedules, such as cycling between 30 percent and 70 percent state of charge, preserve crystal lattice structures and mitigate mechanical stress within electrode materials compared to full-depth cycling between 0 percent and 100 percent state of charge. Standard schedules evaluate state-of-charge boundaries by running parallel test tracks at varying state-of-charge swings while maintaining constant cumulative energy throughput.
Storage at elevated states of charge accelerates solid electrolyte interphase growth faster than continuous low-rate cycling at moderate temperatures.
High average states of charge hold the cathode at elevated electrical potentials, destabilizing organic carbonate solvents and driving oxygen evolution from transition metal oxide lattices. Lower state-of-charge windows minimize phase transition stress within graphite anodes, where fully lithiated stages experience peak volume expansion. Operating within narrow, central state-of-charge limits suppresses mechanically driven interphase shedding, leaving chemical solvent reduction as the primary long-term capacity loss driver.

Intervals

Reference Performance Test Sequence Protocols
Intermittent evaluation of cell health requires periodic interruption of continuous cycling schedules to execute a Reference Performance Test sequence. This sequence provides standard baseline measurements under tightly controlled, low-stress conditions, allowing accurate tracking of residual capacity, internal resistance growth, and dynamic voltage response. Standard cycling schedules typically mandate a Reference Performance Test every 50 to 100 cycles, or every 30 days during static calendar aging schedules.
- Thermally equilibrate the cell inside a environmental chamber at 25 degrees Celsius for a minimum of 4 hours.
- Execute a full C/20 constant-current charge and discharge cycle to measure real quasi-equilibrium thermodynamic capacity without polarization losses.
- Perform a 1C constant-current charge followed by a constant-voltage taper to upper cut-off voltage to measure standard practical charge acceptance.
- Execute a Hybrid Pulse Power Characterization test sequence, applying 10-second high-current discharge and charge pulses at 10 percent state-of-charge increments to compute direct-current internal resistance.
- Re-establish the target state-of-charge setpoint before resuming accelerated cycling or calendar aging protocols.
Electrochemical Impedance Characterization Cadence
Electrochemical Impedance Spectroscopy integrates into reference performance schedules to deconstruct real-time impedance growth into specific physical transport steps. Measurements span a frequency spectrum from 10 kilohertz down to 10 millihertz at defined state-of-charge points. High-frequency intercepts yield pure ohmic electrolyte resistance.
High-to-mid-frequency semicircles map migration resistance through the solid electrolyte interphase film, while mid-to-low-frequency arcs track charge-transfer resistance across the electrode interface.
| Test Type | Execution Frequency | Operational Rate | Temperature | Primary Target Metric |
|---|---|---|---|---|
| Quasi-Equilibrium Capacity | Every 100 cycles / 30 days | 0.05C (C/20) CC-CV | 25°C ± 1°C | True thermodynamic lithium inventory loss |
| Standard Rated Capacity | Every 50 cycles / 14 days | 1.0C CC / 0.5C CC | 25°C ± 1°C | Usable discharge energy retention |
| Pulse Resistance (HPPC) | Every 100 cycles / 30 days | 2C to 5C 10s pulses | 25°C ± 1°C | Ohmic and charge-transfer resistance growth |
| Impedance Spectroscopy | Every 250 cycles / 60 days | 10 kHz to 10 mHz excitation | 25°C ± 0.5°C | Interphase film resistance evolution |
Interruption of active thermal regulation during baseline reference testing invalidates the entire cycle degradation sequence under standard IEC 62660 qualification guidelines.
Tracking impedance growth alongside absolute discharge capacity reveals whether capacity retention loss stems from loss of cyclable lithium or active material isolation. An increasing charge-transfer resistance coupled with stable low-rate C/20 capacity points to kinetic polarization losses rather than structural destruction of the electrode host materials. Failing to maintain precise thermal equilibration setpoints during reference performance testing distorts internal resistance measurements, invalidating multi-month testing campaigns and destroying batch traceability across qualification cohorts.

Discrepancy
Do Accelerated Storage Protocols Predict Dynamic Cycle Aging?
Datasheet capacity retention metrics published by manufacturers frequently employ optimized, single-variable test schedules designed to flatter cell longevity specifications. Standard datasheets typically report cycle life under moderate 0.5C/0.5C rates at 25 degrees Celsius within a restricted voltage window, omitting the combined degradation effects of rapid charging, high operating temperatures, dynamic dynamic load profiles, and prolonged elevated state-of-charge storage. Field applications subject cells to complex, overlapping stress profiles that accelerate capacity fade far beyond static laboratory projections.
Consider a practical comparison between a 21700 high-nickel NMC811 cylindrical cell and a lithium iron phosphate (LFP) prismatic cell evaluated under standard datasheet parameters versus an aggressive real-world procurement specification. The NMC811 cell features a nominal capacity of 5.0 Ah, while the LFP cell carries a nominal capacity of 100 Ah. The datasheet schedule mandates continuous 0.5C cycling at 25 degrees Celsius, while the target procurement schedule requires 1.5C fast charging, dynamic pulse discharging, and intermittent storage at 45 degrees Celsius and 100 percent state of charge.
Assumptions for the NMC811 cell under standard parameters yield a loss rate of 0.015 percent capacity per cycle, reaching the 80 percent retention threshold at cycle 1,333. Under the aggressive procurement schedule, accelerated solid electrolyte interphase growth, particle cracking from lattice distortion, and high-temperature calendar aging elevate the loss rate to 0.048 percent capacity per cycle. This structural stress shifts the 80 percent retention limit to cycle 416, representing a 68.8 percent reduction in operational cycle life relative to standard datasheet claims.
Assumptions for the 100 Ah LFP cell under standard 0.5C cycling at 25 degrees Celsius reflect high structural stability, exhibiting a fade rate of 0.005 percent per cycle to reach 80 percent retention at 4,000 cycles. When subjected to the elevated 45 degrees Celsius storage and fast-charge schedule, iron dissolution kinetics and accelerated electrolyte solvent reduction increase the capacity fade rate to 0.018 percent per cycle. Residual capacity reaches 80 percent at cycle 1,111, representing a 72.2 percent drop from baseline parameters.
This structural variation demonstrates that high-temperature calendar degradation alters LFP performance retention even more severely than it impacts baseline NMC811 expectations under multi-stress conditions.
Commercial datasheets routinely isolate single-stress variables while concealing multi-stress synergistic degradation rates.
Mathematical modeling of degradation acceleration relies on damage accumulation matrices that combine empirical cycle aging equations with modified Arrhenius temperature factors. The total capacity fade Qloss is expressed through a multi-factor degradation function:
Qloss = A · expleft(-fracEaR · Tright) · tz + B · (Ah)z2
Where A and B represent pre-exponential chemical factor constants, Ea is the activation energy for interphase growth in Joules per mole, R is the universal gas constant, T is absolute temperature in Kelvin, t is calendar storage time, Ah is cumulative energy throughput in Ampere-hours, and z and z2 are power-law time exponents typically valued between 0.5 and 0.8. When battery suppliers present testing dossier results, their engineers routinely state that high-temperature accelerated retention results represent conservative bounds, arguing that laboratory heat stress induces parasitic reaction kinetics that do not occur during lower-temperature operational duty cycles.

Guarantees
Structural Capacity Degradation Warranties
Translating capacity retention data into enforceable commercial supply agreements requires precise definition of testing schedules within cell procurement contracts. Standard capacity guarantees state residual capacity limits after a fixed period of time or cumulative throughput, but such claims are legally meaningless without explicit specification of the reference test protocol used to measure compliance. Contractual schedules must define the exact charge rate, discharge rate, thermal ambient, and voltage limits applied during validation audits.
- Reference Method Definition stipulates the exact standard protocol, such as IEC 62660-1, used to arbitrate compliance during incoming lot acceptance or warranty disputes.
- Environmental Test Boundaries set the permissible ambient temperature range, relative humidity, and cell mounting orientations during verification testing.
- Measurement Equipment Tolerance specifies calibrated instrument accuracy limits, ensuring voltage measurement errors remain under 1 millivolt and current errors under 0.05 percent.
- Throughput Accounting Rules define how battery management system energy registers count cumulative Ampere-hour throughput versus dynamic cycle metrics.

Verification Clauses in Cell Procurement Contracts
Commercial contracts define clear procedures for resolving capacity degradation claims when field-returned cells fall below warranted performance curves. Qualification clauses require third-party laboratory verification using pre-agreed reference performance test schedules. If an audited batch delivers residual capacity below the contractual limit under baseline testing conditions, remedies include full batch replacement, credit adjustments based on lost energy throughput, or extended warranty coverage on subsequent cell shipments.
| Contractual Parameter | Permissible Specification Band | Verification Standard | Commercial Penalty Threshold |
|---|---|---|---|
| Baseline Initial Capacity | 100% to 103% of nominal rating | IEC 61960-3 C/5 charge-discharge | Immediate lot rejection if <100% |
| Cycle Capacity Fade Rate | <0.025% per effective full cycle | 1.0C CC-CV at 25°C ± 2°C | Pro-rata financial reimbursement |
| Internal Resistance Increase | <30% growth over 1,000 cycles | 10-second 2C pulse at 50% SOC | Warranty extension required |
| Calendar Degradation Ceiling | <2.5% capacity loss per year | Stored at 50% SOC, 25°C ambient | Credit adjustment per lost kWh |
Legal enforceability hinges on strict adherence to defined physical and electrical verification sequences. The supply contract specifies that capacity retention verification tests execute according to IEC 62660-1 parameters, performing a C/5 discharge at 25 degrees Celsius after a 4-hour thermal soak, which directly governs whether an incoming cell lot meets structural capacity guarantees or incurs financial remedies.