Automated Inline Phased Array Calibration for Battery Module Bond Lines
Automated inline phased array calibration compensates for sound velocity drift in curing battery adhesives to preserve defect sizing accuracy down to half a millimeter.
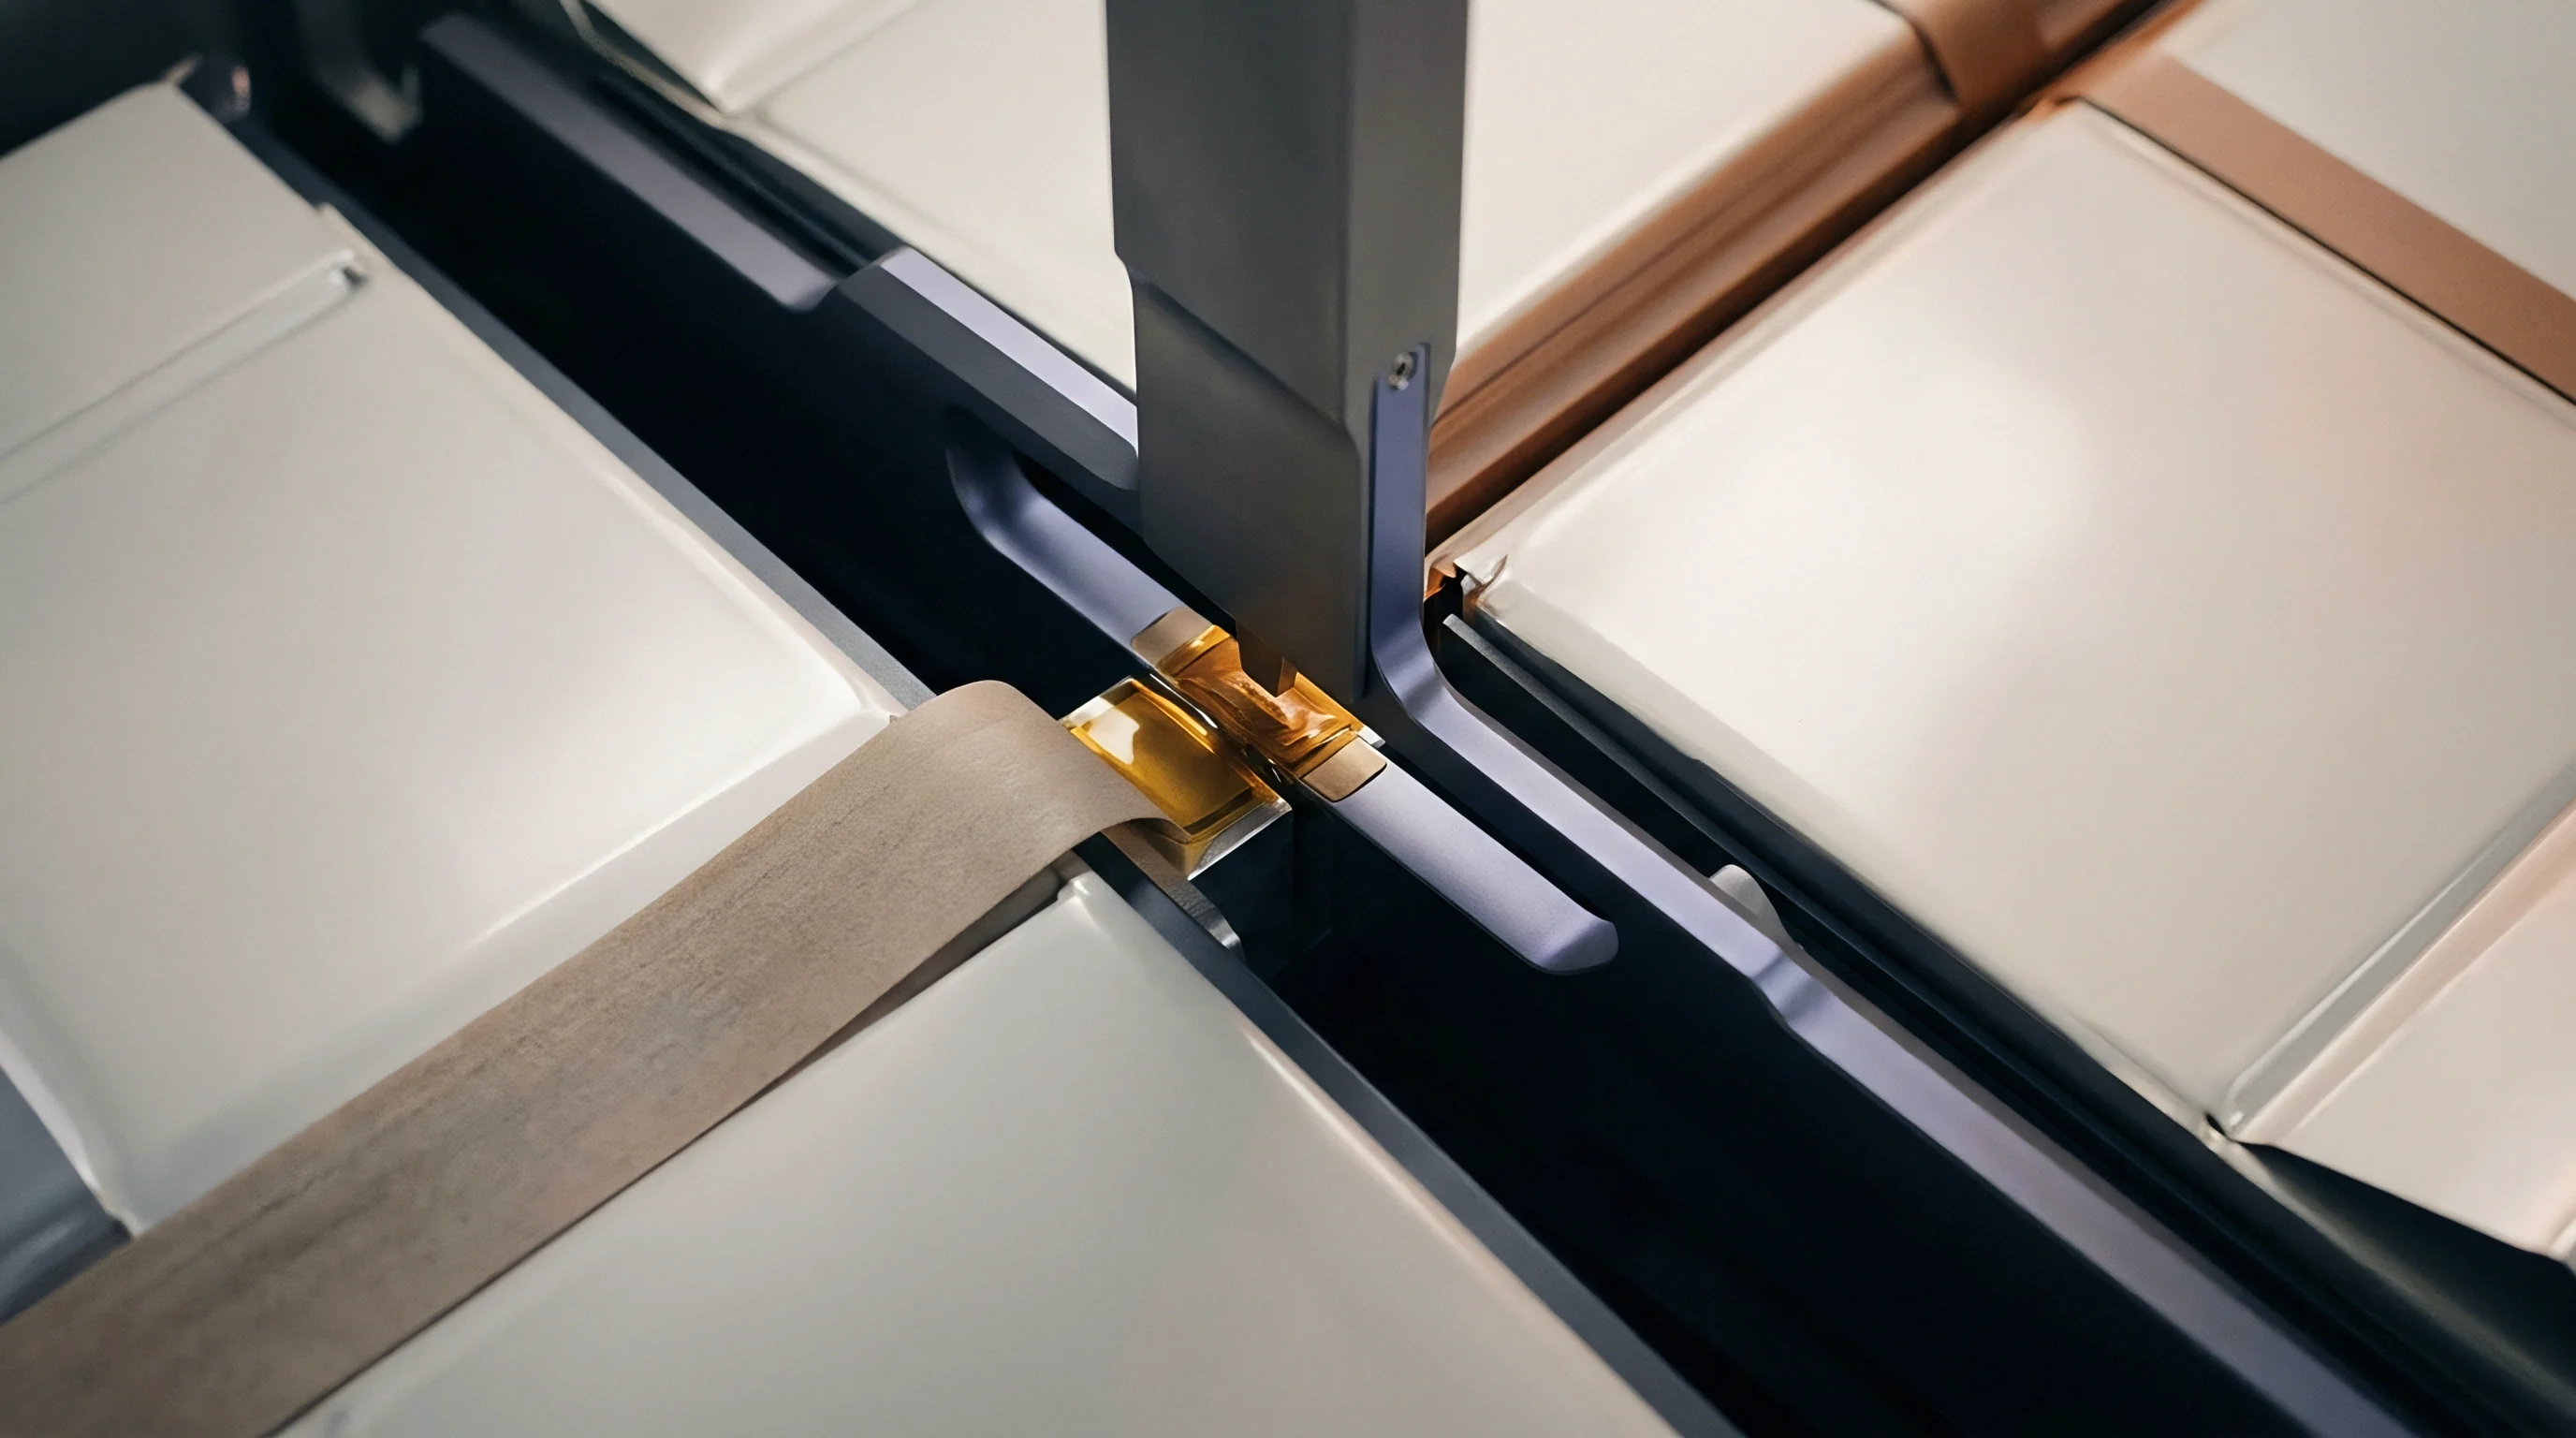
Wedge
Acoustic Coupling Mechanics at High Line Speeds
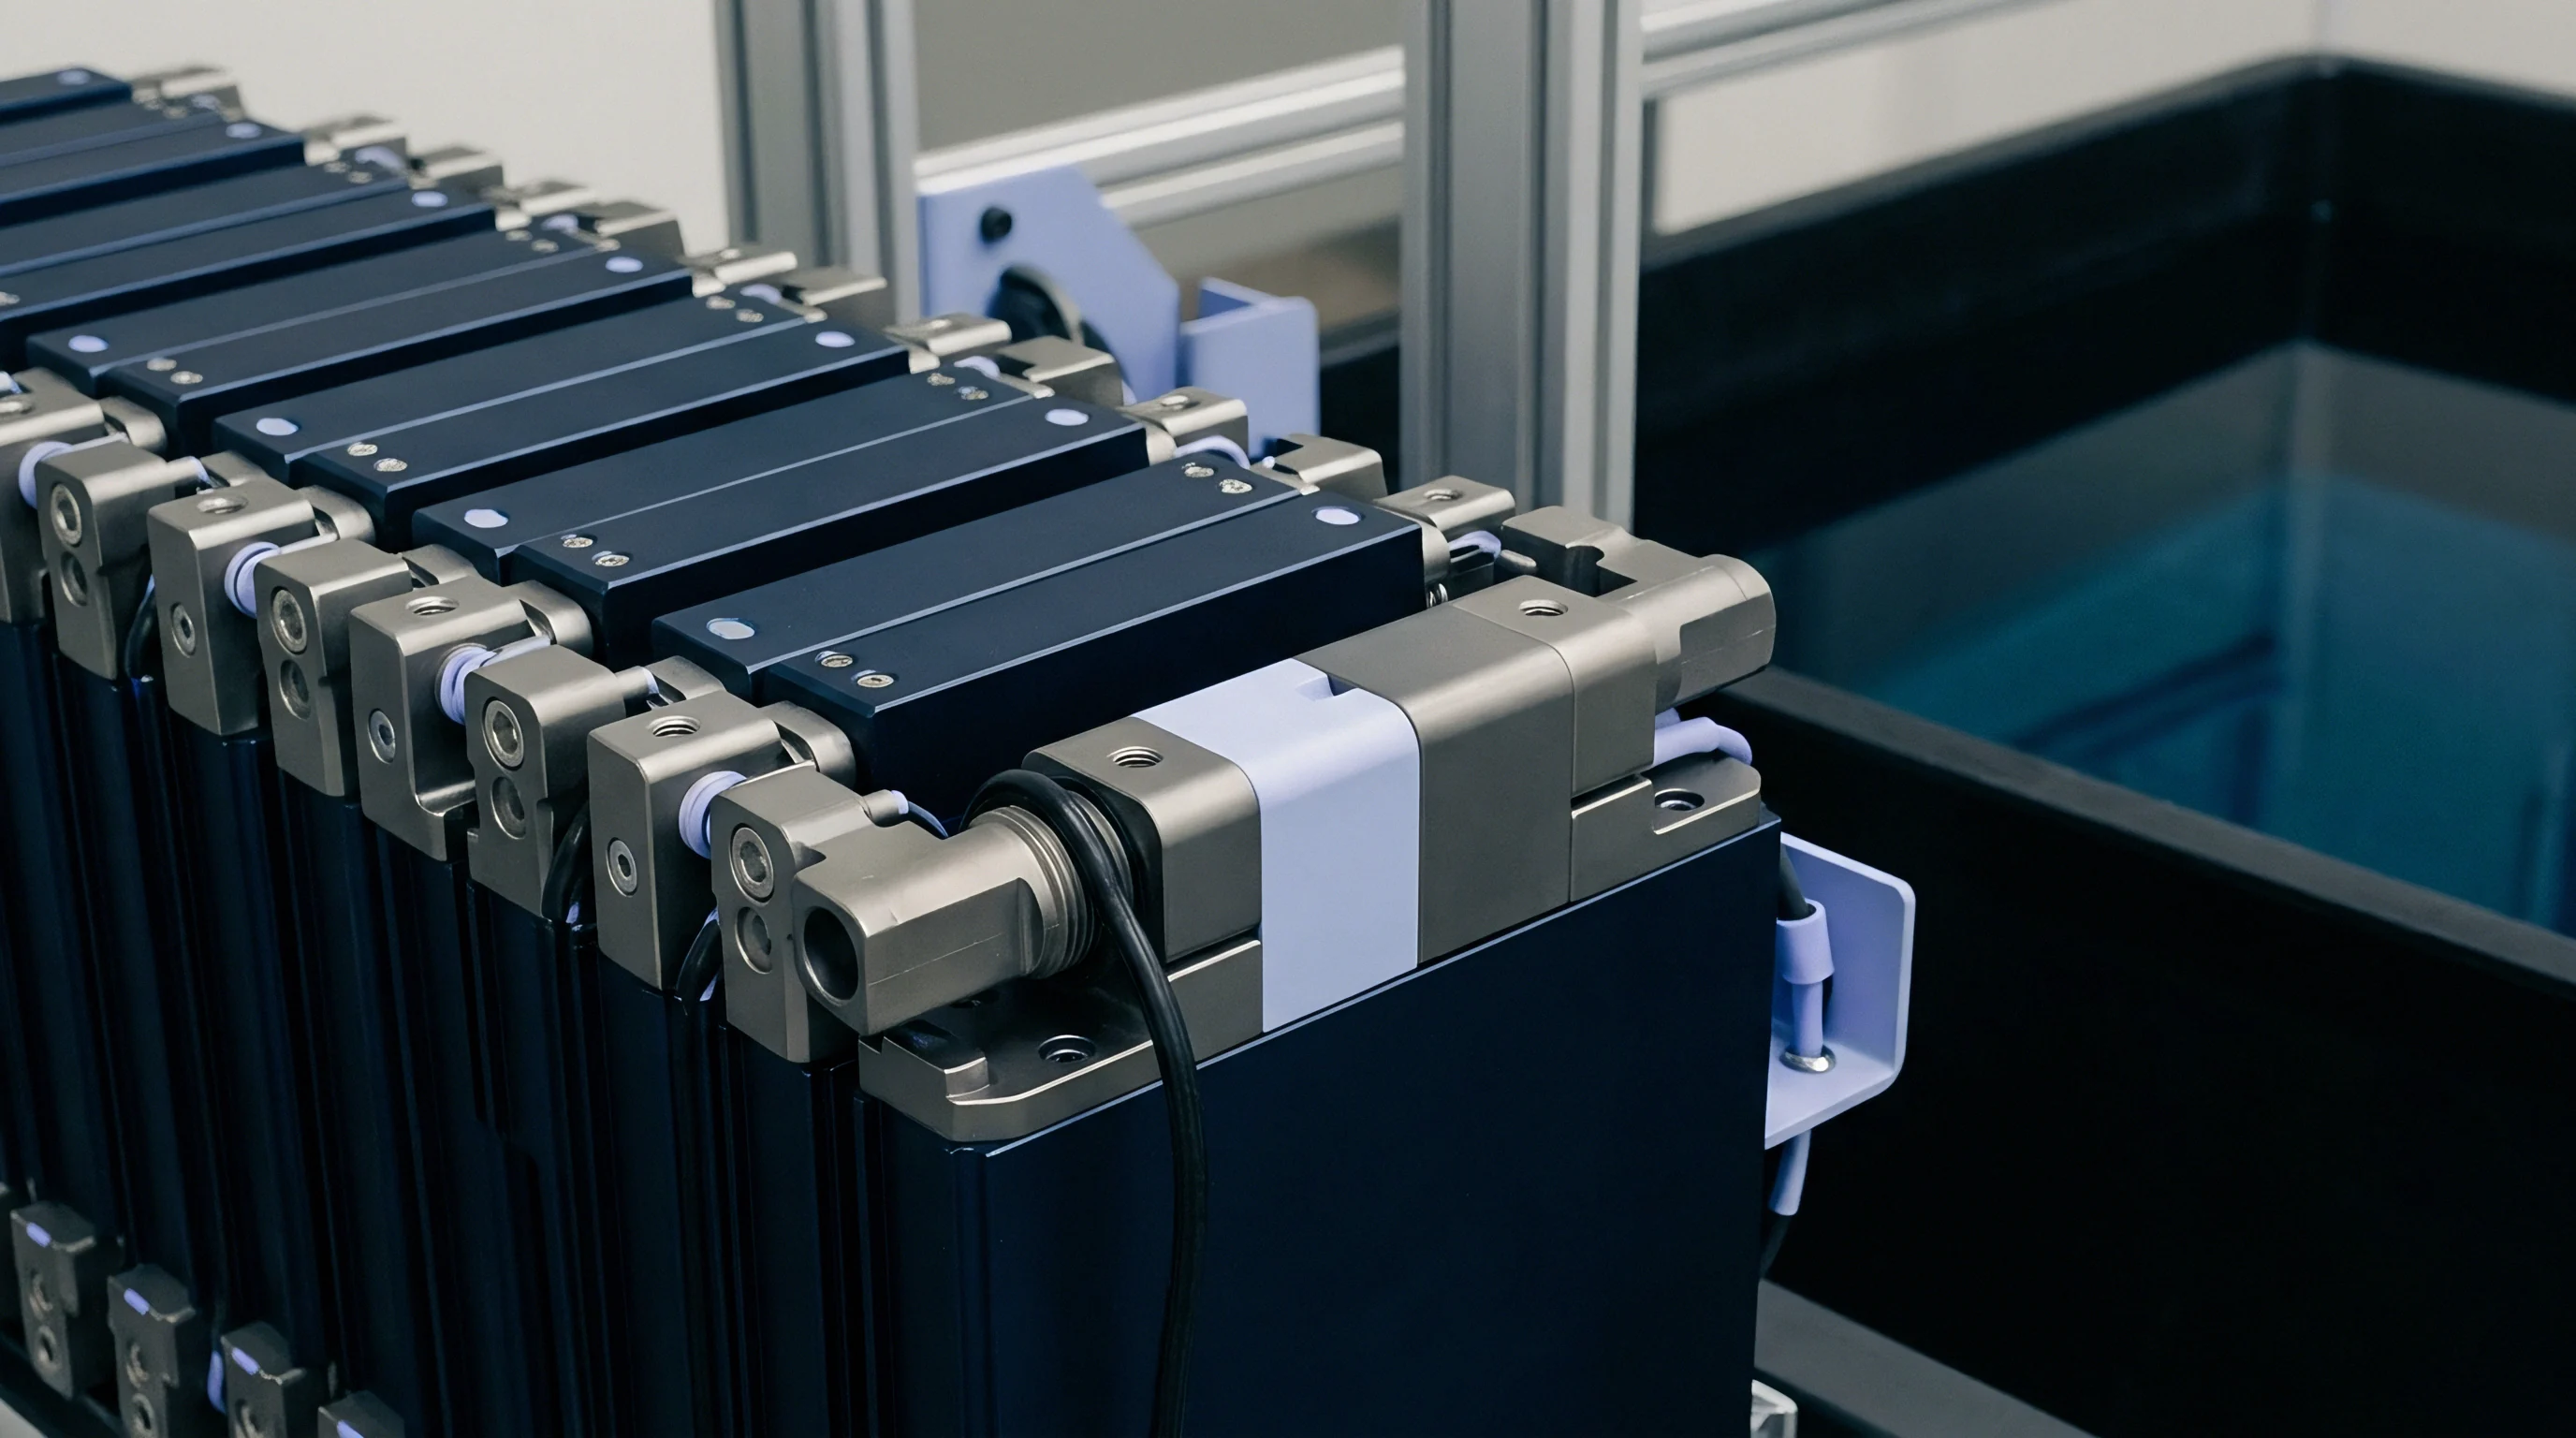
Ultrasonic inspection of structural bond lines beneath battery module side plates relies on acoustic energy crossing from an emitter element through an angled shoe into the module casing. Water-jet squirt systems maintain a continuous fluid column of 1.5 mm thickness between the high-density polyethylene contact face and the aluminum housing plate. Micro-bubbles entrapped in recirculating coupling fluid attenuate high-frequency shear waves, reducing signal amplitude by up to 8.2 dB at 10 MHz.
Inline degassing units featuring hydrophobic hollow-fiber membranes strip dissolved gas below 2.0 parts per million to keep the sound transmission co-efficient stable across eight-hour shifts.
Dry-coupling elastomer shoes eliminate fluid handling on battery assembly lines. A synthetic polyurethane membrane rated at Shore A hardness of 65 exhibits an acoustic impedance of 1.68 MegaRayls, closely matching the 1.50 MegaRayls of un-cured polyurethane thermal adhesive. Holding contact pressure at 0.35 MPa suppresses surface air gaps, with pneumatic clamps driving the high-density shoe against the housing plate within 120 milliseconds of cell positioning.
Over time, interface wear alters the internal acoustic path length by 0.04 mm per thousand scan cycles, skewing beam refraction angles by 0.3 degrees and shifting the focus depth inside the bond line.
Water-jet squirt systems maintain a continuous fluid column of 1.5 mm thickness between the high-density polyethylene contact face and the aluminum housing plate.
Surface roughness on extruded aluminum housing plates causes scatter before the acoustic wave reaches the adhesive. Profile variations exceeding 12.5 micrometers Ra drop the return echo amplitude from the top adhesive boundary. High-resolution encoder indexing synchronizes beam firing with linear position along the module length at speeds up to 150 millimeters per second, while micro-positioning stages compensate for housing tolerance stack-ups up to 0.50 mm using laser displacement sensors mounted 50 mm ahead of the array.
When Does Sound Velocity Drift Induce Bond Defect Misclassification?
Exothermic curing inside two-part polyurethane structural adhesives shifts longitudinal sound velocity from 1420 meters per second in the liquid phase to 2150 meters per second when fully cross-linked. As cross-linking progresses over a twenty-minute window, refraction at the aluminum-adhesive interface follows Snell’s Law, shifting the beam angle from 32.4 degrees to 53.1 degrees. If the instrument focal law remains locked to the liquid-phase velocity, calculated echo return depth drifts upward ~ misplacing a void defect inside the aluminum casing wall rather than the bond line.
Automated calibration routines handle these velocity shifts by pulsing reference echoes off the aluminum back wall every five module passes.
Temperature shifts across the plant floor complicate velocity tracking. Ambient swings of 8 degrees Celsius alter longitudinal sound velocity in the delay material by 2.4 meters per second per degree, shifting the beam entry position by 0.18 mm per degree Celsius if left uncompensated. Standard practice places an NTC thermistor inside the acrylic block 1.0 mm behind the array face.
Inline software then recalculates delay times across all active channels whenever the block temperature shifts by more than 0.5 degrees Celsius.
Integrating calibration blocks into the conveyor transfer rail allows automated reference updates without stopping the line. Steel blocks with wire-EDM flat-bottom holes of 0.5 mm and 1.0 mm diameter sit between indexing stations, swept by the array head during its return stroke between module cycles. Peak echo amplitudes and flight times feed back into the beamformer firmware within 40 milliseconds, updating channel gain amplifiers and delay arrays before the next module enters the station.
Whether automated acoustic shoe replacement cycles can run without manual beam profile re-verification remains an open question on high-takt module lines.
Velocity
Temperature Variance and Curing Dynamics
Polyurethane structural adhesives undergo rapid changes in bulk modulus and density as they cross-link. Fast-curing formulations gel within 90 seconds of dispensing into the module tray, driving sound velocity up from 1450 meters per second to 1980 meters per second before it plateaus at 2200 meters per second at full cure. Tracking acoustic velocity through the adhesive layer reveals cross-linking progress in real time without destructive testing.
Array electronics calculate instantaneous velocity by measuring time-of-flight between the top aluminum-to-adhesive reflection and the bottom adhesive-to-cell-can reflection.
Thermal variations along the adhesive track alter acoustic attenuation co-efficients as well as sound velocity. At 20 degrees Celsius, un-cured epoxy paste attenuates a 7.5 MHz wave at 4.2 dB per millimeter, but at 45 degrees Celsius, lower viscous damping drops attenuation to 2.8 dB per millimeter. Evaluation thresholds must adapt to local temperature readings so the system does not misidentify fully dense, low-attenuation cured resin as an unbonded region.
| Adhesive Polymer Base | Cure State | Density (kg/m³) | Longitudinal Velocity (m/s) | Acoustic Impedance (MRayl) | Attenuation at 5 MHz (dB/mm) |
|---|---|---|---|---|---|
| Two-Part Polyurethane | Dispensed (0 min) | 1450 | 1420 | 2.06 | 5.8 |
| Two-Part Polyurethane | Gelation (3 min) | 1470 | 1850 | 2.72 | 4.1 |
| Two-Part Polyurethane | Full Cure (60 min) | 1510 | 2180 | 3.29 | 2.3 |
| Thermal Epoxy Paste | Dispensed (0 min) | 2200 | 1650 | 3.63 | 6.4 |
| Thermal Epoxy Paste | Full Cure (30 min) | 2280 | 2450 | 5.59 | 1.9 |
| Silicone Gap Filler | Un-cured (0 min) | 2600 | 1050 | 2.73 | 8.5 |
| Silicone Gap Filler | Fully Cured (24 hr) | 2650 | 1120 | 2.97 | 7.9 |
Acoustic reflection co-efficients at material interfaces dictate signal amplitude returning to the array elements. The reflection co-efficient R at the boundary between aluminum casing material and structural adhesive depends on the acoustic impedance mismatch:
R = fracZ2 – Z1Z2 + Z1
Aluminum carries an acoustic impedance Z1 of 17.0 MegaRayls, while un-cured polyurethane adhesive sits at a Z2 of 2.06 MegaRayls, yielding a reflection co-efficient of -0.78. Once fully cured, polyurethane impedance reaches 3.29 MegaRayls, moving the reflection co-efficient to -0.67 ~ a 1.3 dB reduction in interface echo power. Calibration software tracks this shift to keep void detection thresholds accurate throughout the cure window.
Acoustic velocity monitoring depends heavily on sync timing with the dispense station. A two-minute drift in transport time between the dispense cell and the ultrasonic test cell shifts baseline adhesive velocity by up to 180 meters per second. Automated systems pull the exact dispense timestamp for each serial number from the manufacturing execution system, allowing calibration software to update its acoustic model for elapsed cure time before firing beam vectors into the side wall.
Velocity changes during curing follow a predictable curve, allowing line algorithms to infer cross-linking completion from acoustic delay measurements alone.
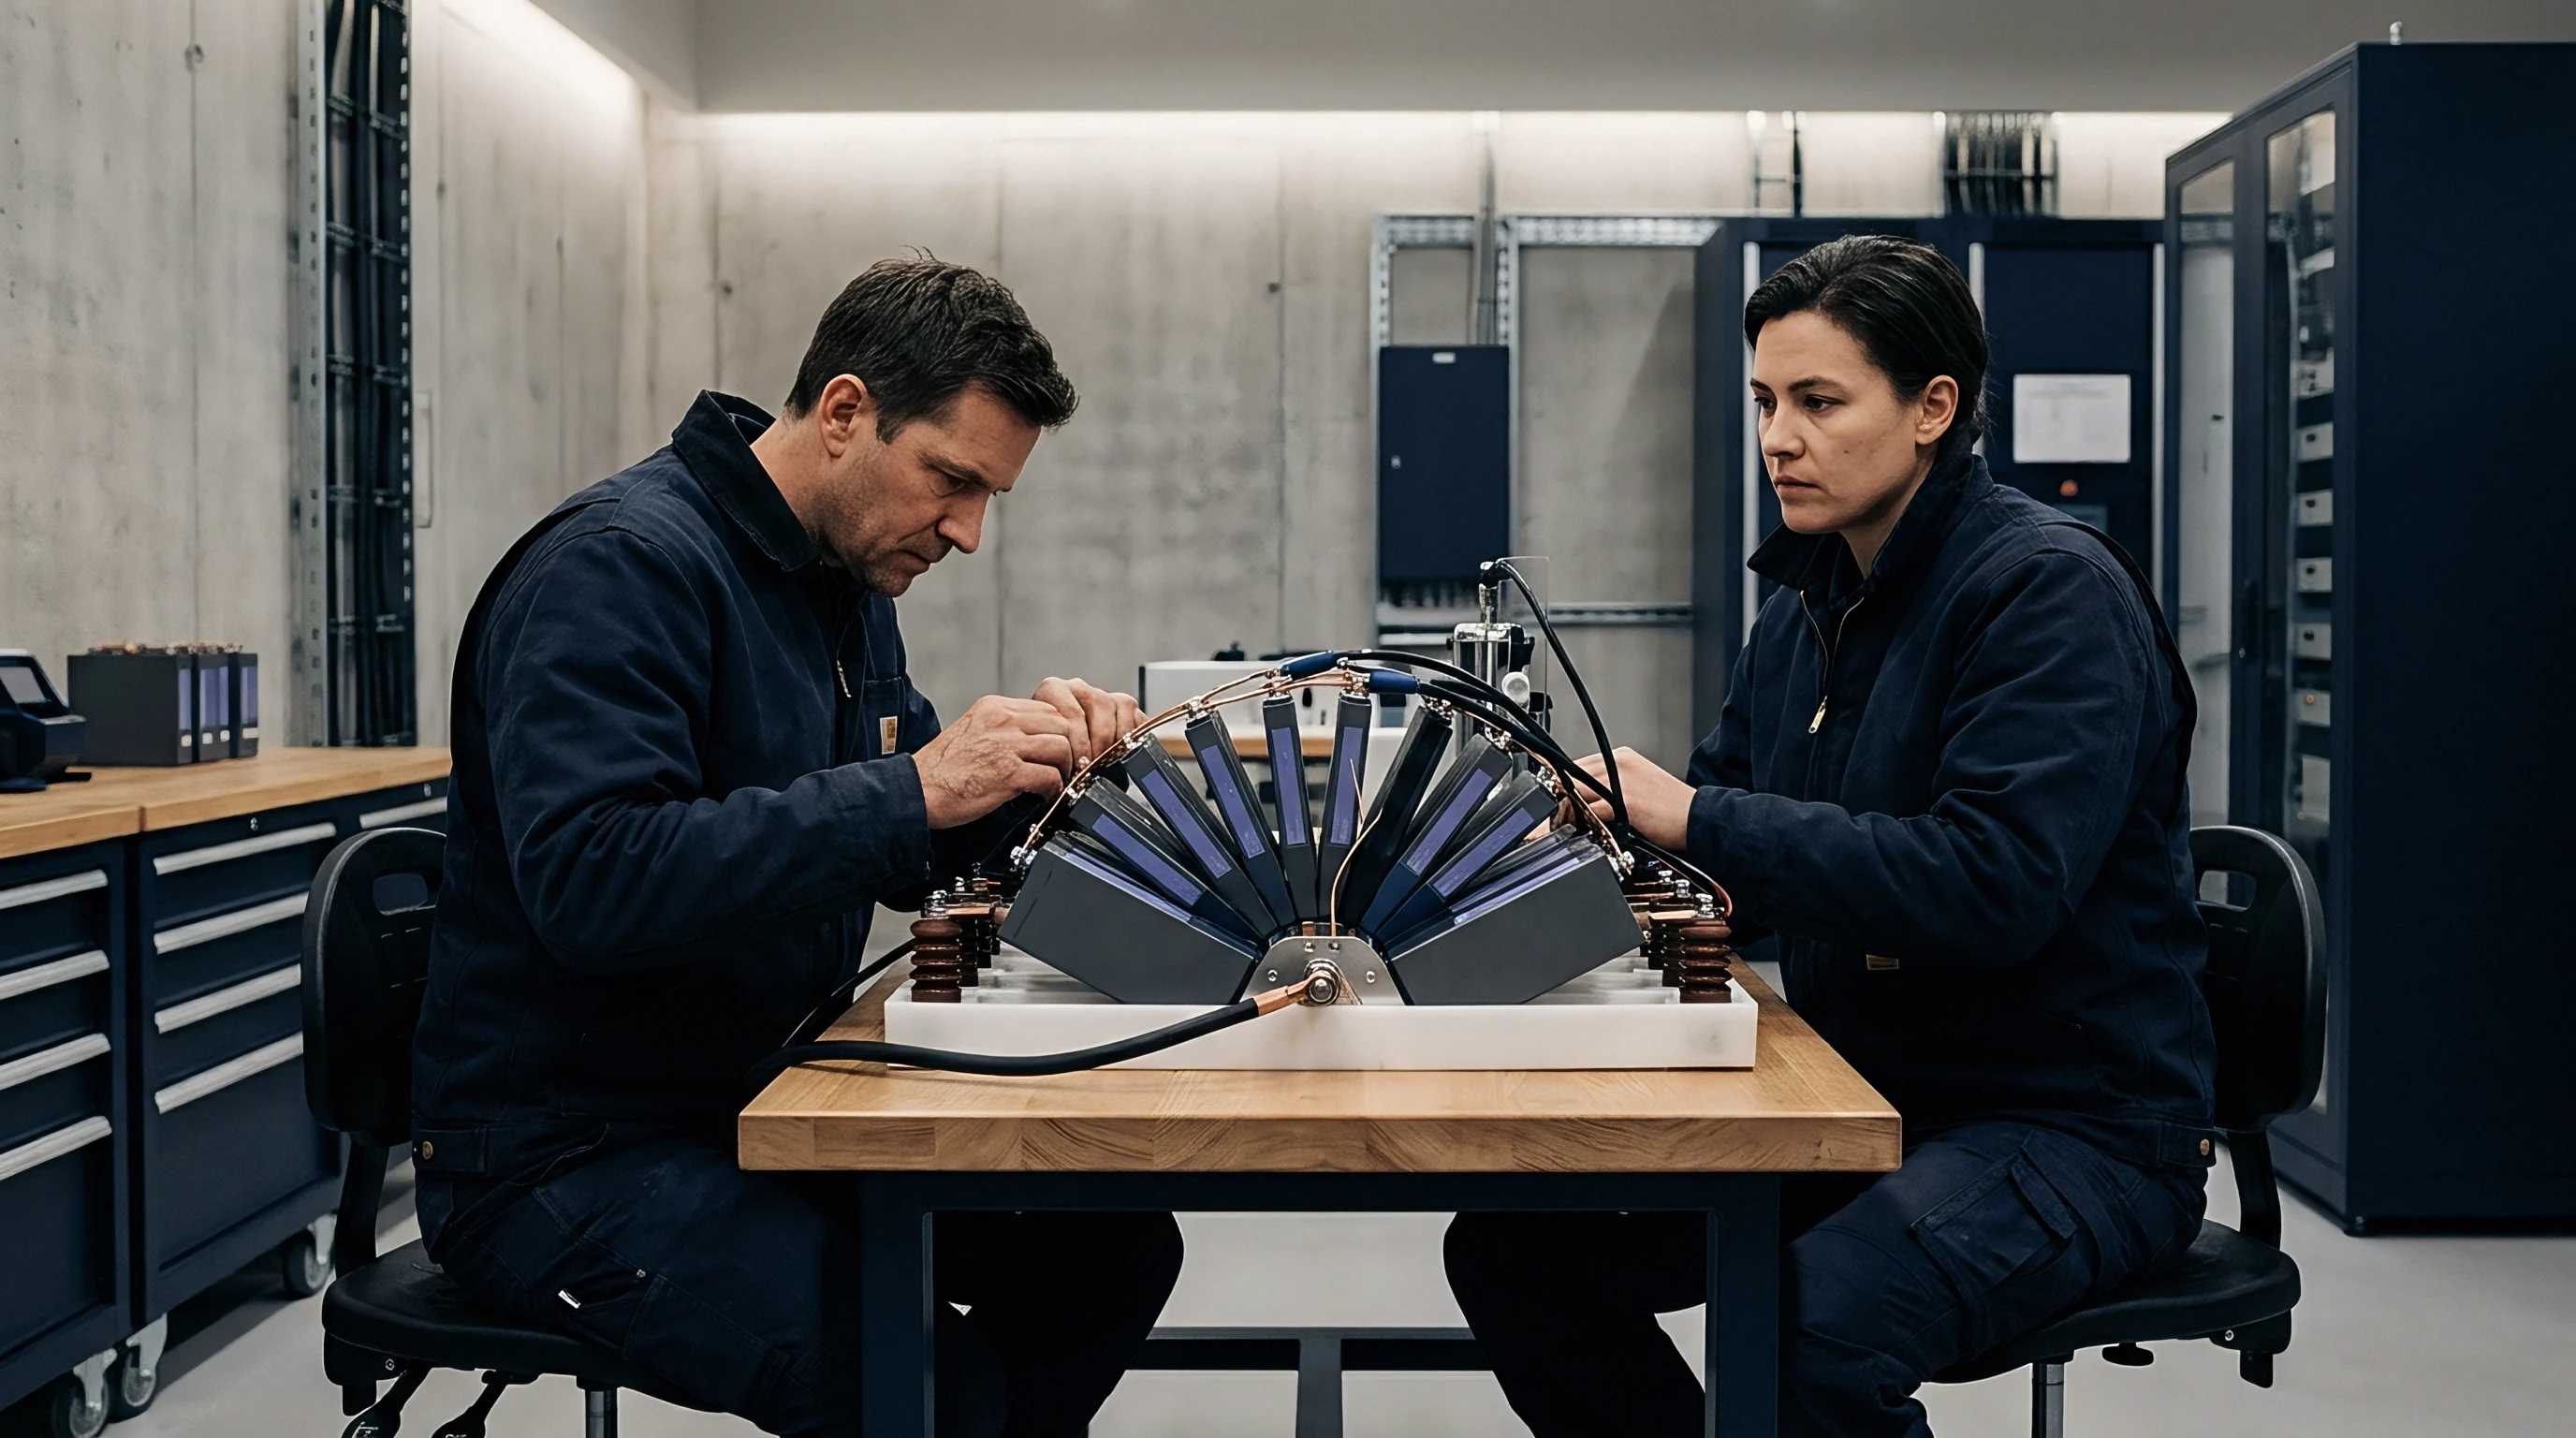
Delay
Transducer Delay Line Thermal Drift Correction
Element phase alignment across a 64-element array operating at 10 MHz requires timing precision within 2.5 nanoseconds. Friction and ambient heating expand the internal delay line block, altering wave travel times through individual channels. A 5 degrees Celsius rise inside an acrylic delay wedge expands material thickness by 0.003 mm over a 15 mm path, adding a 4.2 nanosecond phase delay at the outer elements.
Uncorrected delays degrade constructive interference at the focus, broadening the acoustic spot size from 0.8 mm to 1.7 mm at a 12 mm depth inside the module.
Automated delay correction cycles fire pitch-catch signals between outer element pairs across the wedge geometry before each scan sequence. Flight times through the delay material update the internal focal law matrix in real time, with onboard microcontrollers re-computing beam steering delays via field-programmable gate arrays within 15 milliseconds. This holds spot size variation under 5 percent across an operating range of 15 to 45 degrees Celsius.
Element phase alignment across a 64-element array operating at 10 MHz requires timing precision within 2.5 nanoseconds.
Take a 64-element linear array with an element pitch of 0.50 mm mounted on a 35-degree Rexolite delay line inspecting a structural bond line. The target focus sits 2.0 mm inside a 2.0 mm aluminum casing wall, backed by 1.5 mm of polyurethane thermal adhesive. At a baseline temperature of 22 degrees Celsius, longitudinal velocity in Rexolite measures 2330 meters per second.
The calculated time delay Δ tn for channel n focusing at depth F and angle thη follows the standard geometric formulation:
Δ tn = frac1cw left( sqrtF2 + xn2 – 2 F xn sinthη – F right)
When friction heats the Rexolite wedge to 42 degrees Celsius, sound velocity drops to 2282 meters per second ~ a thermal shift of -2.4 meters per second per degree. Without dynamic re-calibration, the focal point shifts 0.62 mm deeper, placing the focus inside the cell wall instead of the structural adhesive layer. Return signal amplitude from a 1.0 mm air void drops by 6.4 dB from defocusing, causing the classifier to miss an unbonded site.
Dynamic focal law adjustment recalculates the phase matrix by measuring the delay block thickness via internal back-wall echoes. The updated delay values alter the element excitation timing across the array face:
- Channel 01 Delay Adjustment ~ Baseline excitation timing of 0.00 nanoseconds shifts to +8.4 nanoseconds to offset wedge sound velocity reduction.
- Channel 32 Delay Adjustment ~ Center element excitation timing adjusts from 142.6 nanoseconds to 148.1 nanoseconds to maintain spatial focal position.
- Channel 64 Delay Adjustment ~ Peripheral element excitation timing shifts from 310.2 nanoseconds to 322.8 nanoseconds, preserving focal spot symmetry.
Multi-Element Focal Law Synthesis
Synthetic aperture focusing creates broad virtual apertures by mathematically combining signals from individual element firings. Electronic beam steering sweeps the acoustic vector across a 60-degree sector angle without moving the transducer. An active aperture of 32 elements yields lateral resolution of 0.6 mm at a 15 mm focal length, while signal processing algorithms run total focusing method computations on digitized RF frames within the 100-millisecond window allowed per spot.
Element failure algorithms monitor channel performance continuously during scans. An open circuit or ceramic fracture on a single element drops local acoustic power and raises side-lobe levels by 3.5 dB. Automated calibration routines detect dead elements by checking raw response signals against an integrated reference reflector.
The beamformer then compensates for up to four dead elements across a 64-element array by recalculating aperture weighting and raising power on adjacent active elements.
Ignoring thermal calibration in the array delay line degrades spatial resolution until defect sizing errors cross acceptable threshold boundaries.
Takt
Parallelized Full Matrix Capture Processing
High-speed assembly lines demand non-destructive evaluation cycles that keep up with cell stacking and dispensing operations. Inspecting a 1.2-meter battery module bond line within a 15-second takt time requires scanning at 120 millimeters per second while holding a spatial sampling pitch of 0.5 mm along the motion axis. Acquiring Full Matrix Capture data sets across a 64-element array generates 4096 individual A-scans per trigger location.
At a pulse repetition frequency of 10 kHz, raw data generation reaches 1.2 Gigabytes per second, quickly saturating standard industrial ethernet buses.
Parallel hardware architectures process signal arrays on dedicated Graphics Processing Units housed inside the sensor head junction box. Field-programmable gate arrays perform initial filtering, averaging, and envelope extraction before handing reduced data arrays to the GPU. Total Focusing Method image reconstruction algorithms run in parallel across 2048 CUDA cores, cutting frame processing time from 450 milliseconds to 8.2 milliseconds per frame.
This throughput permits real-time 100-percent volumetric coverage of bond lines without slowing the conveyor.
| Inspection Mode | Array Element Count | Pulse Repetition Frequency (kHz) | Line Scan Speed (mm/s) | Data Generation Rate (MB/s) | Reconstruction Latency (ms) |
|---|---|---|---|---|---|
| Phased Array Sector Scan | 32 | 5.0 | 150 | 45 | 3.2 |
| Phased Array Linear Sweep | 64 | 8.0 | 120 | 128 | 5.8 |
| Full Matrix Capture / TFM | 64 | 10.0 | 80 | 1200 | 8.2 |
| Plane Wave Imaging | 128 | 12.0 | 200 | 380 | 4.1 |
Encoder triggering regulates spatial sampling density across changing conveyor speeds. Optical quadrature encoders on the linear drive axis generate position pulses every 5 micrometers, which frequency divider circuits down-sample to match the 0.5 mm inspection grid. If belt slip or vibration pushes line speed above 180 millimeters per second, the system throttles pulse repetition rates or flags the module for re-inspection due to spatial under-sampling.
Standard off-the-shelf single-element transducers can match phased array defect detection rates at a fraction of the capital hardware expense.
Data reduction routines compress raw RF signals using loss-less wavelet transform algorithms before archiving dossiers to central factory servers. Extracted metrics ~ including peak amplitude, time-of-flight, and spatial defect boundary coordinates ~ append to the digital battery passport for each pack serial number. Full raw signal matrices remain stored in local circular buffers for 72 hours, letting quality engineers review edge-case defect calls before automated purging.
Scanners mounted on robotic end-effectors inspect complex module contours, including corner radius fills and cooling plate interfaces. Six-axis industrial robots follow programmed tool paths at 100 millimeters per second, maintaining perpendicularity within 0.5 degrees relative to the casing wall. Force-torque sensors on the wrist flange hold shoe contact force at 15 ± 1.2 Newtons, preventing deformation of thin-walled aluminum battery enclosures during scanning.
Claim
Responsibility Seams in Defect Classification
Automated phased array inspection systems sit directly at the commercial boundary between module assembly integrators and cell pack manufacturers. When an inline scanner flags a bond line as defective, financial responsibility for scrap or rework hinges on calibration logs. Turnkey equipment contracts specify precise minimum detectable defect criteria ~ typically an unbonded area threshold of 2.0 square millimeters or an adhesive void width exceeding 0.50 mm across the thermal transfer surface.
Calibration audit trails reveal whether an offline reject stems from genuine adhesive failure or sensor drift. Automated software logs calibration checks on inter-station test blocks, recording signal-to-noise ratios, acoustic velocity baselines, and individual channel gain settings. Under typical supply agreements, if an automated calibration check fails to run within a four-hour window, all module defect flags logged during that period revert to unverified status, requiring manual re-inspection at the equipment supplier’s expense.
| Defect Classification | Physical Size Threshold | Acoustic Signal Criteria | Action Protocol | Commercial Liability Owner |
|---|---|---|---|---|
| Structural Void | Area > 2.0 mm² | Back-wall amplitude drop > 12 dB | Automated Line Reject | Adhesive Dispense Supplier |
| Adhesive Delamination | Width > 0.5 mm | Interface reflection R > -0.70 | Automated Line Reject | Plasma Surface Prep Vendor |
| Thickness Out of Spec | Thickness < 0.8 mm or > 2.5 mm | Time-of-flight deviation > 15% | Process Alert Flag | Dispense Robot Integrator |
| Calibration Drift Error | N/A | Reference block peak shift > 1.5 dB | System Quarantine / Halt | Inspection Tool Supplier |
Non-recurring engineering costs for custom acoustic shoe design and focal law software development range from 45,000 to 120,000 USD per assembly line. Tooling amortization models distribute these capital expenses across projected pack volumes over a three-year window. Equipment suppliers must define clear boundaries for software updates and focal law modifications whenever cell chemistries or casing plate thicknesses change during production.
Compliance documentation for battery module structural integrity under standards such as UL 2580 and ECE R100 Annex 9E relies heavily on inline non-destructive evaluation dossiers. Proof of 100-percent bond coverage forms a mandatory element of the vehicle safety compliance file. If phased array calibration logs reveal uncompensated thermal drift during assembly, regulatory bodies retain authority to invalidate batch certification files, halting vehicle shipments from the plant.
Standard quality guarantee clauses in module supply contracts require non-destructive testing calibration records to be kept in accessible digital repositories for at least ten years following pack manufacturing. Any gap in calibration continuity transfers warranty liability for structural adhesive failures directly to the line equipment vendor.