Comparative Analysis of Optical and Electron Stereology for Tool Steel Verification
Field emission electron backscatter stereology provides accurate sub-micron carbide metrics required to prevent electrode slitting blade wear and cell separator punctures.


Slice

Planar Metallography and Quantitative Stereological Sampling
Quantitative stereology mathematically links two-dimensional section measurements to three-dimensional microstructural features. When a metallographic cut passes randomly through a constituent distribution, planar phase areas, intercept lengths, and point counts correlate directly with volumetric parameters. By the Delesse principle, the areal fraction of a second phase on such a cut matches its volume fraction in the bulk.
Similarly, the Rosiwal linear intercept method and the Glagolev-Hautenville point count yield unbiased volume fraction estimates, provided geometric randomness holds. In tooling grades like AISI D2, AISI M2, and powder-metallurgy CPM-10V ~ run in lithium-ion electrode slitting knives and tab blanking dies ~ small variations in primary and secondary carbide volume fractions largely govern wear life and edge retention.
Sampling bias remains the primary hazard during initial specimen preparation. Without systematic random sampling across the entire cross-section of a forged or rolled billet, local banding or segregation skews the statistical baseline. Because hot reduction draws carbides out into directional stringers along the working axis, cuts belong on planes both parallel and perpendicular to that flow.
Transverse planes reveal cluster cross-sections and spatial grouping, whereas longitudinal views capture stringer length, aspect ratio, and orientation. Gathering data across at least fifteen to twenty non-overlapping fields per mount prevents local field-to-field scatter from obscuring true lot-to-lot differences.
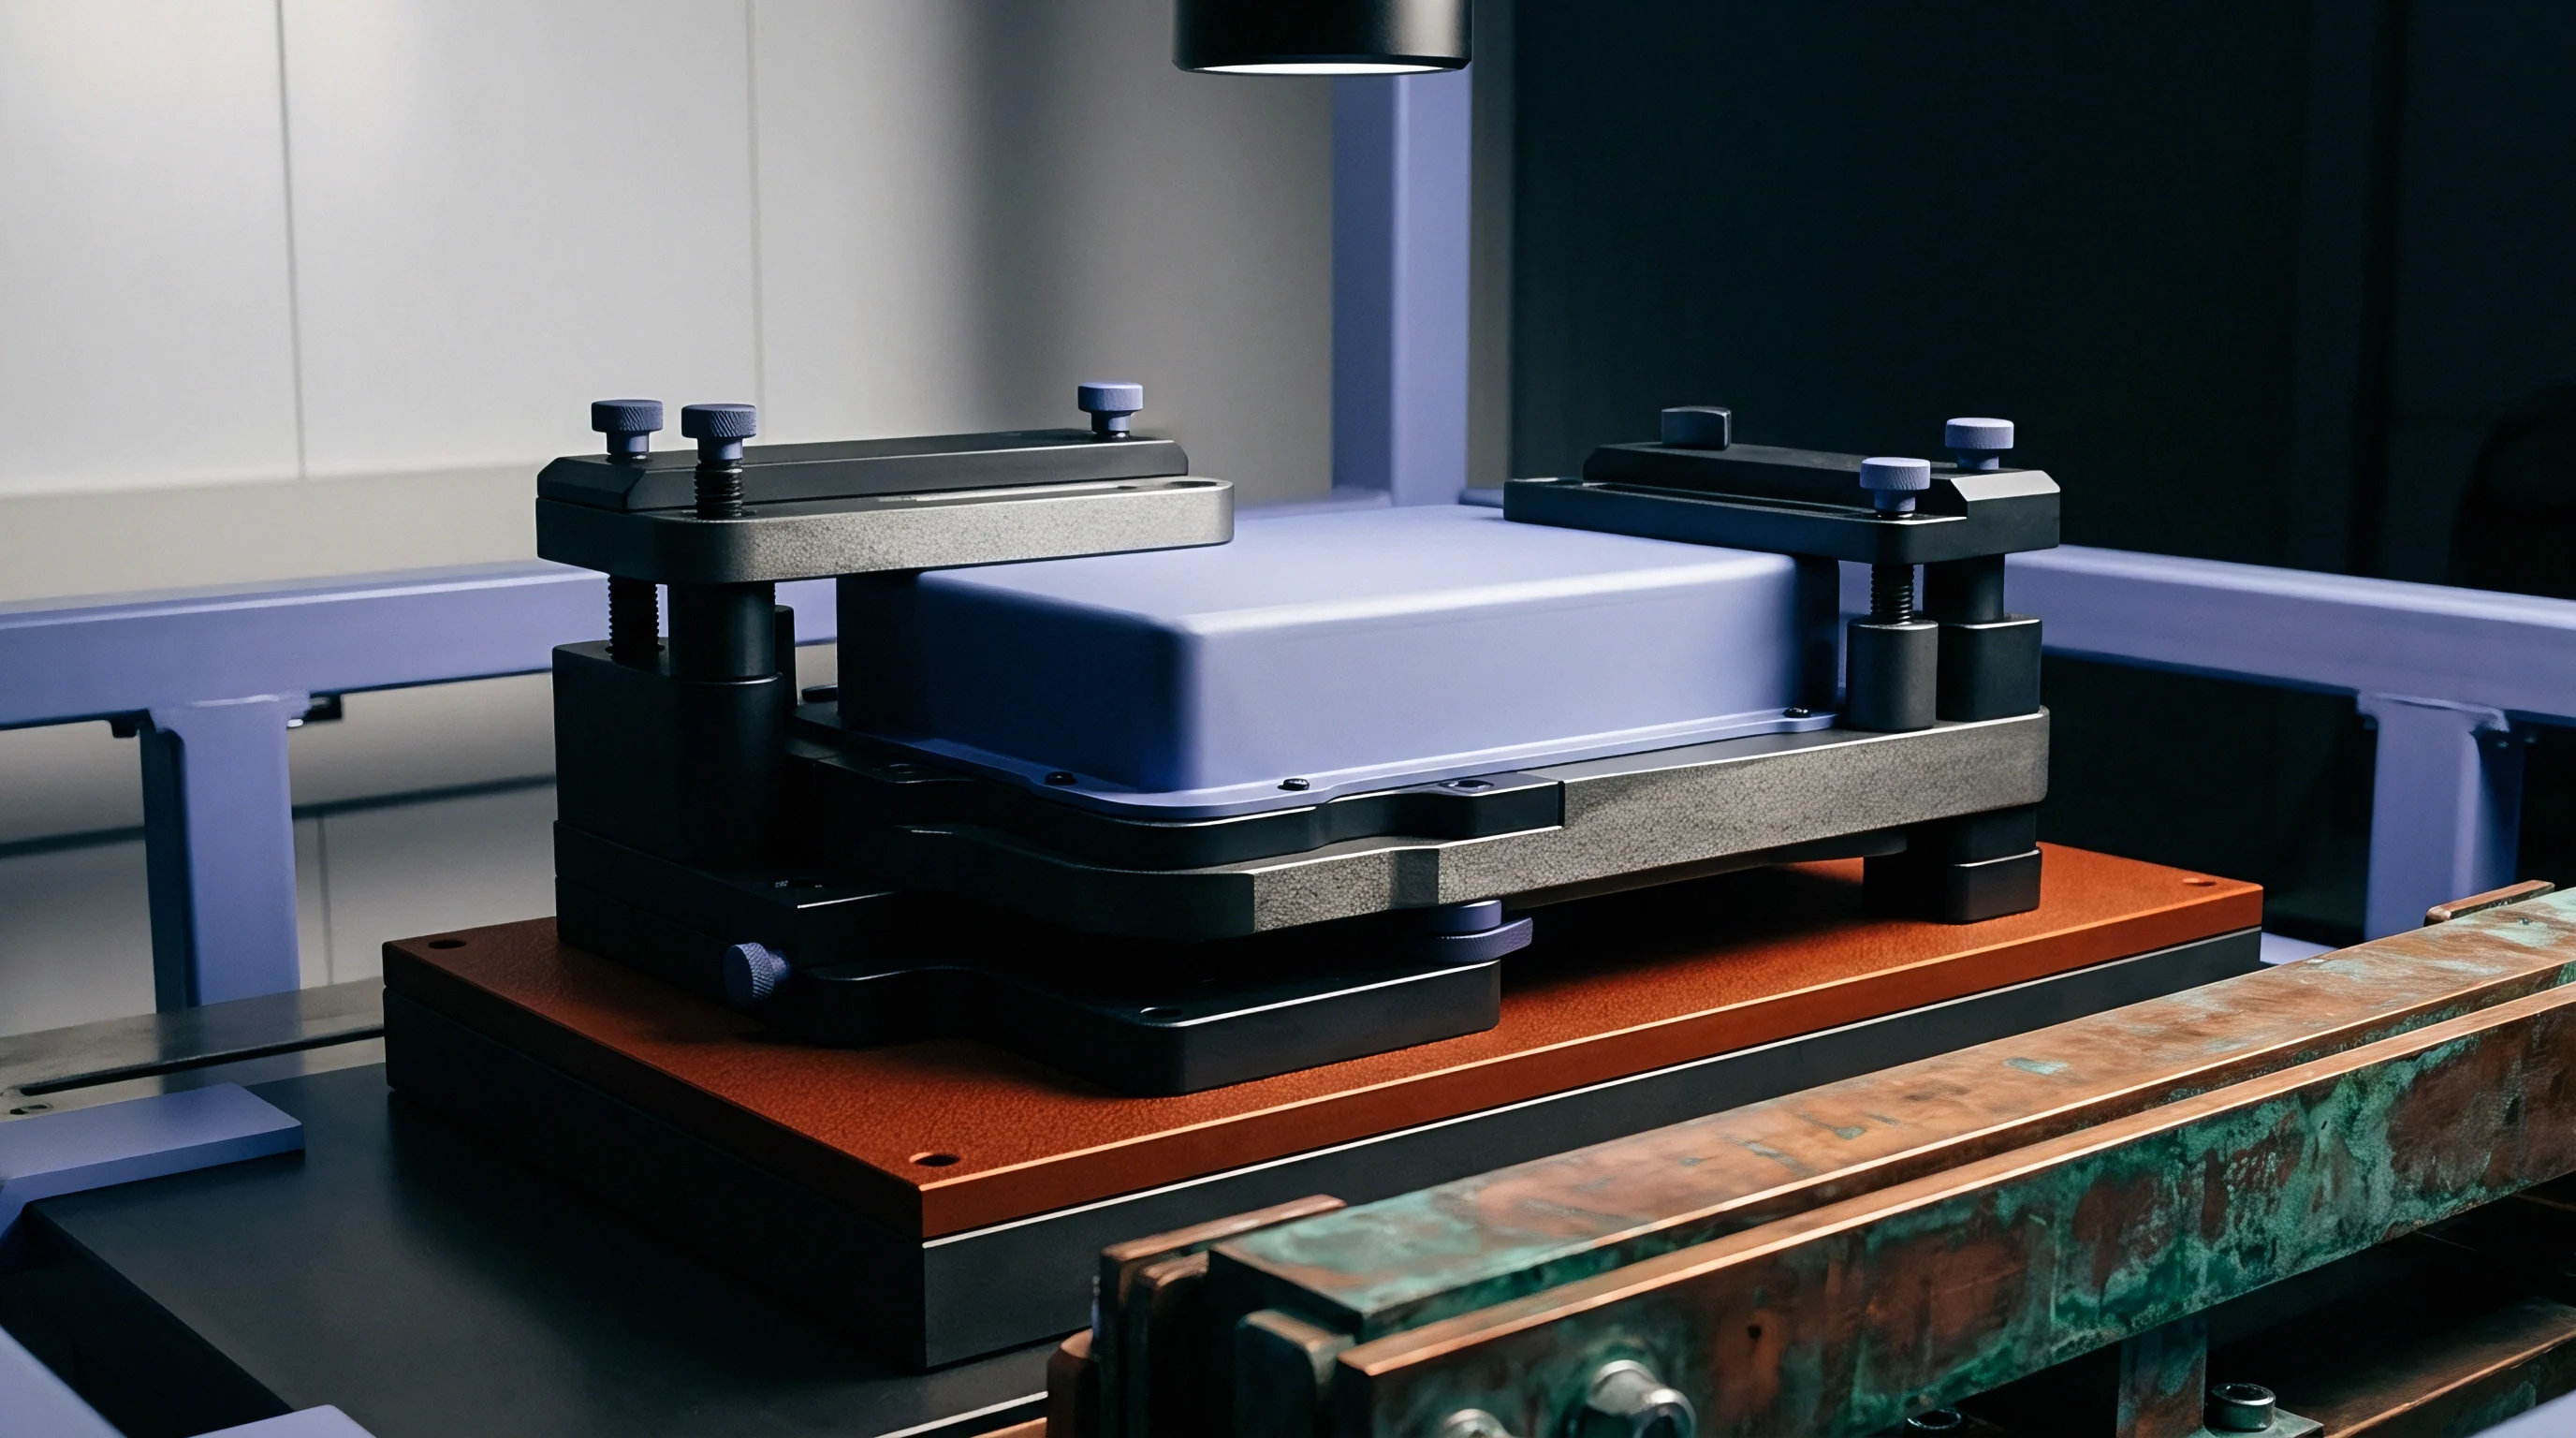
Preparation artifacts easily misrepresent phase boundaries. Coarse silicon carbide grinding leaves smeared deformation layers and micro-scratches that obscure sub-micron secondary precipitates. Subsequent polishing with loose diamond slurries down to one-micron abrasive can introduce relief: the tempered martensitic matrix cuts away faster than hard vanadium or chromium carbides, leaving the hard particles standing proud.
That difference in height shifts the optical focal plane across phase boundaries, throwing halo rings around particles that artificially inflate carbide area fractions during threshold segmentation. Coarse abrasive passes also risk pluck-out, wrenching brittle primary carbides from the matrix and leaving cavities that automated systems misclassify as voids or non-metallic inclusions.
| Preparation Stage | Abrasive Medium and Grit | Applied Force per Sample | Platen Speed and Direction | Targeted Surface Outcome |
|---|---|---|---|---|
| Coarse Planar Grinding | 220-grit resin-bonded diamond disc | 25 N | 300 RPM, complementary rotation | Planar surface removal of sectioning damage |
| Fine Lapping | 9 µm polycrystalline diamond suspension | 20 N | 150 RPM, counter-rotation | Elimination of deformation layer without edge rounding |
| Final Polish (Optical) | 1 µm polycrystalline diamond suspension | 15 N | 100 RPM, counter-rotation | Minimization of carbide relief to less than 50 nm |
| Vibratory Polish (Electron) | 0.02 µm colloidal silica slurry | 5 N (gravity weight) | Vibratory action, 80 Hz frequency | Amorphous damage layer removal for electron backscatter |
Chemical etching introduces its own complications. While nital delineates martensitic boundaries and particle edges to generate light-microscope contrast, even slight over-etching expands interfaces and can widen apparent particle perimeters by hundreds of nanometers. For backscattered electron imaging, surfaces must remain unetched and planar so topographical contrast does not overwhelm atomic-number differentiation.
Two to four hours of vibratory polishing in a colloidal silica suspension removes the disturbed surface layer left by mechanical grinding, exposing unworked crystallographic interfaces to the beam. Relief must remain strictly under fifty nanometers to avoid geometric shadowing during low-tilt SEM inspection.

Mathematical Frameworks for Spatial Reconstruction
Translating 2D planar sections into 3D size distributions requires unfolding algorithms that account for intersection probability. A planar cut through a population of spheres rarely bisects their equators; it samples chords, skewing the apparent diameter distribution toward smaller sizes. The Scheil-Schwartz-Saltykov method corrects for this geometry by binning observed profile diameters into discrete intervals and multiplying by a transformation matrix derived from sphere intersection probabilities.
Where particles deviate from equiaxed geometry ~ such as prolate carbide shapes along rolling directions or residual eutectic networks ~ unfolding requires spatial moment analysis adapted to non-spherical bodies.
Reconstruction begins with determining particle density per unit area. To prevent boundary artifacts during automated feature counts, analysts apply Gundersen’s unbiased counting frame. Under this convention, particles intersecting the upper and right inclusion borders are tallied, while those intersecting the lower and left exclusion borders are ignored regardless of how much of their cross-section lies inside the frame.
This neutralizes the geometric probability that larger carbides will intersect an edge more frequently than smaller ones. Spatial numerical density then follows from planar count data via the mean reciprocal diameter of the observed profiles.
Errors also emerge when observation depth approaches the scale of the particles. In transmitted light through thin preparations, or where light penetrates translucent boundary phases, subsurface features project into the focal plane. Under an electron beam, interaction volumes produce an analogous projection effect whenever emission depth exceeds particle radius.
These mechanisms inflate apparent area fractions ~ the classical Holmes effect. Standard stereological adjustments apply correction factors based on the ratio of effective slice thickness to mean particle diameter to restore parity across differing inspection setups.
Does an uncorrected planar sectioning plane provide sufficient statistical power to detect sub-micron carbide clustering in powder metallurgy tool steels prior to cutter machining?


Lens
Diffraction Limits and Optical Image Analysis
Optical microscopy encounters hard physical boundaries imposed by diffraction. By the Rayleigh criterion, spatial resolution depends on illumination wavelength and the numerical aperture of the objective. For 550 nm green light paired with a 0.95 NA dry objective, lateral resolution reaches a practical limit near 350 nm; oil immersion at 1.40 NA tightens this to roughly 240 nm under matched refractive index conditions.
However, secondary precipitates in modern cold-work tooling ~ notably tempered M23C6 and MC carbides ~ frequently measure between 50 and 300 nm. Light microscopy cannot resolve them individually, either dropping them below the detection floor or blending dense clusters into single, unresolved masses.
Gray-level thresholding remains a major source of operator-dependent scatter. Automated image systems use histogram segmentation to distinguish carbides from the surrounding tempered martensite. Under brightfield illumination, contrast hinges on reflectivity: polished carbides return more light than the darker, etched matrix.
But diffraction fringes around fine features blur phase boundaries, smearing pixel values across intermediate gray bands rather than yielding distinct bimodal distributions. A shift of three gray values on an 8-bit scale can alter measured carbide volume fraction by up to 2.5 percentage points on an alloy containing roughly 10% nominal carbide volume.
Light optical quantitative stereology systematically undercounts sub-micron secondary carbides due to spatial diffraction limits, distorting phase volume fraction measurements in high-alloy cold-work tool steels.
Uneven sensor illumination in brightfield modes generates shading gradients that destabilize thresholding across wide fields. Digital systems counter this by subtracting blank background frames to flatten field intensity prior to segmentation. Differential interference contrast (DIC) splits polarized illumination to translate fine surface slope into intensity shifts, highlighting carbide perimeters without deep chemical etching.
But DIC introduces directional shadowing that biases automated edge detection along the shear axis of the prism, necessitating consistent optical orientation throughout an acquisition batch.
Standardized Optical Inspection Protocols
Traditional inclusion and carbide evaluations rely on comparative visual rating standards such as ASTM E45 and ISO 4967. Technicians match live eyepiece fields against reference chart micrographs, sorting inclusions into sulfides, aluminates, silicates, and globular oxides by morphology and coloration. This approach is inherently qualitative, prone to inter-operator divergence, and incapable of producing the quantitative spatial metrics required for numerical wear modeling.
Automated image analysis via ASTM E1245 substitutes digital stereological measurements for visual charts, recording projected area, length, width, and occurrence frequency across motorized runs of one hundred fields or more.
Measurement accuracy remains bound to optical resolution. In an alloy like AISI D2, primary M7C3 carbides measuring 10 to 15 µm coexist with sub-micron secondary precipitates, presenting a dynamic range no single optical magnification can bridge. Scanning at 200× provides the necessary field area to quantify primary carbide stringers with statistical validity, but scales pixel resolution to roughly 0.6 µm.
At that sampling pitch, sub-micron secondary carbides drop below the Nyquist limit and vanish from the quantitative tally.
- Threshold boundary drift occurs when lamp output or detector gain drifts between sessions, causing identical carbide features to register varying pixel areas.
- Diffraction halo swelling artificially inflates primary carbide profiles under high-contrast brightfield conditions, leading to overreported volume fractions.
- Adjacent particle coalescence merges tightly grouped sub-micron carbides into single elongated entities, skewing numerical density and aspect ratios.
- Etching depth variability changes matrix darkening across prepared mounts, shifting histogram minima and unsettling automated phase segmentation.
- Focal plane dispersion introduces local defocus across broad fields, softening carbide boundaries into gradual intensity transitions that defeat edge-detection filters.
Increasing magnification to 1,000× tightens pixel size to 0.06 µm, bringing coarser secondary particles into view. However, the reduced field of view demands hundreds of supplemental fields to capture structural heterogeneity across a coupon. Covering a single square centimeter at this scale requires thousands of individual image tiles, ballooning dataset sizes and placing heavy mechanical demands on motorized stages.
Optical stereology remains caught in this trade-off between statistical spatial coverage and resolving power.
Optical image analysis per ASTM E1245 may document compliance with carbide sizing purchase orders, but punch edge chipping often traces to coarse primary carbide clustering rather than operational overload on the blanking line.

Beam

Electron Interactions and Backscattered Signal Stereology
Scanning electron microscopy circumvents photon diffraction by probing specimens with a focused beam of accelerated electrons. Field-emission SEMs (FEG-SEMs) achieve sub-nanometer beam diameters across accelerating voltages from 5 to 20 kV. For stereological quantification, backscattered electron (BSE) imaging takes precedence over secondary electron collection.
Because BSE yield scales monotonically with mean atomic number, elastic scattering produces compositional contrast with minimal topographic influence on flat-polished samples. In tool steels with tungsten- or molybdenum-rich M6C phases, the carbides appear distinctly brighter than the iron matrix, whereas lighter vanadium-rich MC particles display negative contrast against the steel background.
Interaction volume geometry governs sub-surface signal origin. Primary beam electrons at 15 to 20 kV penetrate up to a micrometer into the specimen, generating a pear-shaped excitation zone. Backscattered electrons escaping from these depths widen the lateral emission profile, softening edge definitions on sub-micron carbides.
Lowering the beam energy to 3 ~ 5 kV confines penetration to less than 100 nm, restricting BSE escape to the immediate surface layer. This low-voltage regime preserves lateral resolutions under 10 nm, providing the edge sharpness required to segment fine secondary carbides.
Field emission scanning electron microscopy at an accelerating voltage of 5 kV isolates backscattered electron signals to a depth of 80 nm, enabling true two-dimensional planar stereology of sub-micron matrix carbides.
Atomic-number contrast yields high signal-to-noise ratios suitable for automated segmentation. Unlike optical intensity profiles, BSE gray-level histograms generate distinct, well-separated peaks corresponding to specific phases. Integrating energy-dispersive X-ray spectroscopy (EDS) into automated BSE runs adds elemental confirmation for individual features.
Modern automated BSE-EDS routines classify thousands of particles per hour, cataloging coordinates, cross-sectional area, equivalent circular diameter, morphology, and chemistry. This distinction easily separates chromium-rich M7C3 carbides from vanadium-rich MC types in complex powder-metallurgy microstructures.
| Stereological Parameter | Light Optical Microscopy (LOM) | Conventional SEM-BSE (15-20 kV) | Field Emission SEM-BSE (3-5 kV) | Electron Backscatter Diffraction (EBSD) |
|---|---|---|---|---|
| Minimum Particle Resolution | 350 nm | 100 nm | 10 nm | 20 nm |
| Phase Contrast Mechanism | Reflectivity / Etch topography | Atomic number difference (Z) | Atomic number difference (Z) | Crystallographic lattice structure |
| Chemical Phase Separation | Unresolvable | Possible via concurrent EDS | Possible via concurrent EDS | Direct crystallographic identification |
| Area Fraction Error (VV) | ±2.5% (sub-micron loss) | ±0.8% (interaction volume blur) | ±0.1% (true planar capture) | ±0.2% (pattern index reliability) |
| Scan Speed per Field | 0.2 seconds | 1.5 seconds | 2.5 seconds | 45 seconds |
Crystallographic Segmentation via Electron Backscatter Diffraction
Electron backscatter diffraction (EBSD) differentiates microconstituents by crystallographic symmetry rather than atomic mass. With polished, unetched specimens tilted at seventy degrees, incident electrons generate Kikuchi diffraction patterns that index in real time against structural space groups for ferrite, retained austenite, M3C, M7C3, M23C6, and MC phases. The resulting stereological datasets yield phase distributions alongside grain boundary misorientation and local lattice strain across the scanned area.
Spatial drift during extended EBSD scans can warp measured particle geometries. High-speed CMOS detectors indexing upwards of 2,000 patterns per second reduce dwell times and limit drift distortions. Step size must reflect the target carbide dimensions: a 20 nm scan step supplies roughly ten measurement points across a 200 nm secondary carbide, providing enough internal pixels to assess aspect ratio and perimeter morphology reliably.
Serial sectioning via focused ion beam (FIB) SEM provides empirical validation for two-dimensional stereological reconstructions. Dual-beam systems mill successive matrix slices as thin as 5 nm with gallium or xenon ions, imaging the freshly exposed face with BSE after each cut. Reconstructing hundreds of registered slices generates three-dimensional volumes with isotropic voxel resolution.
This approach verifies planar unfolding assumptions by directly detailing interconnected carbide networks, spatial clustering, and interfacial boundary areas.
The battery tooling integrator absorbed a thirty-two thousand dollar qualification loss when optical inspection failed to detect sub-micron carbide networks in a lot of rotary slitting knives, causing catastrophic edge chipping during the first production shift.
Carbide

Quantitative Stereological Metrics and Calculations
Stereological parameters correlate directly with tool life under cyclic contact stress. Beyond volume fraction, mean free path measures the average edge-to-edge distance between adjacent carbides along a random test line through the matrix. Calculated from phase volume fraction and boundary intersection density per unit length, a shorter mean free path reflects a tighter dispersion capable of pinning dislocations and suppressing localized micro-yielding during blanking.
Size distribution analysis groups carbide dimensions into discrete bins to generate metrics for statistical quality control. Planar particle density translates into spatial numerical density through mean profile dimensions. Morphological descriptors such as aspect ratio and circularity track deviations from equiaxed geometry; angular primary carbides act as microstructural stress concentrators in tempered martensite, seeding fatigue cracks under cyclic bending.
Anisotropy indices evaluate directional banding by contrasting particle intercepts parallel and perpendicular to the primary working axis.
Direct comparisons between optical and BSE datasets underscore the distorting effect of optical diffraction limits. On a CPM-10V powder-metallurgy blanking punch lot, optical inspection at 500× recorded a carbide volume fraction of 7.2% with a mean particle diameter of 1.4 µm. Scanning electron BSE analysis of the identical surface at 10,000× revealed a true volume fraction of 12.8% and a mean particle diameter of 0.38 µm.
Light microscopy failed to register secondary vanadium carbides below 300 nm while inflating apparent primary particle dimensions via diffraction broadening.

Which Stereological Method Captures Fine Matrix Carbide Distributions Accurately?
Field-emission BSE stereology provides the necessary fidelity to resolve fine matrix carbides in micro-alloyed tool steels. Optical microscopes cannot reliably separate sub-micron secondary precipitates from matrix background signals; diffraction rings soften particle perimeters, either exaggerating area fractions or dropping smaller particles out of the count altogether. FEG-SEM systems using backscattered electrons resolve constituents down to 10 nm, securing the spatial data required for wear modeling and failure analysis.
Consistent stereological verification relies on a structured preparation and measurement sequence to ensure reproducibility across lots.
- Mount tool steel specimens in conductive copper-filled phenolic resin to prevent edge rounding and mitigate beam charging in the SEM chamber.
- Grind planar surfaces with sequential resin-bonded diamond discs down to a 3 µm finish, maintaining constant lubricant flow to prevent frictional tempering of martensite.
- Polish on a vibratory unit using 0.02 µm colloidal silica for three hours to remove residual surface deformation while avoiding relief step-heights.
- Calibrate magnification scales on optical and electron systems against a certified NIST-traceable grid prior to acquisition.
- Acquire fifty non-overlapping backscattered electron images per coupon at 5,000× magnification under a 3 kV accelerating voltage.
- Apply binary thresholding using peak-valley histogram segmentation to isolate carbide phases from matrix signals.
- Compute stereological metrics including volume fraction, mean intercept length, shape factor distributions, and nearest-neighbor spacing across the aggregated dataset.
Carbide segregation metrics derived from stereology establish material acceptance against standard specifications. While ASTM A681 and SEP 1572 supply visual comparison charts for high-alloy tool steels, digital image analysis replaces qualitative grading by evaluating area fraction variance across a defined grid. Elevated variance coefficients expose microstructural stringering or centerline segregation ~ conditions that invite anisotropic distortion during vacuum heat treatment.
Standard purchase specifications invoking ASTM E1245 optical quantitative analysis fail to detect sub-micron matrix carbide depletion, rendering compliance certificates blind to secondary hardening variations.
Primary carbides and secondary hardening dispersions act differently under mechanical stress. Coarse primary M7C3 carbides exceeding 10 µm lower fracture toughness by providing easy cleavage pathways along their long axes. Conversely, fine secondary M23C6 carbides between 50 and 200 nm improve yield strength and abrasion resistance with minimal impact penalty.
Image analysis routines must bin these populations separately, using threshold cutoffs to prevent primary particles from distorting secondary dispersion metrics.
Carbide stringers aligned parallel to cutting edges promote early micro-chipping regardless of bulk matrix hardness.


Shear

Tooling Failure Mechanics in Battery Electrode Manufacturing
Electrode slitting imposes severe abrasive and fatigue loads on cutting edges. Cathode webs consist of 12 ~ 15 µm aluminum current collectors coated on both surfaces with abrasive lithium nickel manganese cobalt oxide or lithium iron phosphate slurries; anodes comprise 6 ~ 10 µm copper foil coated with graphite and carbon black. Rotary slitter knives must preserve sub-two-micrometer edge radii while engaging these mineral coatings at line speeds exceeding 100 m/min.
Tool degradation ~ whether by edge rounding, localized chipping, or microscopic plastic yield ~ destabilizes steady-state shear dynamics.
Edge burrs generated during slitting introduce major defects into downstream winding and stacking. Burrs exceeding 10% of foil thickness can puncture microporous polyolefin separators under winding tension, forming direct internal shorts that risk thermal runaway during cell formation. Preventing excessive burr heights requires maintaining knife edge radii below 2 µm over extended production intervals.
Edge retention depends directly on tool microstructure ~ principally the volume fraction and spatial dispersion of hard carbides.
| Tool Steel Grade | Heat Treatment Hardness | Primary Carbide Mean Free Path | Secondary Carbide Volume Fraction (VV) | Slitting Distance to Reach 2 µm Burr Height |
|---|---|---|---|---|
| AISI D2 (Standard) | 60-62 HRC | 18.5 µm | 3.2% (Optical verified) | 45,000 meters |
| AISI M2 (High Speed) | 62-64 HRC | 12.1 µm | 5.8% (SEM verified) | 82,000 meters |
| CPM-10V (Powder Metal) | 62-64 HRC | 4.2 µm | 10.4% (SEM verified) | 210,000 meters |
| Vanadis 4 Extra (PM) | 63-65 HRC | 3.8 µm | 11.8% (SEM verified) | 265,000 meters |
Chipping along knife edges frequently originates at coarse primary carbides. When an individual vanadium or chromium carbide larger than 8 µm intercepts the cutting edge, cyclic contact forces generate high shear stresses along the particle-matrix boundary. The brittle carbide fractures or pulls free from the tempered martensite, leaving an edge micro-notch.
These localized defects tear the foil and generate tall burrs. Powder-metallurgy grades replace these large primary carbides with fine, isotropic dispersions that resist interfacial fatigue spalling.
Auditing Stereological Verification Criteria
Procurement specifications for slitting tooling require stereological acceptance criteria alongside standard hardness values. Bulk Rockwell C testing cannot detect microstructural banding or carbide depletion. Knives heat-treated to an identical 63 HRC often exhibit divergent operational life depending on secondary carbide volume fraction and mean free path.
Quantitative FEG-SEM BSE audits provide verifiable structural metrics before tools enter production service.
Bulk hardness measurements fail to predict slitting knife wear rates because edge retention depends entirely on sub-micron carbide volume fraction and mean free path.
- Verify sample orientation compliance ensuring stereological cuts capture both longitudinal stringers and transverse carbide distributions relative to the engineering drawing.
- Confirm instrument calibration records validating that pixel scale factors trace directly to certified NIST grid standards.
- Check accelerating voltage settings ensuring SEM BSE acquisition was conducted between 3 and 5 kV to limit interaction volume expansion.
- Audit histogram segmentation logic verifying that phase boundary thresholds fall at bimodal histogram minima without arbitrary manual offsets.
- Review minimum statistical field counts confirming data represents at least thirty non-overlapping fields per coupon.
- Validate particle size cutoffs ensuring secondary carbide calculations exclude primary carbides larger than 3 µm.
Supply contracts for slitting tooling should incorporate quantitative stereological criteria for lot acceptance. Blanks failing minimum secondary carbide volume fractions or exhibiting primary carbide clusters above set thresholds warrant rejection prior to machining and finish grinding. Enforcing these criteria shields cell manufacturing lines from slitter-induced downtime and separator defect liabilities.
Under Section 4.2 of the supply agreement, any incoming lot exhibiting primary carbide clusters larger than 15 µm in SEM-BSE analysis faces rejection at vendor expense.


Settlement

Commercial Execution and Quality Risk Transfer
Tool steel qualification for battery production links microstructural verification directly to commercial accountability. Non-destructive inspection of incoming bar stock cannot evaluate sub-micron carbide distributions, leaving destructive coupon testing as the only reliable filter. First Article Inspection routines should mandate stereological analysis on witness coupons from each raw steel heat lot.
When a buyer signs off on material using low-magnification optical evaluations, legal liability for premature wear shifts from the steel supplier to the toolmaker or cell manufacturer.
The cost delta between optical and electron stereology remains small relative to production stoppage risks. An ASTM E1245 optical analysis typically costs around one hundred fifty dollars per sample and requires under thirty minutes of instrument time. A field-emission SEM BSE characterization, with multi-field automated mapping and phase segmentation, runs between six hundred and nine hundred dollars.
In a cell plant producing one hundred thousand pouch cells daily, a single hour of slitting line downtime from edge burrs can exceed forty thousand dollars in scrapped material and delayed throughput.
Tooling NRE budgets should incorporate electron stereological qualification during early quoting and design phases. Allocating inspection capital to SEM characterization during new product introduction avoids tool redesigns and line stoppages later in the ramp. When disputes arise regarding premature blade wear or spalling, quantitative stereology provides objective forensic evidence.
Verified datasets showing secondary carbide depletion or excessive primary carbide mean free path pin financial responsibility directly on the steel producer or heat treater.
Supply contracts must detail preparation methods, instrument parameters, and statistical formulas for lot release. Subjective clauses calling for ‘uniform microstructure’ or ‘sound carbide distribution’ provide no standing in commercial arbitration. Definitive stereological metrics obtained via FEG-SEM BSE convert metallurgical quality claims into enforceable numerical acceptance thresholds.