Statistical Process Control Metrics for Evaluating High Volume Battery Cell Internal Resistance Distributions
Statistically valid internal resistance screening requires non-parametric capability metrics and thermal corrections to prevent high-resistance distribution tails.

Probe
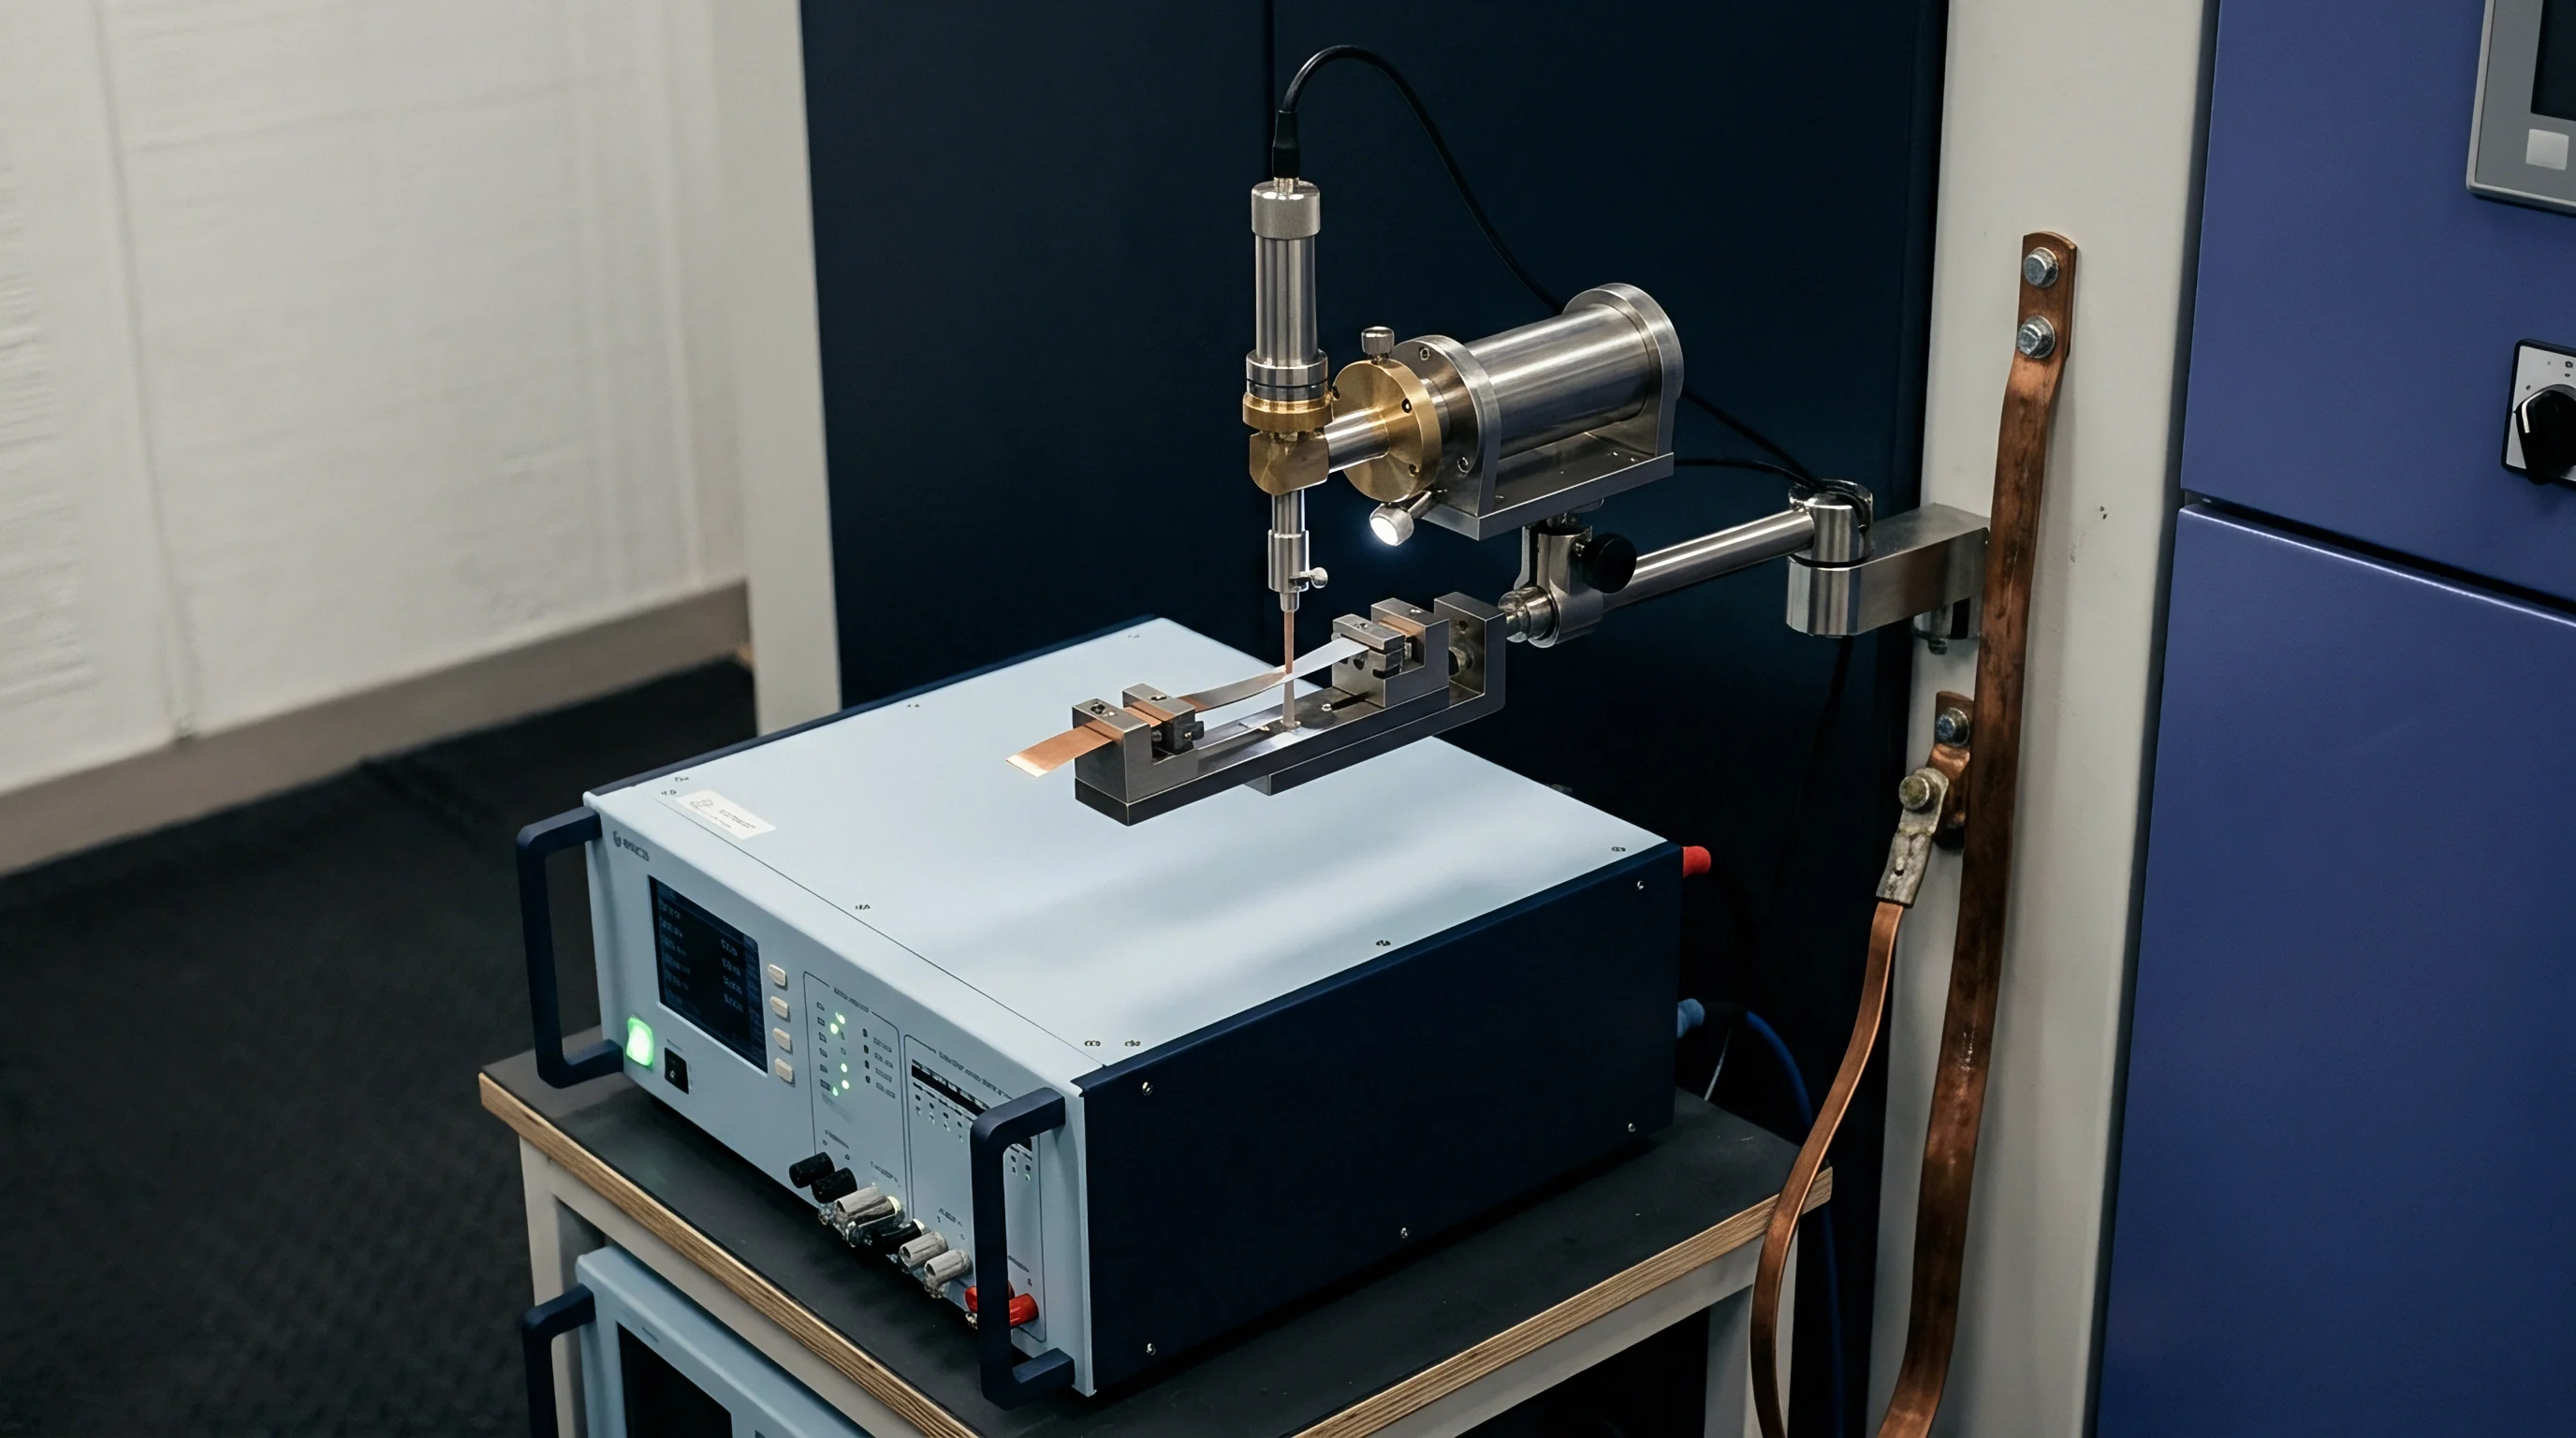
Four-wire Kelvin sensing fixtures form the physical interface for automated high-speed impedance measurements on modern high-volume battery cell manufacturing lines. In production lines running at eighty to one hundred twenty cells per minute, internal resistance screening isolates micro-structural defects, tab welding flaws, and electrolyte wetting deficiencies before packaging. Automated testing systems measure alternating current internal resistance at a fixed frequency of 1 kHz, alongside direct current pulse resistance evaluated over ten-millisecond to ten-second discharge durations.
Measurement integrity depends entirely on minimizing parasitic contact resistance introduced by spring-loaded pogo pins, oxide buildup on terminal surfaces, and mechanical clamp alignment errors.
Contact pressure defines signal stability. When automated probes engage aluminum cathode terminals or nickel-plated steel casing, contact resistance variations frequently approach 0.1 mOhm to 0.3 mOhm. On high-capacity prismatic or large-format cylindrical cells with nominal resistance values between 0.5 mOhm and 2.0 mOhm, fixture noise can account for twenty to forty percent of total observed process variance.
Gage Repeatability and Reproducibility studies evaluate fixture capability prior to defining process control limits. A probe system where total gage variance exceeds ten percent of the engineering specification tolerance band distorts the true underlying process distribution, causing false rejections of conforming lots and unflagged acceptance of out-of-specification tail cells.
| Parameter | 1 kHz AC Resistance | 100 ms DC Pulse Resistance | 10 s DC Pulse Resistance |
|---|---|---|---|
| Primary Reaction Mechanism | Ohmic Resistance (Electrolyte, Tabs, Foils) | Ohmic plus Charge Transfer Resistance | Charge Transfer plus Concentration Polarization |
| Typical Measurement Time | 10 to 50 milliseconds | 100 to 150 milliseconds | 10 to 12 seconds |
| Line Sampling Frequency | 100 percent inline screening | 100 percent inline or statistical spot sampling | Offline quality control laboratory sampling |
| Temperature Sensitivity | Low (approximately 0.5 percent per degree Celsius) | Moderate (approximately 1.5 percent per degree Celsius) | High (2.0 to 3.0 percent per degree Celsius) |
| Fixture Wear Sensitivity | High (parasitic contact inductance affects phase) | Moderate (voltage drop measurement driven) | Low (higher signal-to-noise ratio) |
Evaluating test fixture performance requires calculating the variance component contributed by the measurement apparatus against the total observed process variance. Tool wear corrupts baseline statistical data. Consider a high-volume cell line producing 21700 cylindrical cells with a target nominal 1 kHz AC resistance of 12.0 mOhm and an Upper Specification Limit set at 13.5 mOhm.
Standard deviation calculations on raw line data yield an observed process standard deviation of 0.35 mOhm.
AC internal resistance measurements executed at 1 kHz omit the charge transfer resistance component that dominates under real world pack discharge pulses.
Executing a ten-part, three-operator, three-trial Gauge R&R study isolates fixture repeatability and operator reproducibility variance. Assume the study isolates a fixture variance of 0.15 mOhm squared. Subtracting the measurement system variance from the total observed process variance isolates the true manufacturing process standard deviation at 0.316 mOhm.
When uncorrected measurement error enters statistical control formulas, the calculated capability index appears artificially depressed, leading quality engineers to overtune formation and aging steps without addressing physical probe cleaning cycles. Parasitic contact resistance contamination corrupts statistical control charts by shifting the sample mean upward and expanding the apparent moving range.
Measurement noise hides electrochemical degradation. Routine probe maintenance schedules incorporate automated contact resistance verification using gold-plated reference standard coupons every four hours. When contact resistance drift exceeds 0.05 mOhm, automated pneumatic contact cleaning cycles clear terminal oxidation debris.
Direct current pulse testing introduces additional contact heating effects. Passing a 30-Ampere pulse through a high-resistance contact point generates local joule heating, altering the electrolyte conductivity at the terminal interface during the test pulse itself. Fixture design rules mandate pneumatic clamp force verification between 15 N and 25 N per probe pin to maintain stable metallic contact without deforming soft aluminum cell terminals.
Failing to isolate probe contact resistance from true cell impedance leads directly to discarding conforming cell lots while passing defective cells with elevated internal degradation.


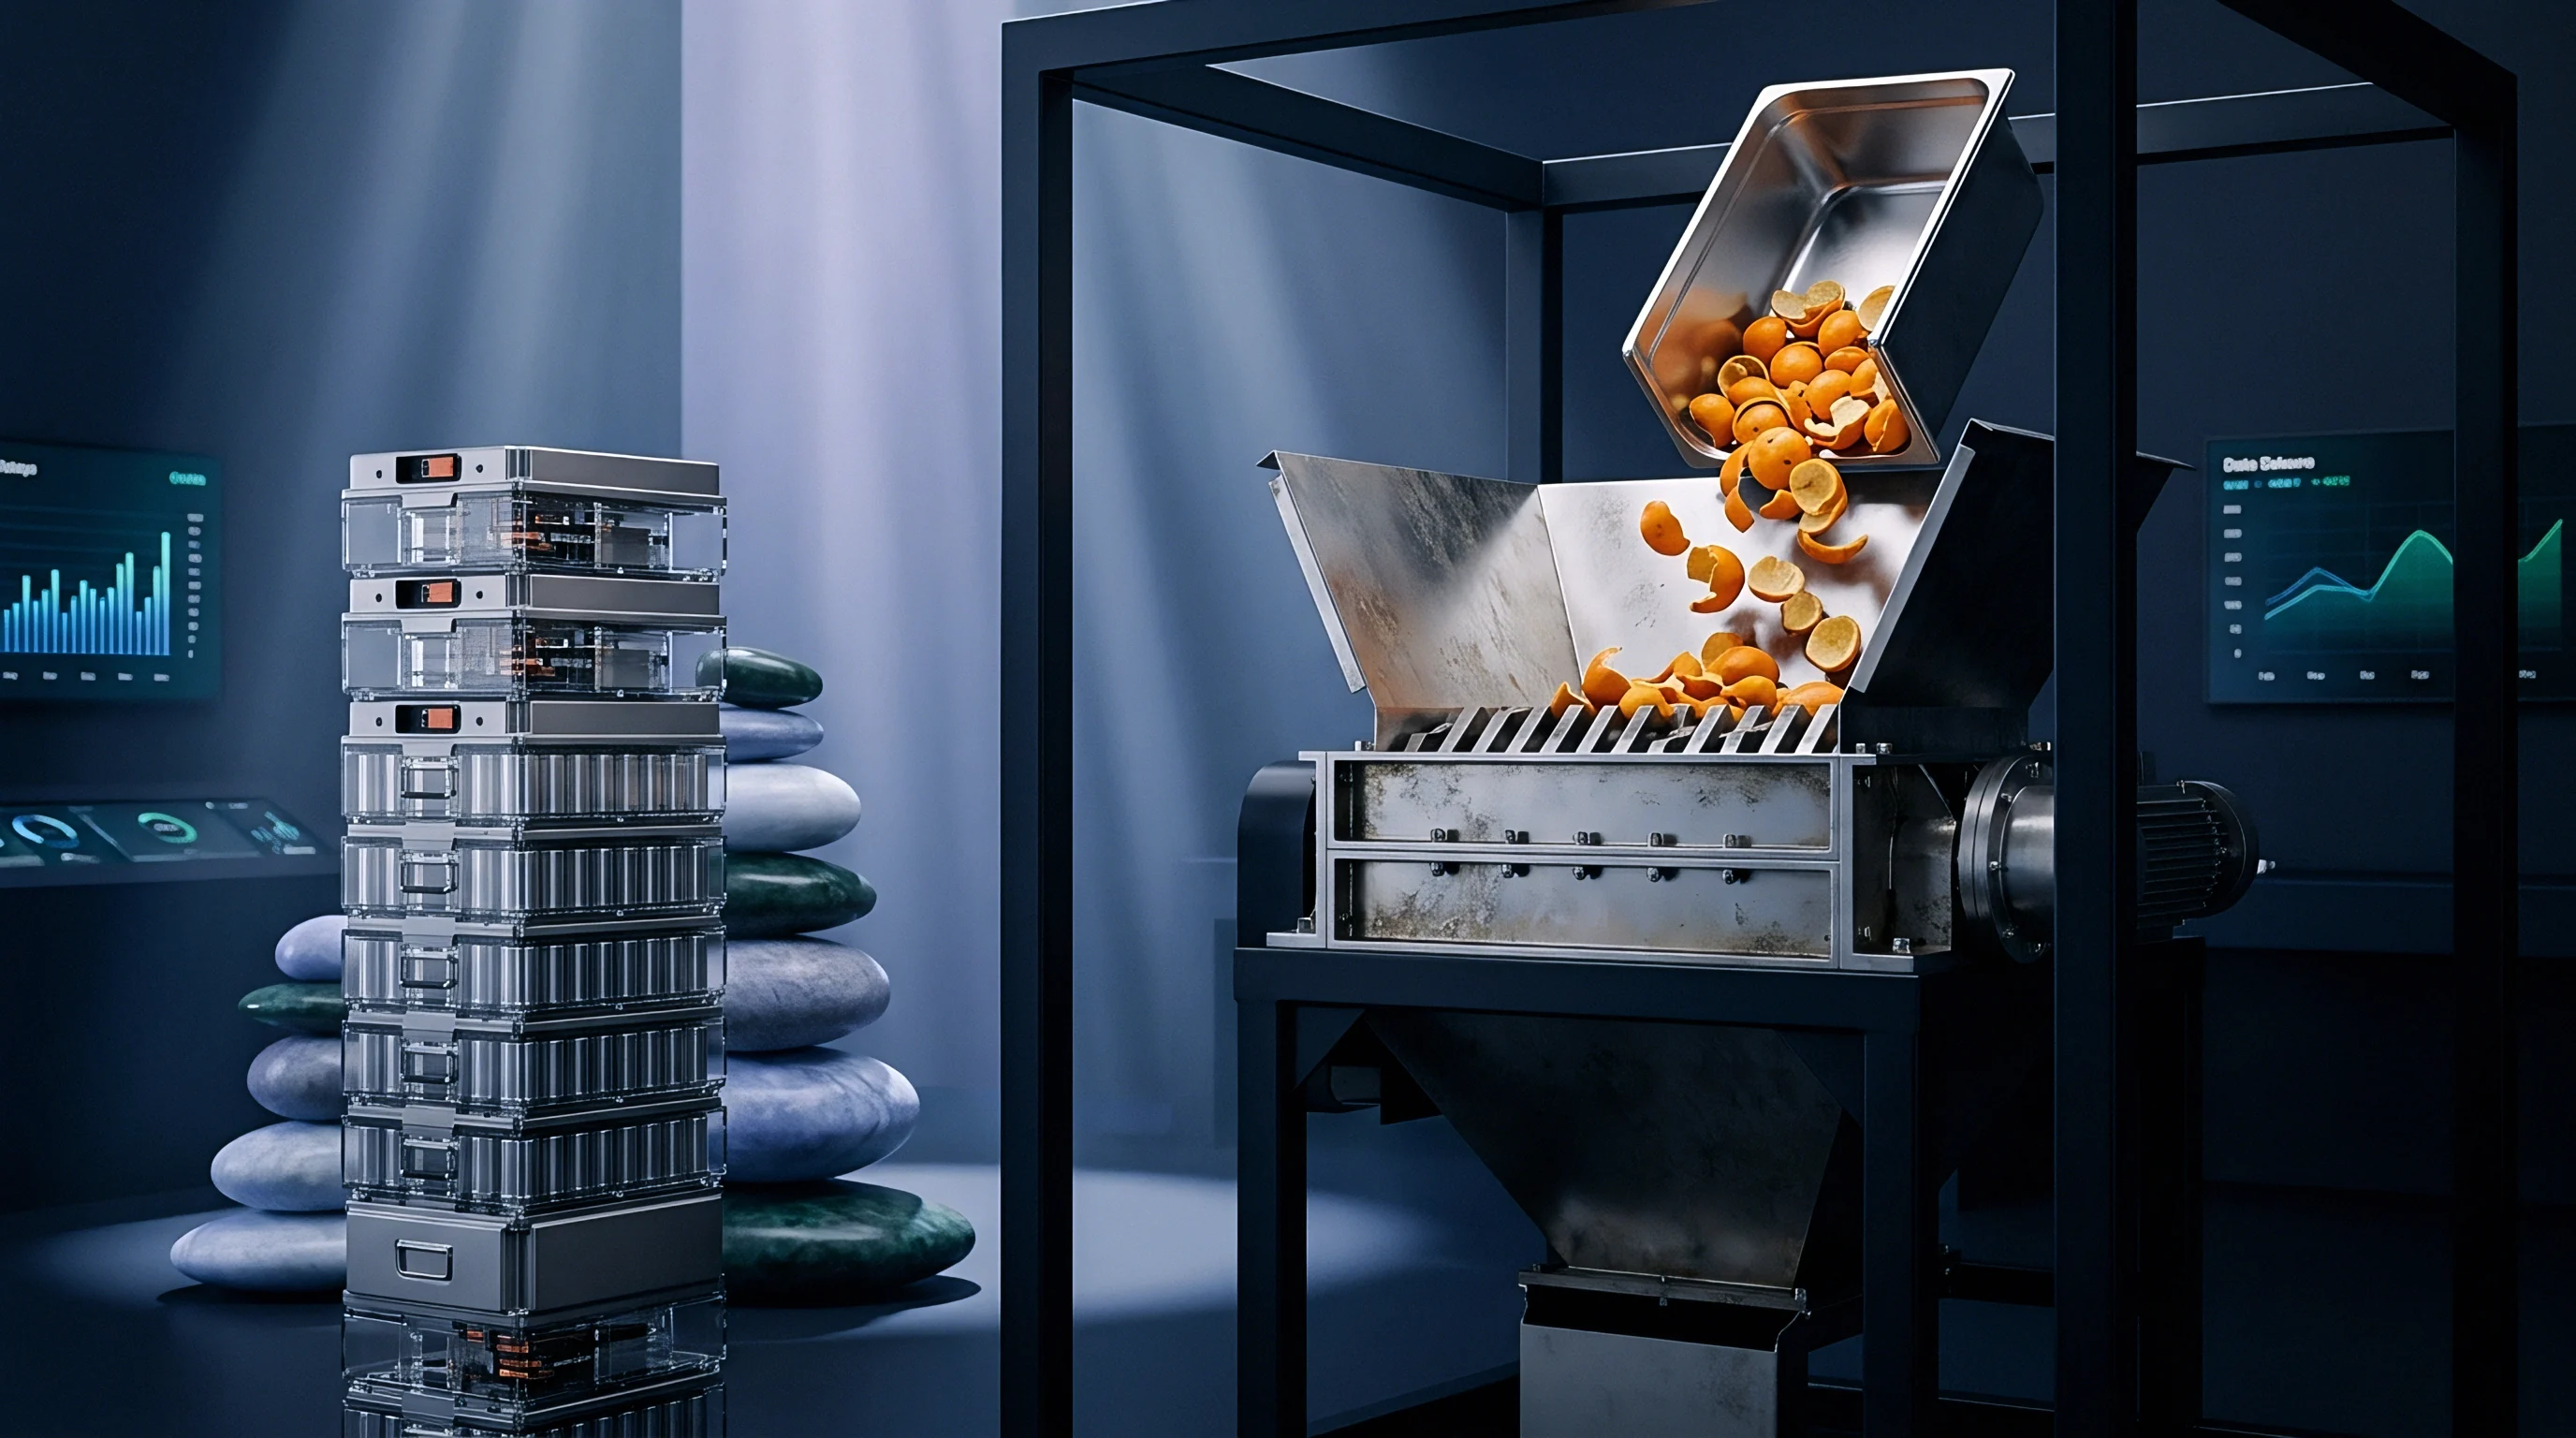
Skew
Electrochemical impedance distributions across mass-produced Lithium-ion cells rarely conform to symmetric Gaussian bell curves. High-volume cell manufacturing processes exhibit right-skewed internal resistance distributions. Physical factors driving this asymmetry include non-uniform electrolyte slurry coat weights, minor variations in separator pore tortuosity, uneven electrolyte wetting during formation, and subtle variations in ultrasonic tab weld surface areas.
While the bulk of production clusters tightly around the nominal target resistance, a distinct high-resistance tail extends toward the upper specification boundary.

Lognormal Tails in Cell Manufacturing
Applying standard parametric statistical quality control metrics like process capability indices to right-skewed resistance distributions introduces critical evaluation errors. Standard capability formulas assume an underlying normal distribution. When applied to positive-skew data, the standard sample mean sits to the right of the distribution peak, while the standard deviation overestimates probability density on the low-resistance side and underestimates probability density in the extreme high-resistance tail.
Raw data skew distorts statistical metrics. Outlier cells residing in the far-right tail carry elevated internal heating risks when assembled into multi-cell parallel strings. In parallel pack configurations, cells with lower internal resistance take a disproportionate share of transient current, while high-resistance tail cells generate excessive localized heating during heavy discharge pulses.
Non-parametric distribution evaluations and data transformations restore statistical rigor to inline quality screening.

Non Parametric Capacity Ratios
Transforming raw resistance data using the Box-Cox or Johnson transformation methods maps non-normal distributions onto a standard Gaussian curve before calculating formal process capability indices. The Box-Cox transformation applies a power parameter lambda to raw resistance values. Optimizing lambda maximizes the log-likelihood function, creating a transformed variable that passes standard normality tests such as Shapiro-Wilk or Anderson-Darling.
ISO 22514-2 requires explicit distribution fitting tests before calculating process capability indices on non-normal battery manufacturing data.
Alternatively, non-parametric process capability metrics replace sample mean and standard deviation with empirical percentiles. The non-parametric process capability ratio evaluates the distance between specification limits and actual population percentiles, specifically using the median alongside the 0.135th and 99.865th percentiles. Lognormal tails increase pack thermal spread.
| Distribution Profile | Parametric Cpk (Gaussian Assumption) | Box-Cox Transformed Cpk | Non-Parametric Capability (P0.135 / P99.865) | Predicted Outlier PPM (Upper Tail) |
|---|---|---|---|---|
| Symmetric Gaussian (Baseline Process) | 1.67 | 1.67 | 1.66 | 0.27 PPM |
| Right-Skewed Lognormal (Slurry Drift) | 1.42 (Invalid) | 1.18 | 1.15 | 340 PPM |
| Bimodal Distribution (Dual Line Blend) | 0.89 (Invalid) | 0.72 (Failed Fit) | 0.68 | 2100 PPM |
Process control engineers execute a strict sequence to qualify internal resistance data from new production lines before authorizing automated lot release:
- Data Collection ~ Gather raw 1 kHz AC impedance data from a minimum of 30 consecutive production batches containing at least 1,000 cells per batch under stabilized thermal conditions.
- Goodness-of-Fit Evaluation ~ Run Anderson-Darling tests on raw data; reject Gaussian assumptions if the test statistic p-value falls below 0.05.
- Transformation Optimization ~ Estimate the Box-Cox lambda parameter using maximum likelihood estimation to normalize the dataset.
- Capability Calculation ~ Calculate transformed capability indices and compare calculated non-parametric percentile limits against customer pack engineering limits.
When raw cell internal resistance measurements show right-side tailing, non-parametric percentile boundaries offer safer batch acceptance limits than standard normal capability calculations.

Threshold
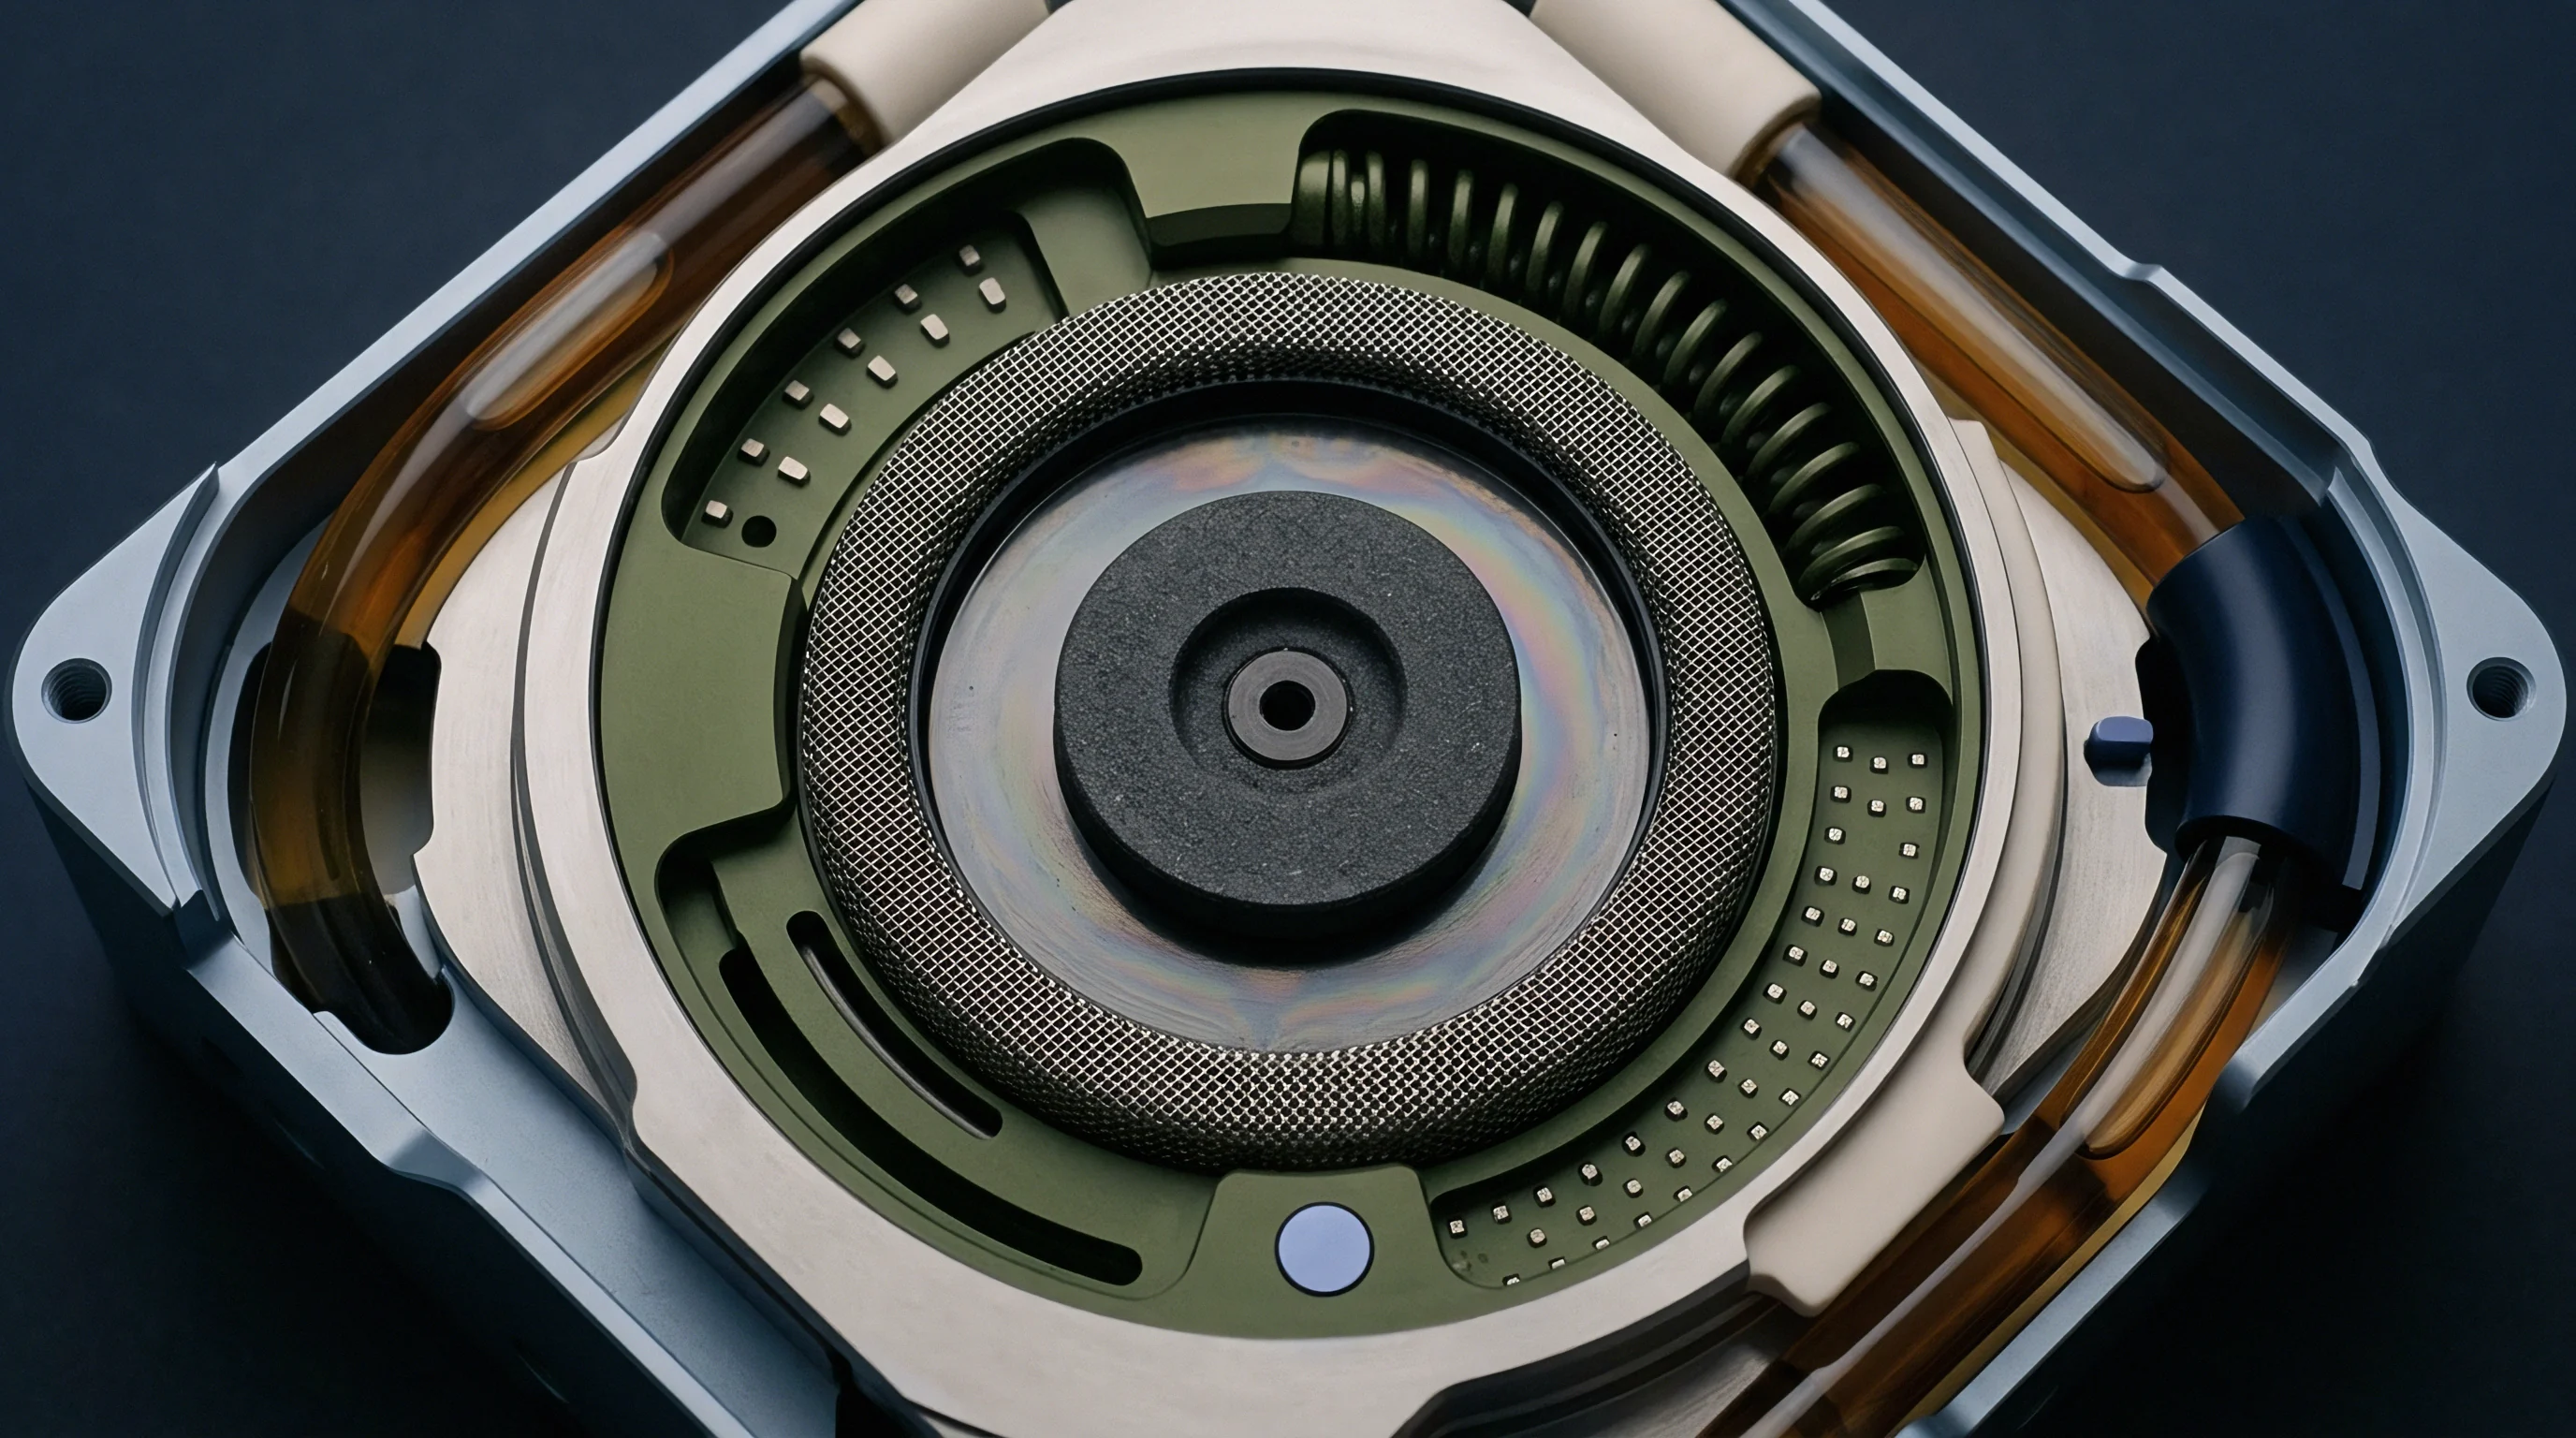
Establishing statistical limits requires a rigorous mathematical boundary separating natural process variation from assignable causes. Statistical process control limits must not be confused with customer engineering specification limits. Engineering specifications define the physical boundaries within which a battery cell operates safely and meets performance targets over its warranty lifespan.
Statistical control limits reflect the inherent natural variation of the active manufacturing process when operating in a state of statistical control.

Control Limits versus Specification Boundaries
Setting Upper Control Limits (UCL) and Lower Control Limits (LCL) on internal resistance tracking charts involves calculating boundaries from moving ranges or batch sample standard deviations. In automated screening, control limits are placed three standard deviations above and below the process mean for Gaussian data, or at corresponding empirical percentile boundaries for skewed distributions. Upper Specification Limits (USL) arrive from thermal stack-up modeling and maximum allowable pack voltage drop calculations.
Outliers undermine automated stack sorting operations. When a process operates with high capability, the Upper Control Limit sits well below the Upper Specification Limit. If an individual cell breaches the Upper Control Limit while remaining below the Upper Specification Limit, the cell meets performance requirements but indicates an underlying process anomaly.
Screening architectures remove these upper control limit excursion cells to protect module consistency.

Does Non Parametric Capability Predict Module Thermal Spread?
Statistical control metrics directly predict temperature uniformity across assembled battery modules during fast-charging operations. High internal resistance cells convert electrical energy into heat through joule heating proportional to current squared times resistance. In a series-connected module carrying an identical current pulse through every cell, variance in internal resistance directly translates into localized temperature differences.
Calculating the predicted thermal spread across a module relies on the upper percentile values of the internal resistance distribution. A module constructed from cells exhibiting a wide right-hand resistance tail develops thermal gradients exceeding ten degrees Celsius under 3C fast charge conditions. Localized heating accelerates solid electrolyte interphase layer growth on high-resistance cells, driving capacity fade divergence and prematurely triggering battery management system thermal throttling.
- Extract raw 1 kHz AC impedance values from inline tester buffer.
- Apply ambient temperature correction factor based on continuous contact temperature sensor inputs.
- Evaluate individual value against upper and lower statistical control thresholds.
- Execute double-pulse 100 ms DC resistance measurement on cells falling within five percent of upper control limit.
- Divert cells exceeding absolute upper statistical thresholds to secondary diagnostic bins.
- Update real-time moving average and range charts for the active production lot.
Statistical limits enforce strict batch rejection criteria. Modified Western Electric rules trigger automated line halts when eight consecutive cells fall on one side of the central mean, or when two out of three consecutive cells exceed two-sigma upper control limits. Early detection of process shift prevents thousands of marginal cells from populating downstream module assembly buffers.
Cell manufacturers frequently argue that minor control limit excursions during formation sorting represent transient equipment noise rather than underlying electrochemical drift in the batch.


Shift
Long-term production runs across tens of thousands of cell lots reveal continuous mean movements caused by raw material batch variance and line wear. Internal resistance is exceptionally sensitive to subtle changes in raw material chemistry and plant environmental conditions. Ambient temperature shifts inside formation and aging rooms alter electrolyte viscosity and ion mobility during testing, artificially moving observed resistance distribution medians.
Thermal Coefficient Corrections in High Speed Line Verification
Temperature variation skews resistance statistics. Battery cell internal resistance exhibits a negative thermal coefficient, decreasing by roughly 1.5 to 3.0 percent for every one degree Celsius increase in cell temperature. Inline inspection stations operating without thermal compensation record artificial resistance shifts as factory ambient temperatures rise from morning to afternoon.
Uncorrected temperature shifts obscure genuine manufacturing drift. Advanced automated screening stations integrate infrared pyrometers or contact thermocouples to record cell casing temperatures simultaneously with impedance measurements. Algorithms normalize raw resistance values to a standardized reference temperature of 25.0 degrees Celsius using dynamic Arrhenius thermal correction factors before passing data to statistical control algorithms.
Uncompensated cell temperature variations of three degrees Celsius during test execution induce artificial resistance spread exceeding the intrinsic process standard deviation.
Formation channel calibration drifts over time. Physical sources driving true, uncorrected internal resistance shifts across consecutive manufacturing batches include:
- Slurry Viscosity Variations ~ Mixing ratio fluctuations altering carbon black conductive network dispersion within cathode coatings.
- Calendering Compression Density Drift ~ Roll deformation changing electrode porosity and active material electronic contact resistance.
- Electrolyte Filling Mass Shifts ~ Automated dosing pump calibration wear resulting in variable electrolyte volume fraction within porous separators.
- Collector Foil Surface Oxidation ~ Storage humidity shifts causing thin oxide layers on current collector copper or aluminum raw material rolls.
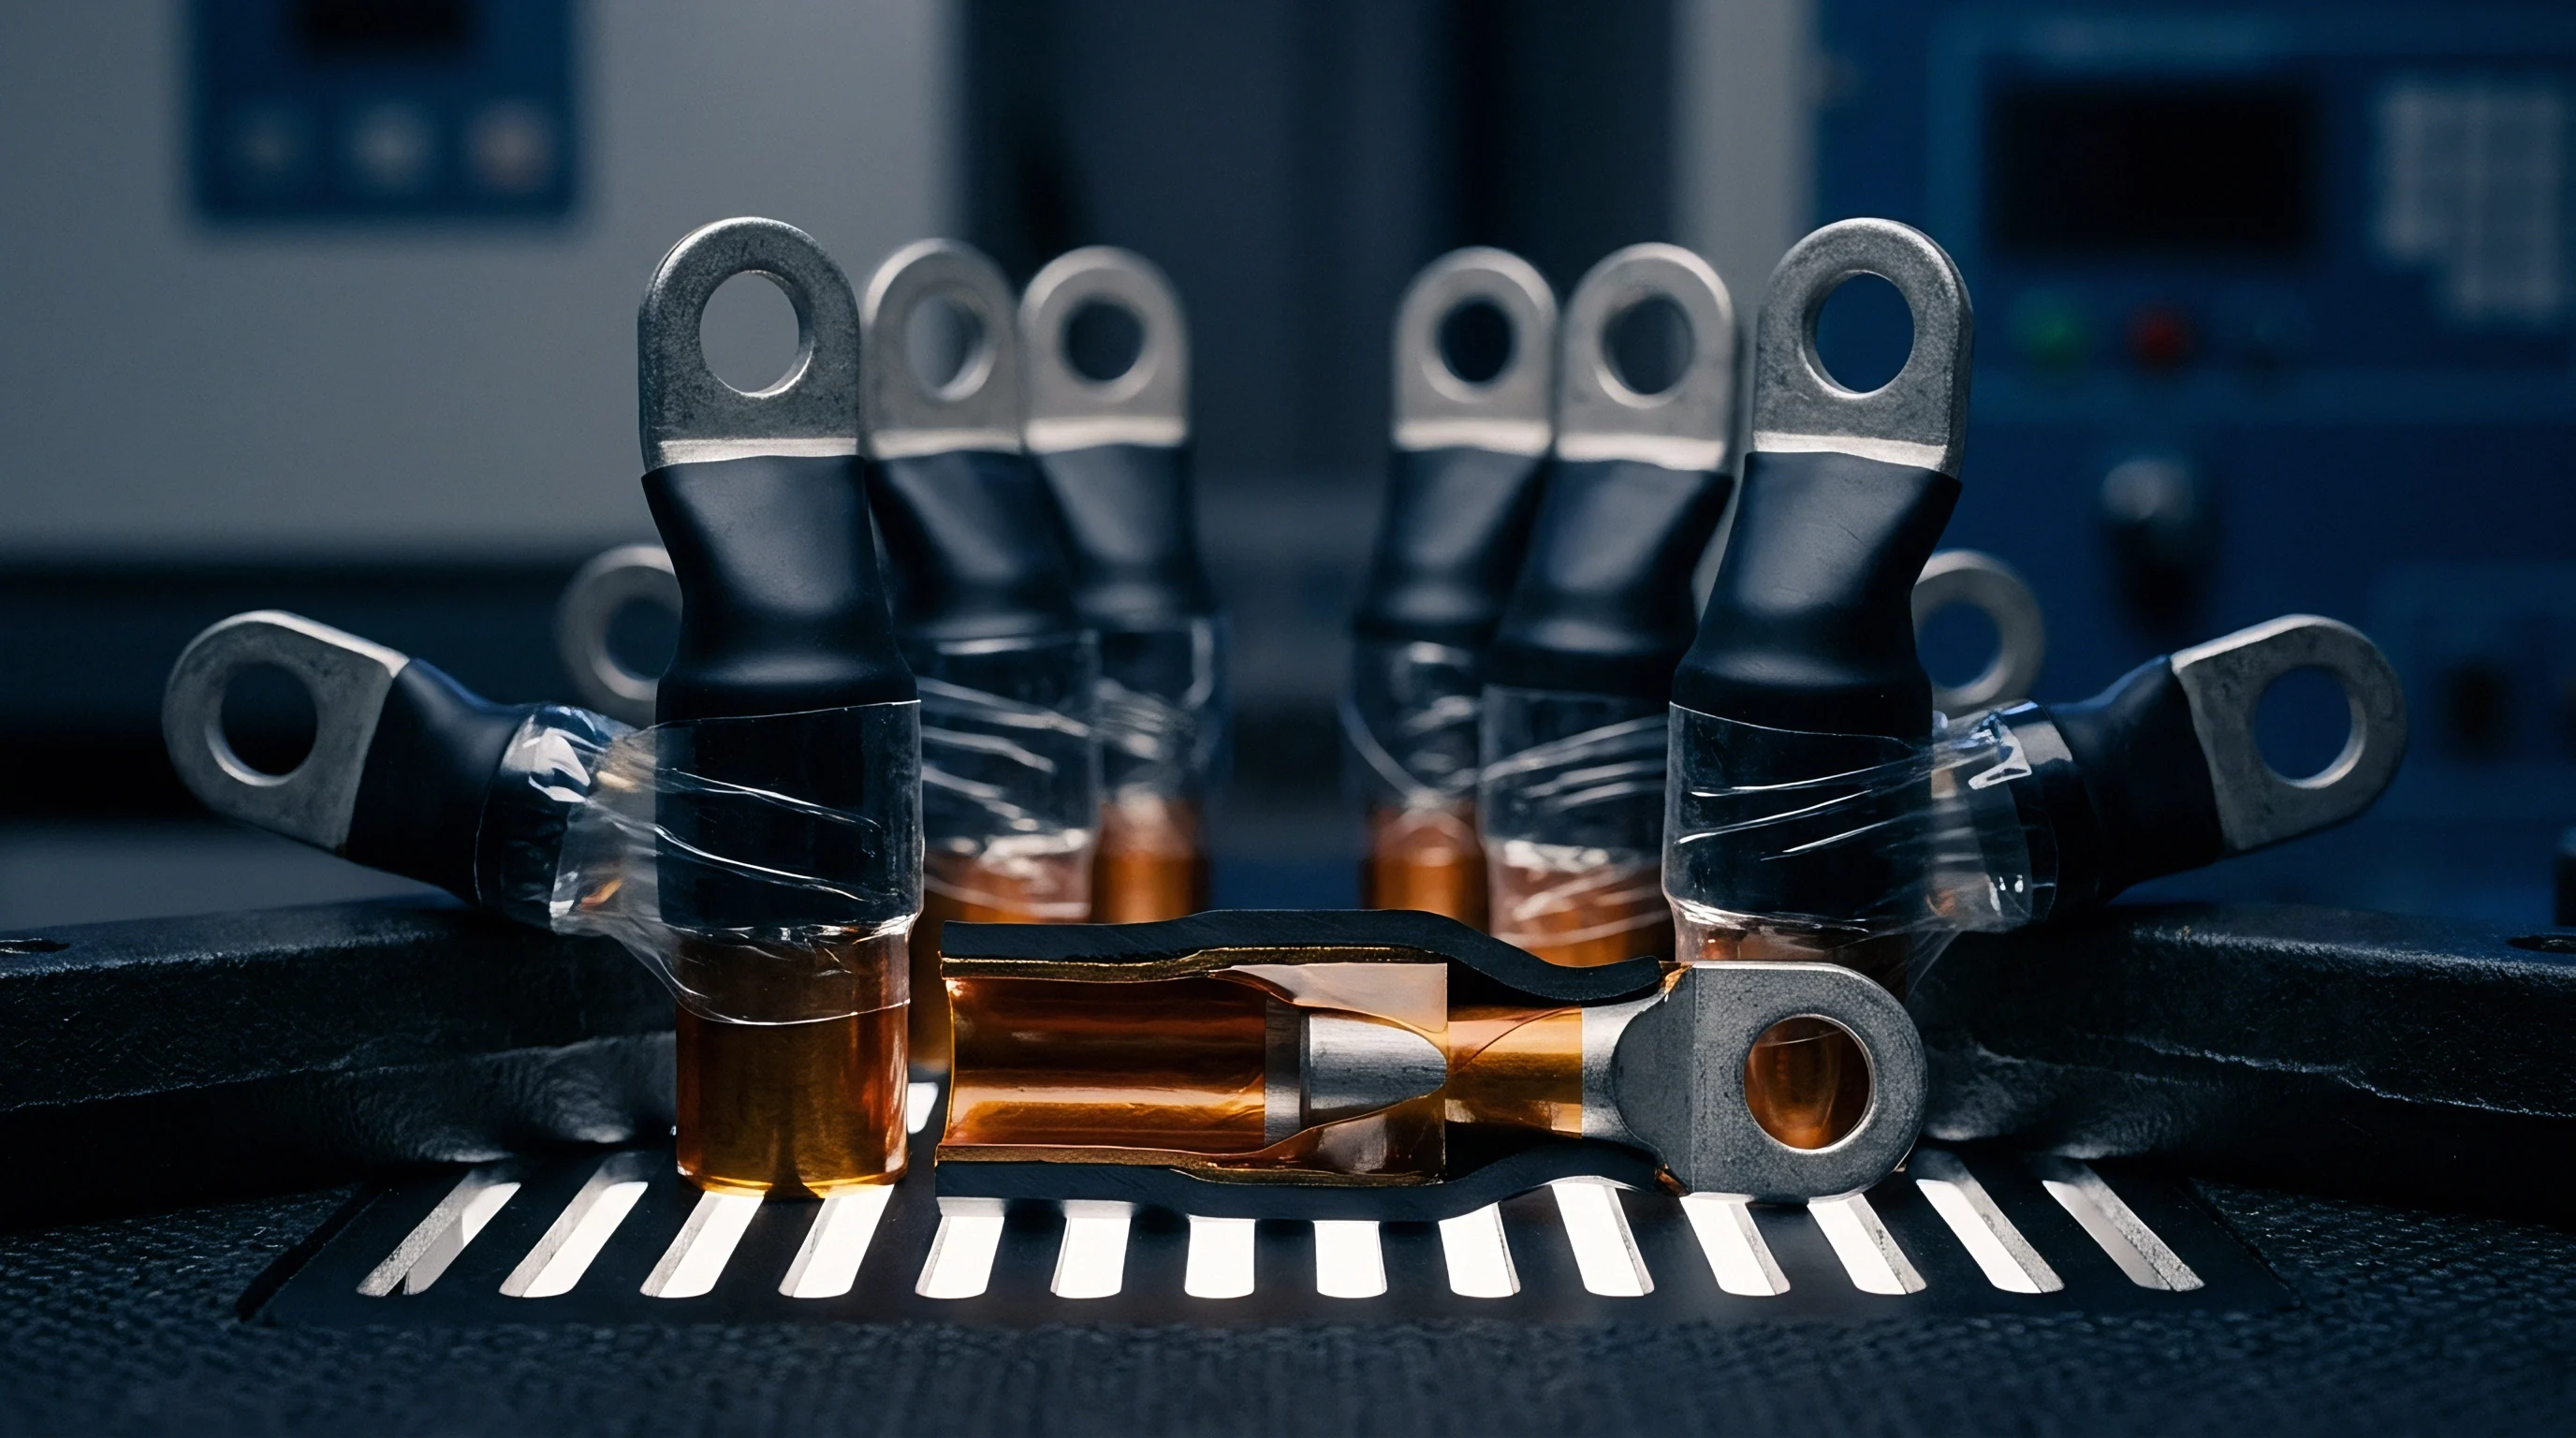
- Ultrasonic Weld Tool Degradation ~ Horn tip wear reducing active contact area and grain consolidation at multi-layer tab joints.
Cumulative Variance Tracking across Formation Batches
Detecting gradual process shifts requires statistical techniques sensitive to small, persistent mean changes that standard Shewhart charts miss. Exponentially Weighted Moving Average (EWMA) and Cumulative Sum (CUSUM) control charts track subtle resistance mean movements as small as 0.2 standard deviations. CUSUM charts accumulate deviations from target nominal resistance over consecutive sub-lots, displaying a steep slope when the true process mean shifts.
Batch rejection halts assembly line flow. Incorporating CUSUM tracking into high-volume lines enables early intervention before resistance drift causes mass rejection at final grading. When EWMA signals a statistically significant upward trend, process engineers adjust calendering gap distances or initiate mixing equipment maintenance before cell lots breach upper capability limits.
| Chart Type | Primary Target Shift Size | Detection Speed (Average Run Length) | Computational Complexity | Primary Production Application |
|---|---|---|---|---|
| Standard Shewhart X-bar / R | Large Shifts (Greater than 1.5 Sigma) | Fast for large spikes; slow for subtle drift | Low | Immediate real-time single-cell outlier reject |
| EWMA (Weighting Lambda = 0.2) | Small to Moderate Shifts (0.5 to 1.5 Sigma) | Optimal balance across continuous runs | Moderate | Shift-to-shift electrolyte dosing tracking |
| CUSUM (Target Slack k = 0.5) | Persistent Small Shifts (0.2 to 1.0 Sigma) | Fastest detection of sustained micro-shifts | Moderate | Multi-week raw material roll batch tracking |
It remains uncertain whether long-term electrolyte decomposition or physical current collector contact relaxation drives the subtle multi-week resistance mean drift observed across consecutive production shifts.


Contract
Translating statistical distribution metrics into legally enforceable procurement specifications locks down cell quality before container shipment. Cell supply agreements that specify only absolute upper and lower resistance limits expose pack integrators to severe quality risks. A cell supplier can deliver a shipment that technically meets absolute limits while containing a heavily skewed, high-variance distribution that undermines downstream module balancing.

Statistical Clauses in Cell Supply Agreements
Re-inspection adds significant non-value cost. Rigorous battery procurement contracts define explicit process capability thresholds alongside statistical sampling criteria. Contracts mandate that every delivered production lot achieve a minimum Box-Cox transformed process capability index (Cpk) of 1.67 for 1 kHz AC internal resistance, alongside a minimum Cpk of 1.33 for 10-second DC pulse resistance.
Tight limits reduce field warranty liability. Contracts enforce Acceptable Quality Level (AQL) boundaries under ISO 2859-1 sampling plans. For critical internal resistance parameters, buyers enforce Zero Acceptance Sampling plans (C=0), where detection of a single cell exceeding statistical upper control limits in a lot sample results in immediate rejection of the entire master shipment.

Landed Cost Impact of Tight Variance Specification
Demanding narrow internal resistance distributions carries direct commercial trade-offs. Cell manufacturers charge premium unit prices when buyers specify tight resistance standard deviations or elevated capability index requirements. Over-specifying resistance variance forces the manufacturer to increase internal scrap allowances or implement manual secondary cell sorting, amortizing yield loss costs into the unit cell price.
Sorting friction inflates battery cell cost. A comprehensive landed-cost model balances cell price premiums against downstream pack manufacturing overhead. Incorporating automated pack-level cell binning on the module assembly line adds tooling capital expenditure and cycle time floor space, but allows acceptance of wider supplier distribution bands.
Statistical caps protect long-term pack life. Yield loss risk shifts between supplier and buyer based on contract framing. Process capability dictates final pack yield.
When contracts tie lot acceptance to non-parametric percentile limits measured at incoming receiving inspection, the financial burden of sorting, rework, and scrap returns sits firmly with the cell manufacturer.
The standard procurement specification dictates that incoming cell lots exhibiting a non-parametric upper tail percentile (P99.9) exceeding nominal median resistance by more than fifteen percent shall be subject to full lot quarantine and mandatory supplier-funded re-screening under IEC 62660-1 test guidelines.