High Precision in Situ Structural Deflection Mapping in Commercial Battery Testing Tooling
In situ deflection mapping decouples test tooling flexure from cell swelling to restore true electrochemical capacity and volumetric degradation profiles.

Strain
Structural deformation inside commercial battery compression fixtures introduces unrecorded variations in pack pressure. During high state-of-charge operation with high-capacity pouch, prismatic, or constrained cylindrical cells, internal swelling forces often exceed tens of kilonewtons. Standard test frames and fixtures, built to act as rigid boundaries, give way under these loads.
Platen flexure, tie-rod elongation, and load cell compliance together shift the mechanical boundary conditions surrounding the cell. If tooling yields by even fifty micrometers under a ten kilonewton load, the cell undergoes unmodeled volumetric relaxation. That drop in localized internal pressure artificially delays electrolyte squeeze-out, alters separator pore tortuosity, and shifts interfacial contact resistance between electrode stacks and current collectors.
As a result, measurements of cycle life, thermal runaway propagation thresholds, and C-rate capabilities taken in compliant fixtures diverge from true performance inside rigid pack enclosures.
In situ structural deflection mapping resolves this discrepancy by tracking real-time tooling displacement during electro-thermal cycling. Optical, capacitive, and strain-gauge transducer networks measure localized distortion under actual thermal and mechanical loads instead of assuming infinite fixture stiffness. Subtracting fixture deflection vectors from raw position measurements reveals the uncorrupted volumetric growth profile of the cell.
This correction is essential for silicon-composite anodes and thick high-energy cathode coatings. Silicon active materials expand by over two hundred percent at the particle level during lithiation, driving bulk thickness increases of five to fifteen percent across extended cycling. Isolating cell dimensions from tooling flexure lets engineers separate elastic electrode breathing from irreversible degradation like solid electrolyte interphase growth or lithium plating.
Mechanics of Fixture Compliance during Swelling Cycles
Lithium-ion cells expand during intercalation, pushing against enclosure walls with thousands of newtons of force. Standard test rigs clamp cells between opposing steel or aluminum plates tied together with threaded steel rods. As charging inserts lithium ions into the host lattice, unit cell expansion generates macroscopic swell pressure that bends the clamping plates across their span.
At the same time, tie-rods stretch elastically along their length and thread contact points undergo micro-yield and settling.
Flexure in the testing tooling corrupts lifetime degradation models.
A standard ten-millimeter aluminum end-platen spanning a large-format prismatic cell bows noticeably even under a baseline preload of zero point three megapascals. When fast charging drives internal stack pressure past two megapascals, center deflection on an unreinforced platen frequently exceeds one hundred and fifty micrometers. While rigid tie-rod anchors hold the cell perimeter tight, the center of the cell face expands into the bowed cavity.
This uneven displacement creates sharp stack pressure gradients across the cell, leaving the core less constrained than the edges and encouraging localized lithium plating and accelerated capacity fade along the center axis.
Significant platen tilt occurs during rapid high-C rate charging cycles.
| Component Assembly | Material & Geometry | Deflection at 0.5 MPa (µm) | Deflection at 1.5 MPa (µm) | Deflection at 3.0 MPa (µm) | Primary Compliance Mode |
|---|---|---|---|---|---|
| Standard End Platen | 6061-T6 Aluminum, 12 mm | 18.4 ± 1.2 | 58.2 ± 3.1 | 124.6 ± 6.8 | Flexural Bending (Center Bowing) |
| Reinforced End Platen | 316 Stainless Steel, 20 mm | 4.1 ± 0.3 | 12.8 ± 0.7 | 26.5 ± 1.4 | Flexural Bending |
| Tie-Rod Set (4x M10) | Class 8.8 Alloy Steel, 250 mm | 6.2 ± 0.4 | 18.7 ± 0.9 | 37.4 ± 1.8 | Elastic Axial Elongation |
| In-Line Button Load Cell | Tool Steel Case, 50 kN Rating | 8.5 ± 0.5 | 25.5 ± 1.2 | 51.0 ± 2.2 | Internal Strain Gauge Element Elasticity |
| Threaded Fastener Interfaces | Standard Helicoil Inserts | 12.0 ± 2.1 | 28.4 ± 4.5 | 42.1 ± 5.9 | Micro-Yield and Thread Settling |
Component-level compliance measurements show that fixture displacement rarely tracks applied load linearly. Threaded joints show initial non-linear compliance caused by surface roughness and engagement tolerances. Once preloads pass ten kilonewtons, platen bending becomes the main source of measurement error, skewing capacity retention curves if uncompensated.

Mapping Thermal Expansion against Mechanical Compression
Temperature shifts inside test chambers alter the dimensions of the cell body and the metallic clamping plates at the same time. Testing protocols often require wide thermal sweeps, from minus twenty degrees Celsius in cold performance evaluations to sixty degrees Celsius during elevated-temperature aging. With thermal expansion coefficients of twenty-three microstrain per Kelvin for aluminum and twelve for steel, thermal cycling introduces marked dimensional drift into the tooling itself.
Thermal gradients further exacerbate local elastic displacement in the fixture.
In a steel test fixture with a two-hundred-millimeter grip length, heating from twenty to sixty degrees Celsius expands the tie-rods by ninety-six micrometers. If the cell expands slower than the steel frame, effective clamping preload drops and relaxes stack pressure. If the cell expands faster than the frame, preload spikes beyond allowable stress limits, risking structural failure of the separators.
Isolating thermal tooling expansion from electrochemical swelling requires continuous, spatially resolved temperature and displacement tracking across the fixture.
- Platen Flexural Fatigue Cumulative micro-yield across aluminum platens under cyclic swelling loads creates permanent baseline bowing, continuously shifting stack boundary conditions.
- Tie-Rod Elastic Elongation Dynamic force spikes during high-rate intercalation stretch supporting fasteners, lowering effective clamp stiffness during peak swelling events.
- Thread Interface Creep Settling along thread engagements in unlocked mechanical fasteners causes steady preload decay over multi-month test runs.
- Thermal Expansion Mismatch Differential expansion between metallic clamps and composite battery stacks introduces unquantified pressure shifts during thermal sweeps.
- Load Cell Contact Non-Linearity Spherical load buttons undergo point-contact elastic deformation, introducing hysteresis into displacement measurements under changing swell forces.
A test fixture that yields elastically under swelling loads alters the electrochemical boundary conditions of the cell under test.
Quantifying compliance requires mapping fixture motion across the full range of operational temperatures and stack forces. Without this baseline, displacement transducers mounted to external walls record a combined signal of battery expansion and frame flexure. Isolating battery dimensional changes requires subtracting the calibrated tooling deformation tensor from raw channel outputs in real time.
Omitting this step leaves swelling coefficients corrupted, leading engineers to specify inadequate module clearances and incorrect end-of-life pressure targets.
Platen
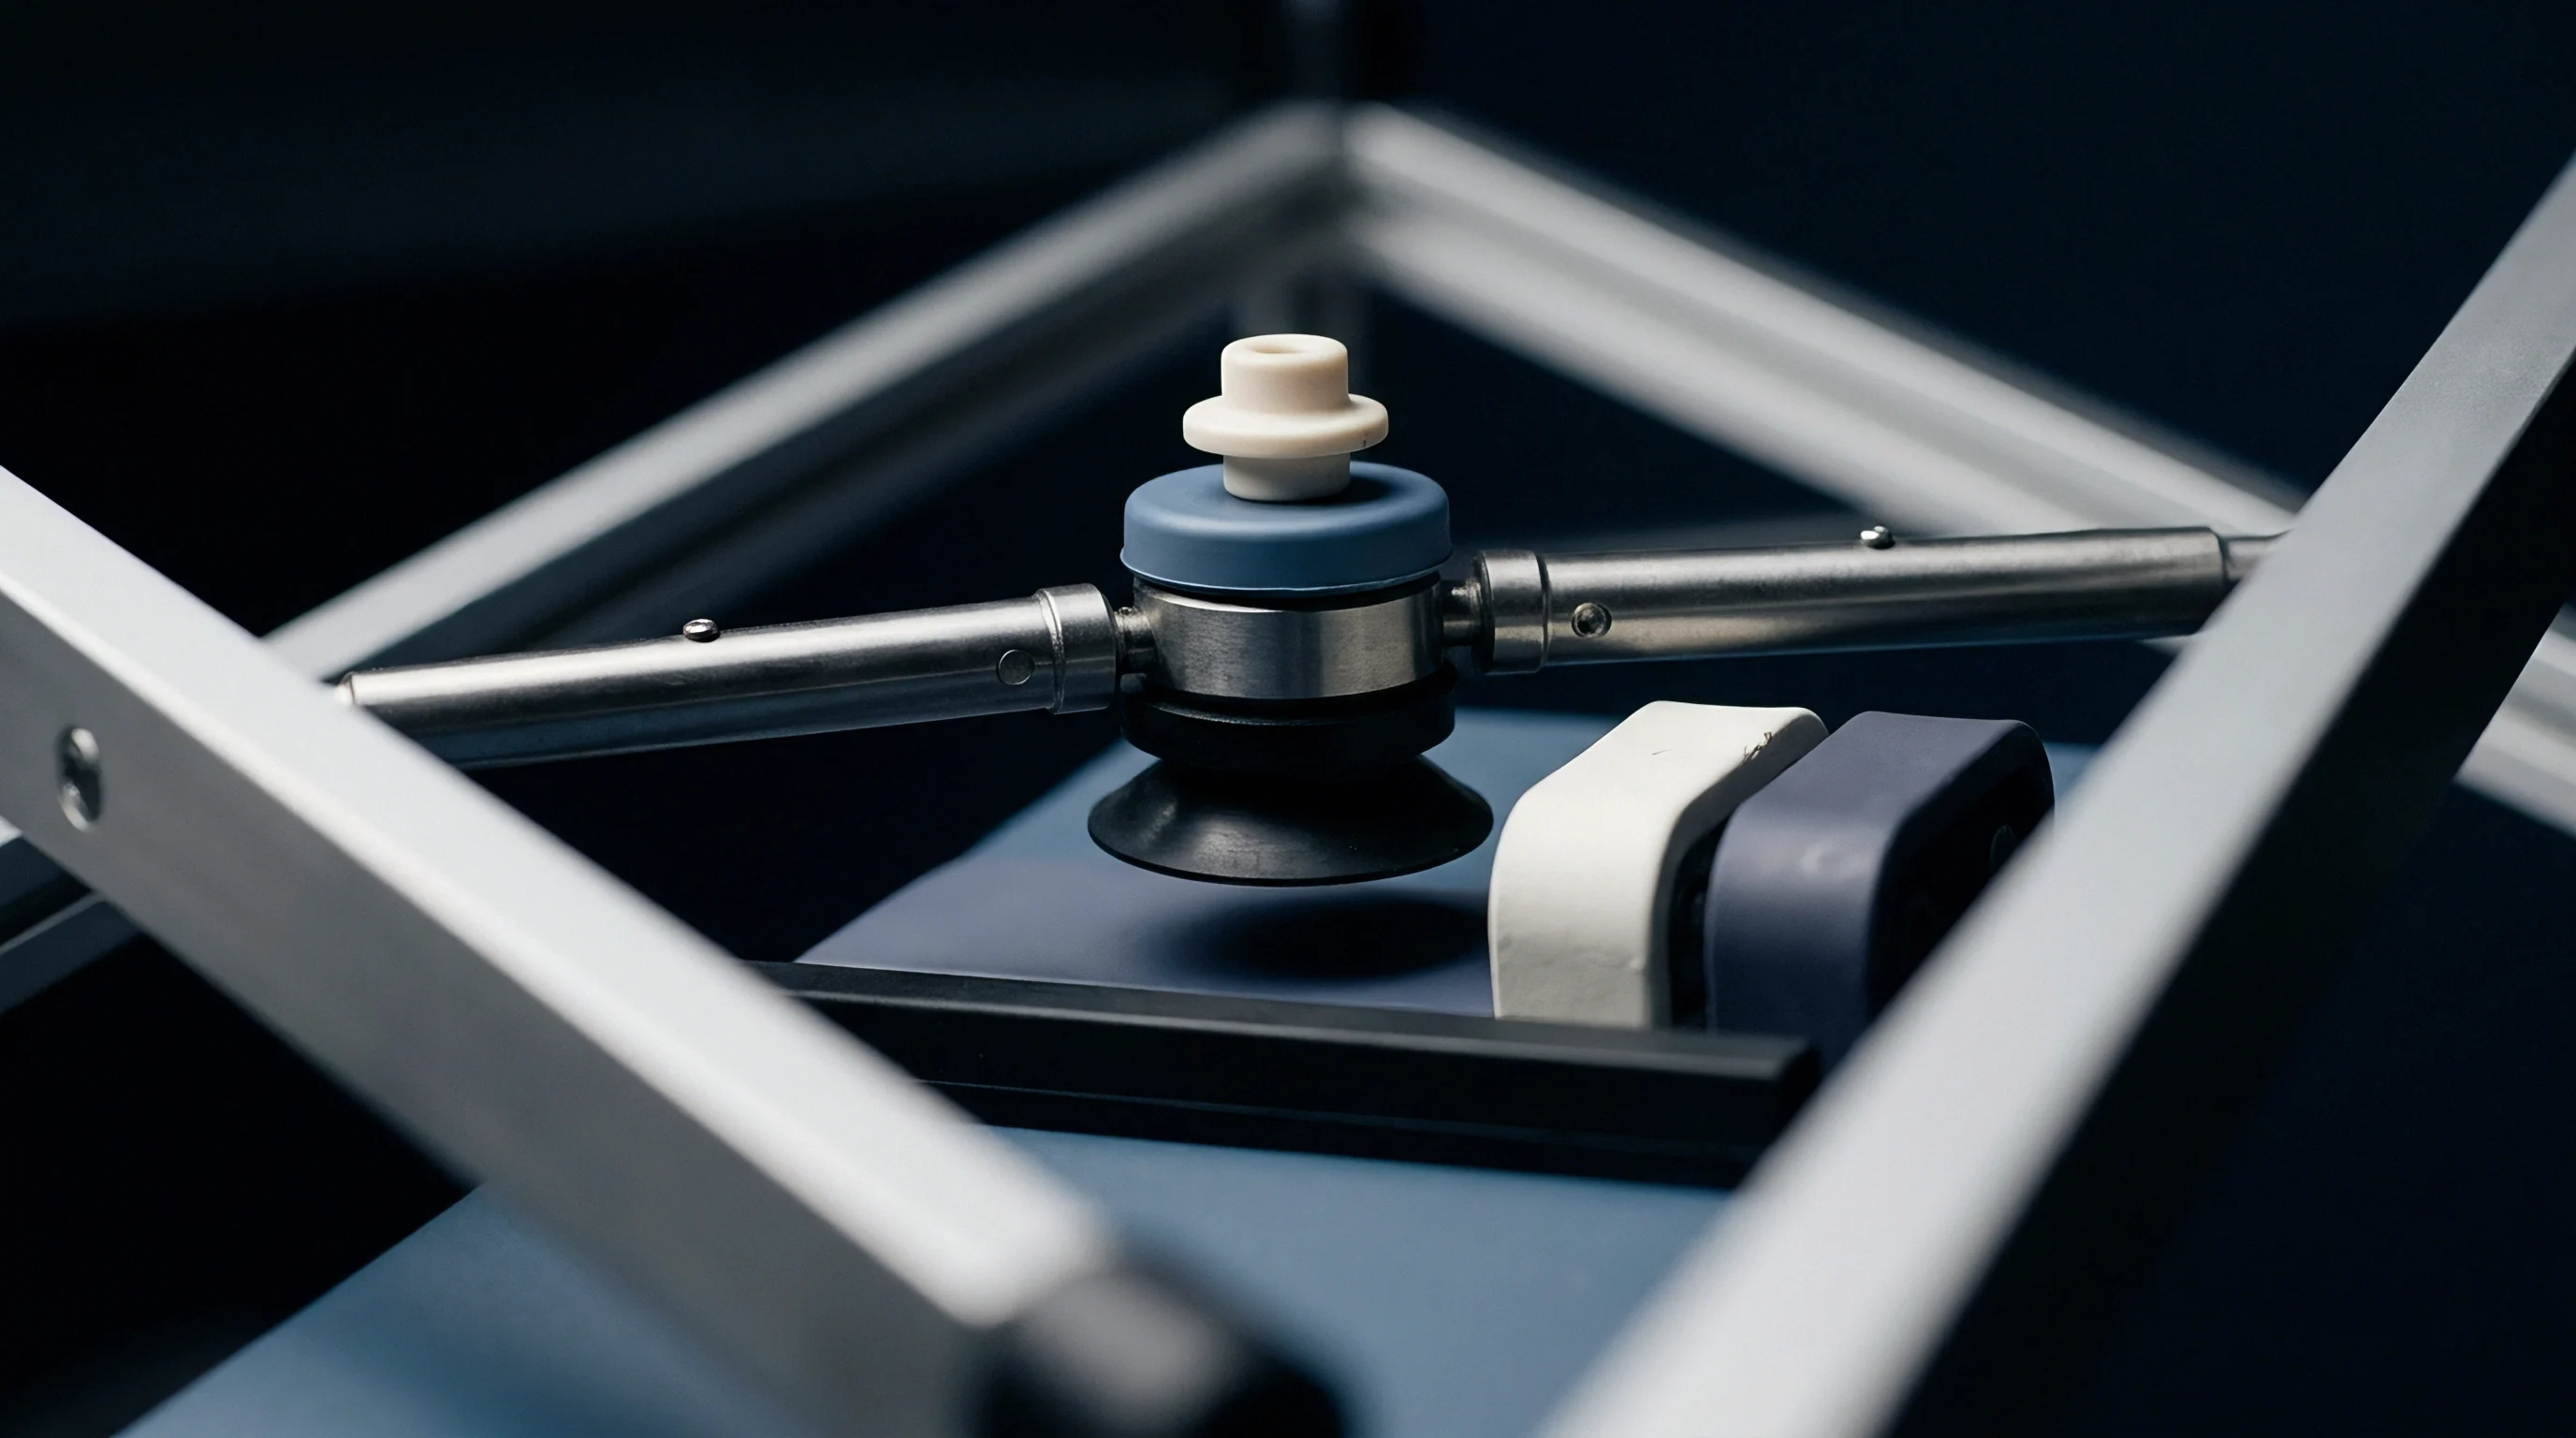
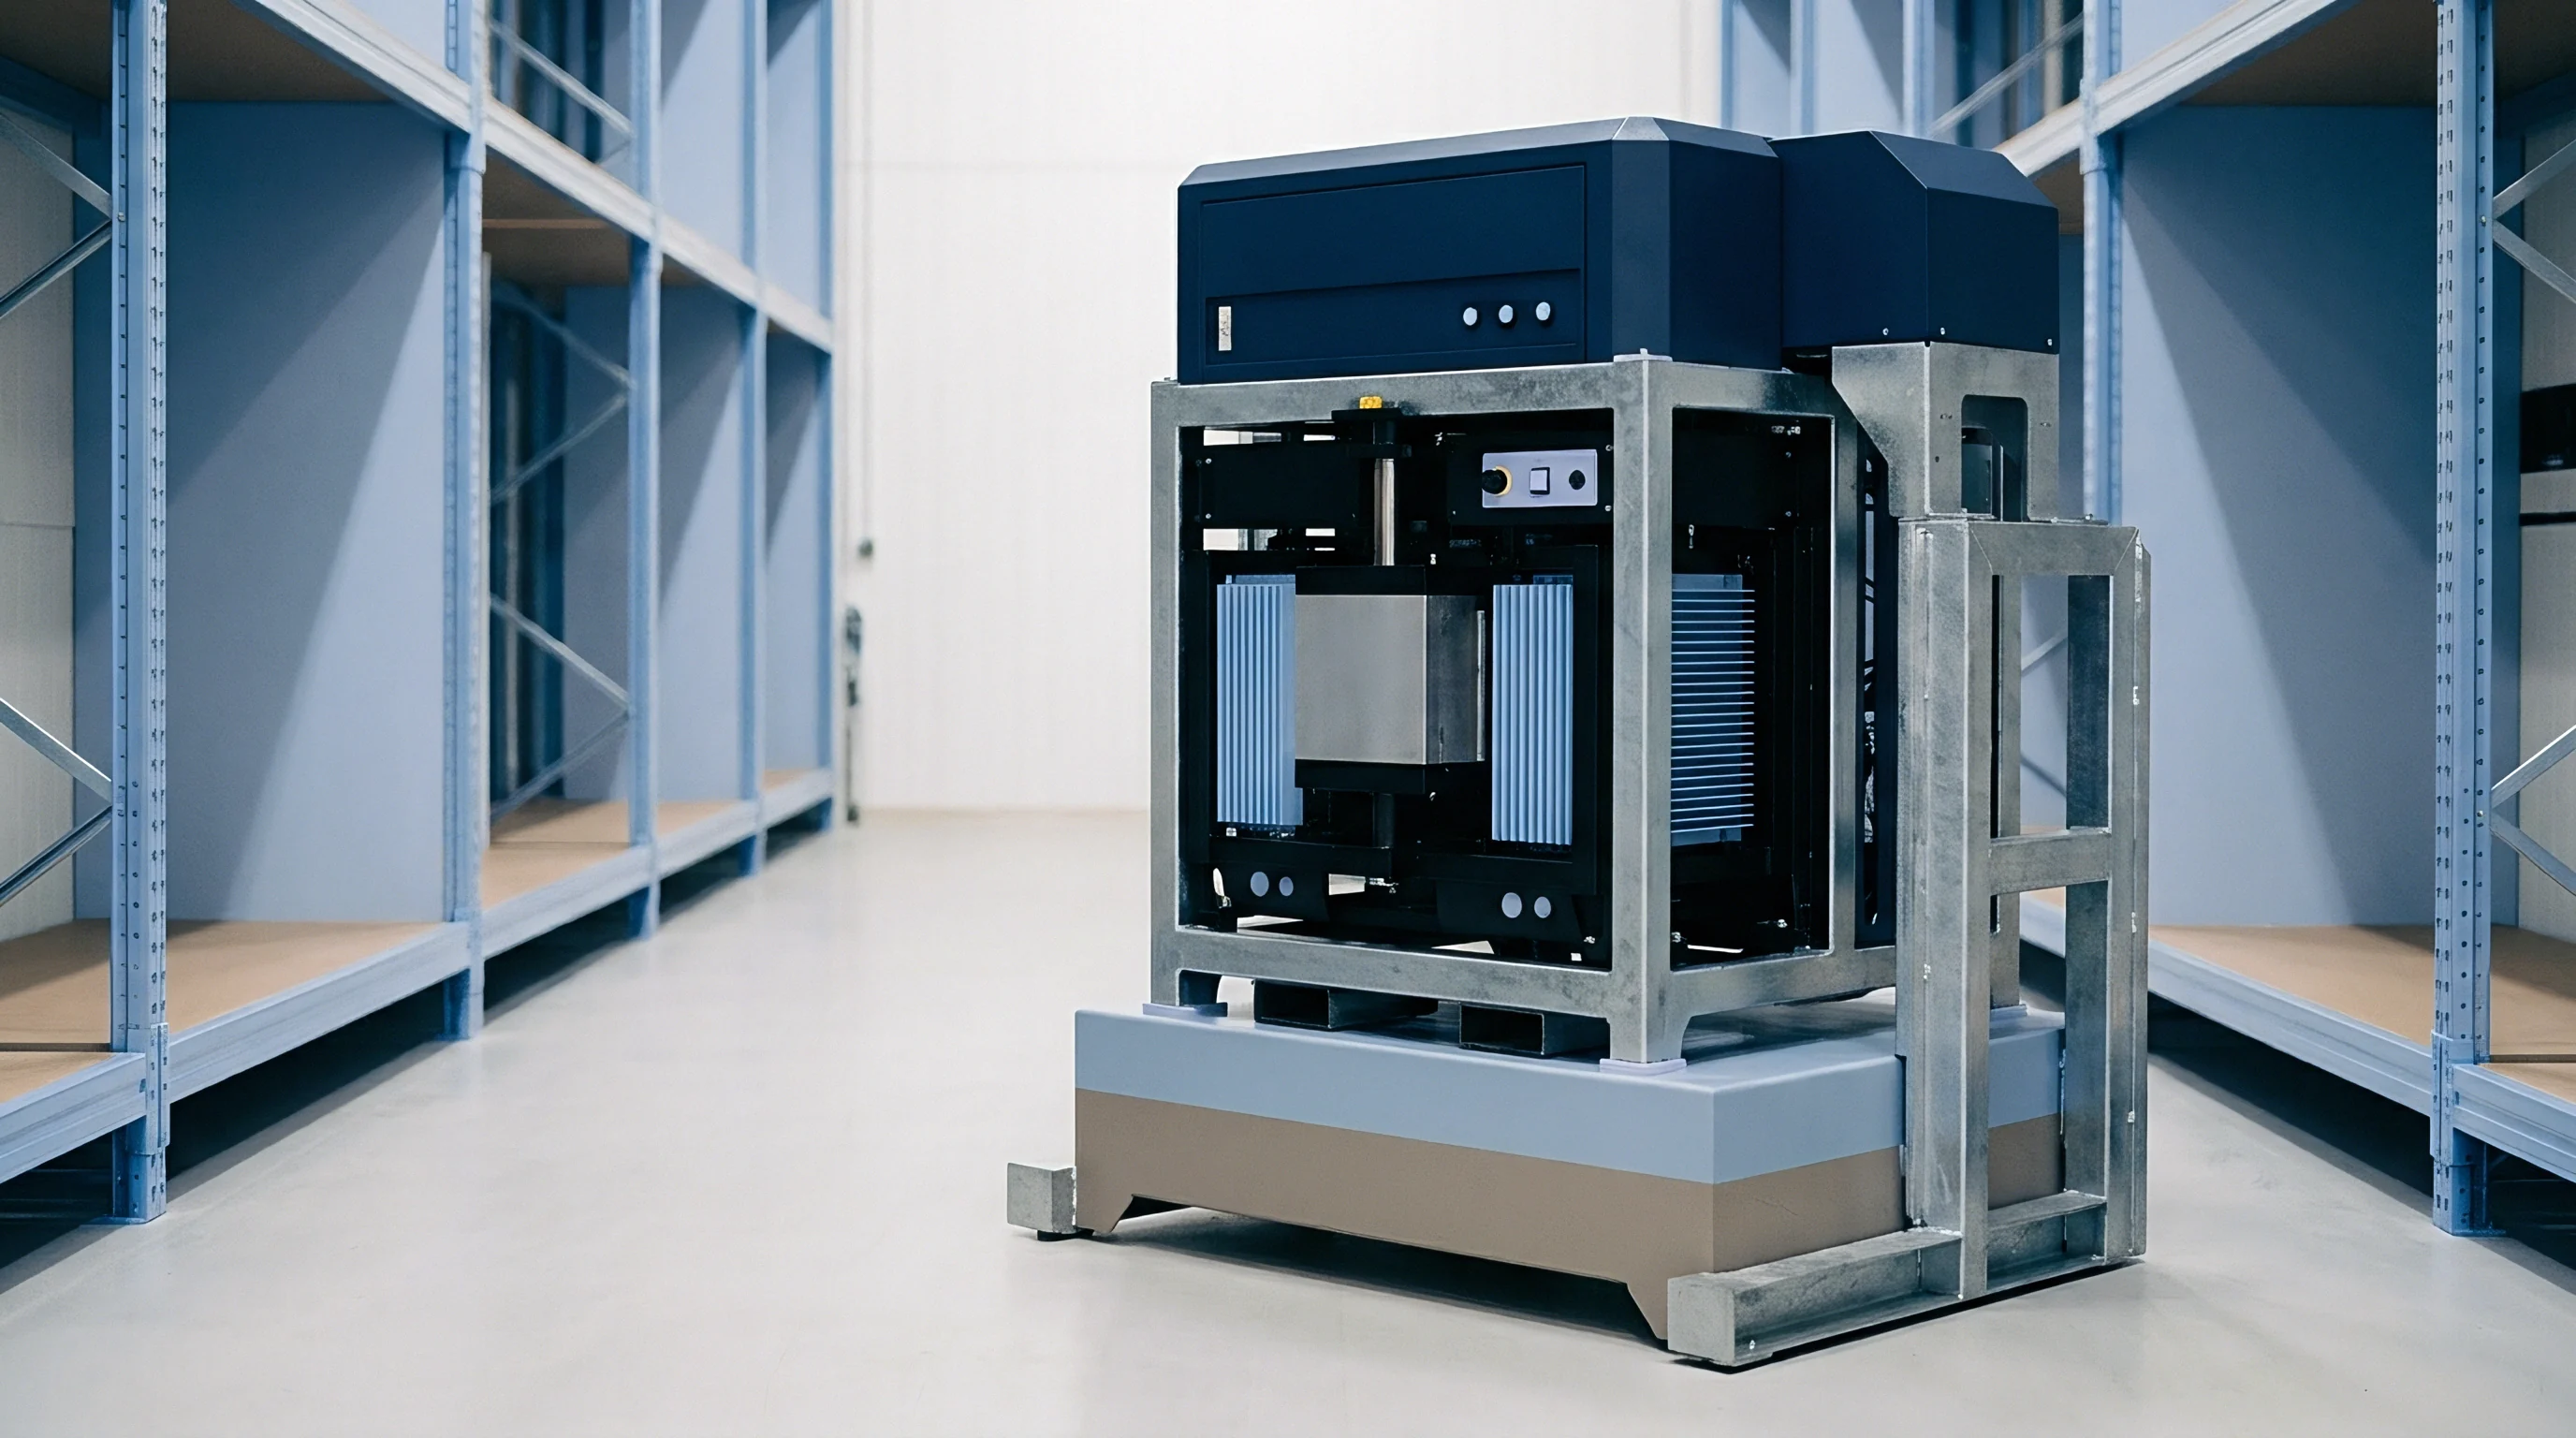
Rigid metal plates placed against pouch or prismatic cell faces transfer external clamping loads while holding against internal swelling forces. In precision battery metrology, platens serve two purposes: applying controlled preloads and providing the structural reference surface for displacement sensors. Milled aluminum or stainless steel platens appear rigid on inspection, but under multi-kilonewton loads they undergo sub-millimeter deflections that compromise stack stress uniformity.
Mapping platen topography during active cycling supplies the empirical data needed to correct localized deformation errors.
Modern test tooling integrates optical access channels, sensor pockets, and stiffness-matched supports directly into platen designs. Mapping localized surface displacement across the cell face requires capturing both out-of-plane flexure and in-plane shear. Out-of-plane flexure alters local stack thickness, modifying electrolyte diffusion paths and separator pore closure.
In-plane shear, driven by non-uniform thermal expansion across the face, creates frictional drag against the pouch material or casing. That friction restricts lateral strain relief, trapping stresses that promote delamination of electrode coatings from current collectors.
Sub-Micron Surface Mapping Using Digital Image Correlation
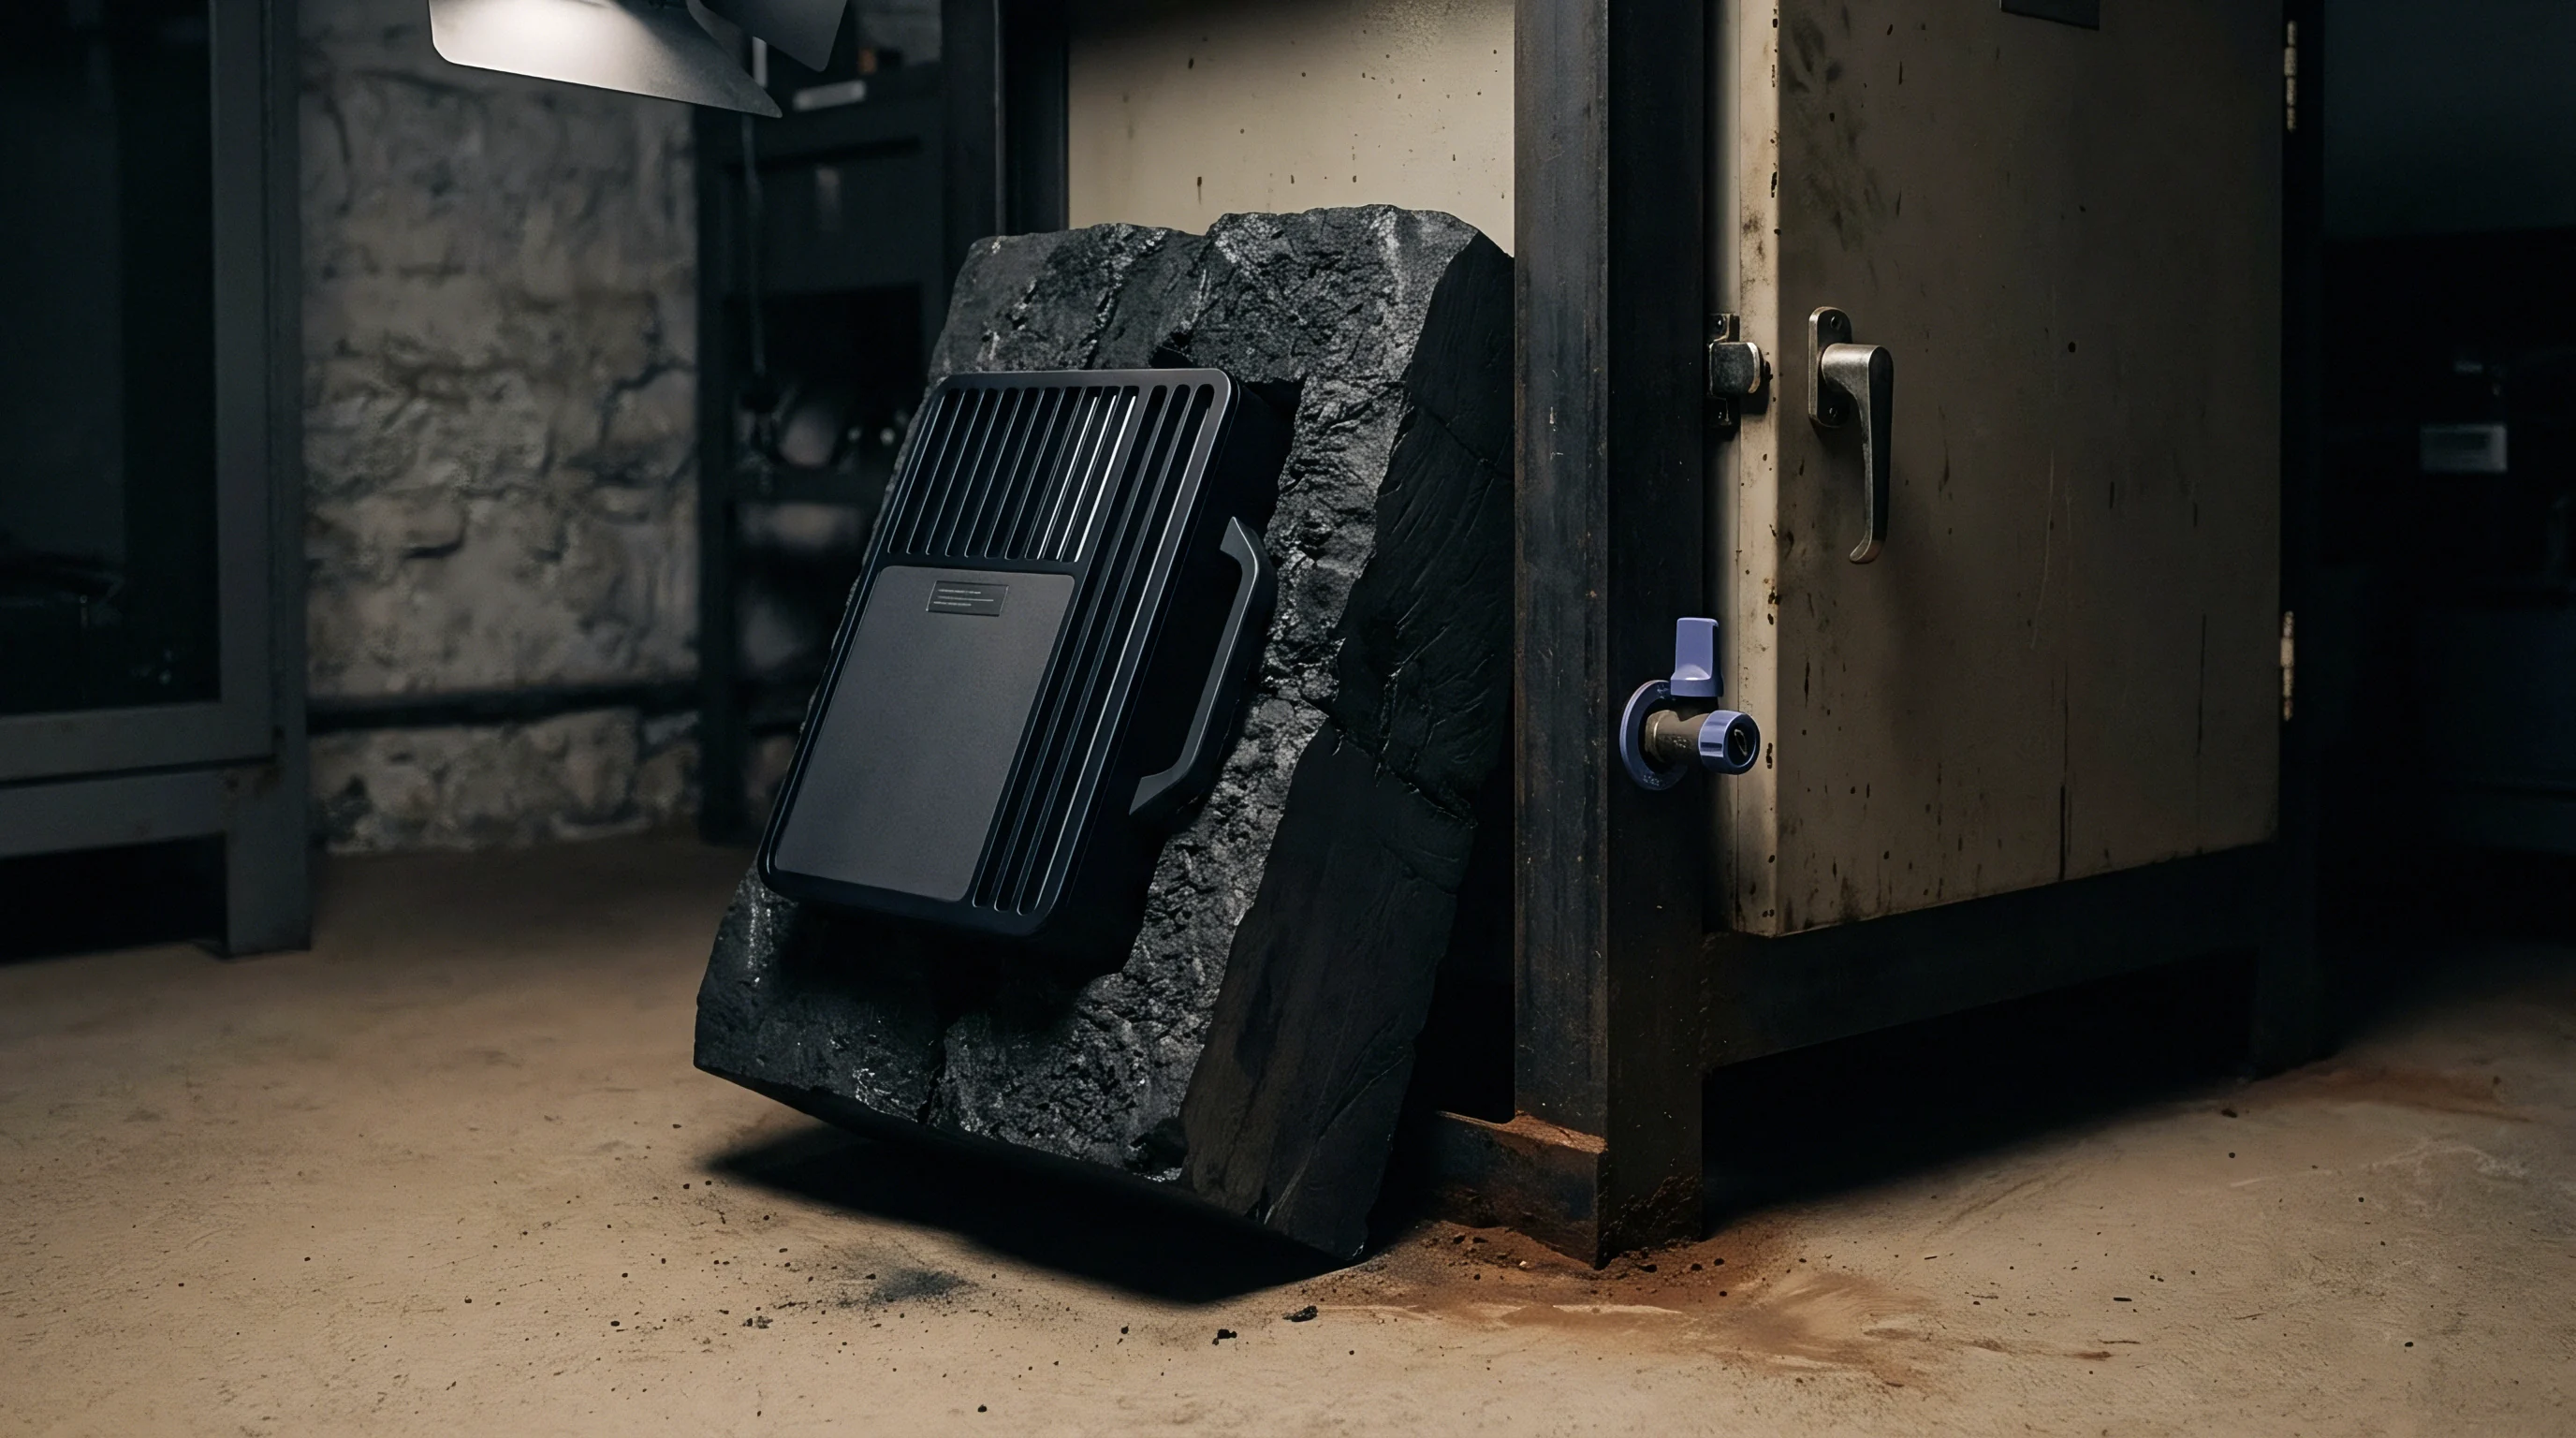
High-resolution optical cameras monitor speckle patterns painted on the edges of compression plates during cycling. Digital Image Correlation (DIC) processes successive frames to track microscopic surface displacement with sub-micrometer resolution. By viewing the side profiles of upper and lower platens simultaneously, 2D and 3D DIC systems resolve localized bending, platen tilt, and tie-rod deformation in real time without physical contact with the fixture.
Finite element benchmark models evaluate structural stiffness.
Optical displacement mapping directly resolves these structural distortions.
Applying DIC to platen deformation requires precise lens calibration, anti-vibration camera mounts, and thermal compensation for air currents inside environmental chambers. A dense, random speckle pattern ~ usually high-temperature matte black paint over a white base layer ~ is applied to the platen edges and cell interfaces. During charging, the camera captures images at fixed strain increments or time intervals.
Cross-correlation algorithms compare intensity patterns between reference and deformed states to generate full-field displacement maps across the fixture profile.
| Metrology System | Spatial Resolution | Displacement Precision | Sampling Frequency | Environmental Chamber Compatibility |
|---|---|---|---|---|
| 3D Digital Image Correlation (DIC) | Full-field (100 µm spatial grid) | 0.5 µm to 2.0 µm | 1 Hz to 100 Hz | Requires optical window; sensitive to thermal haze |
| Multi-Axis Fiber Bragg Grating (FBG) | Discrete points (5 mm spacing) | 0.1 µm to 0.5 µm | 100 Hz to 5 kHz | Excellent (-40 °C to +150 °C); immune to EMI |
| Capacitive Displacement Probe Arrays | Discrete points (10 mm diameter) | 0.01 µm to 0.1 µm | 1 kHz to 10 kHz | Good; requires thermal calibration of probe gap |
| Laser Triangulation Sensors | Discrete lines or points | 0.5 µm to 1.5 µm | 100 Hz to 20 kHz | Requires clear line of sight; sensitive to window frost |
| Embedded Strain Gauge Bridges | Discrete internal points | 1.0 µm to 5.0 µm (derived) | 10 Hz to 1 kHz | Excellent; subject to long-term creep under sustained load |
Digital Image Correlation shows that platen deflection is rarely symmetric. Thread manufacturing tolerances, uneven assembly torque, and internal thermal gradients generate complex asymmetrical twisting modes. An asymmetrical tilt of twenty micrometers across a two-hundred-millimeter cell width concentrates compressive force along one edge, driving local electrolyte displacement and causing uneven degradation across parallel electrode layers.
Capacitive Probe Arrays and Fiber Optic Grids
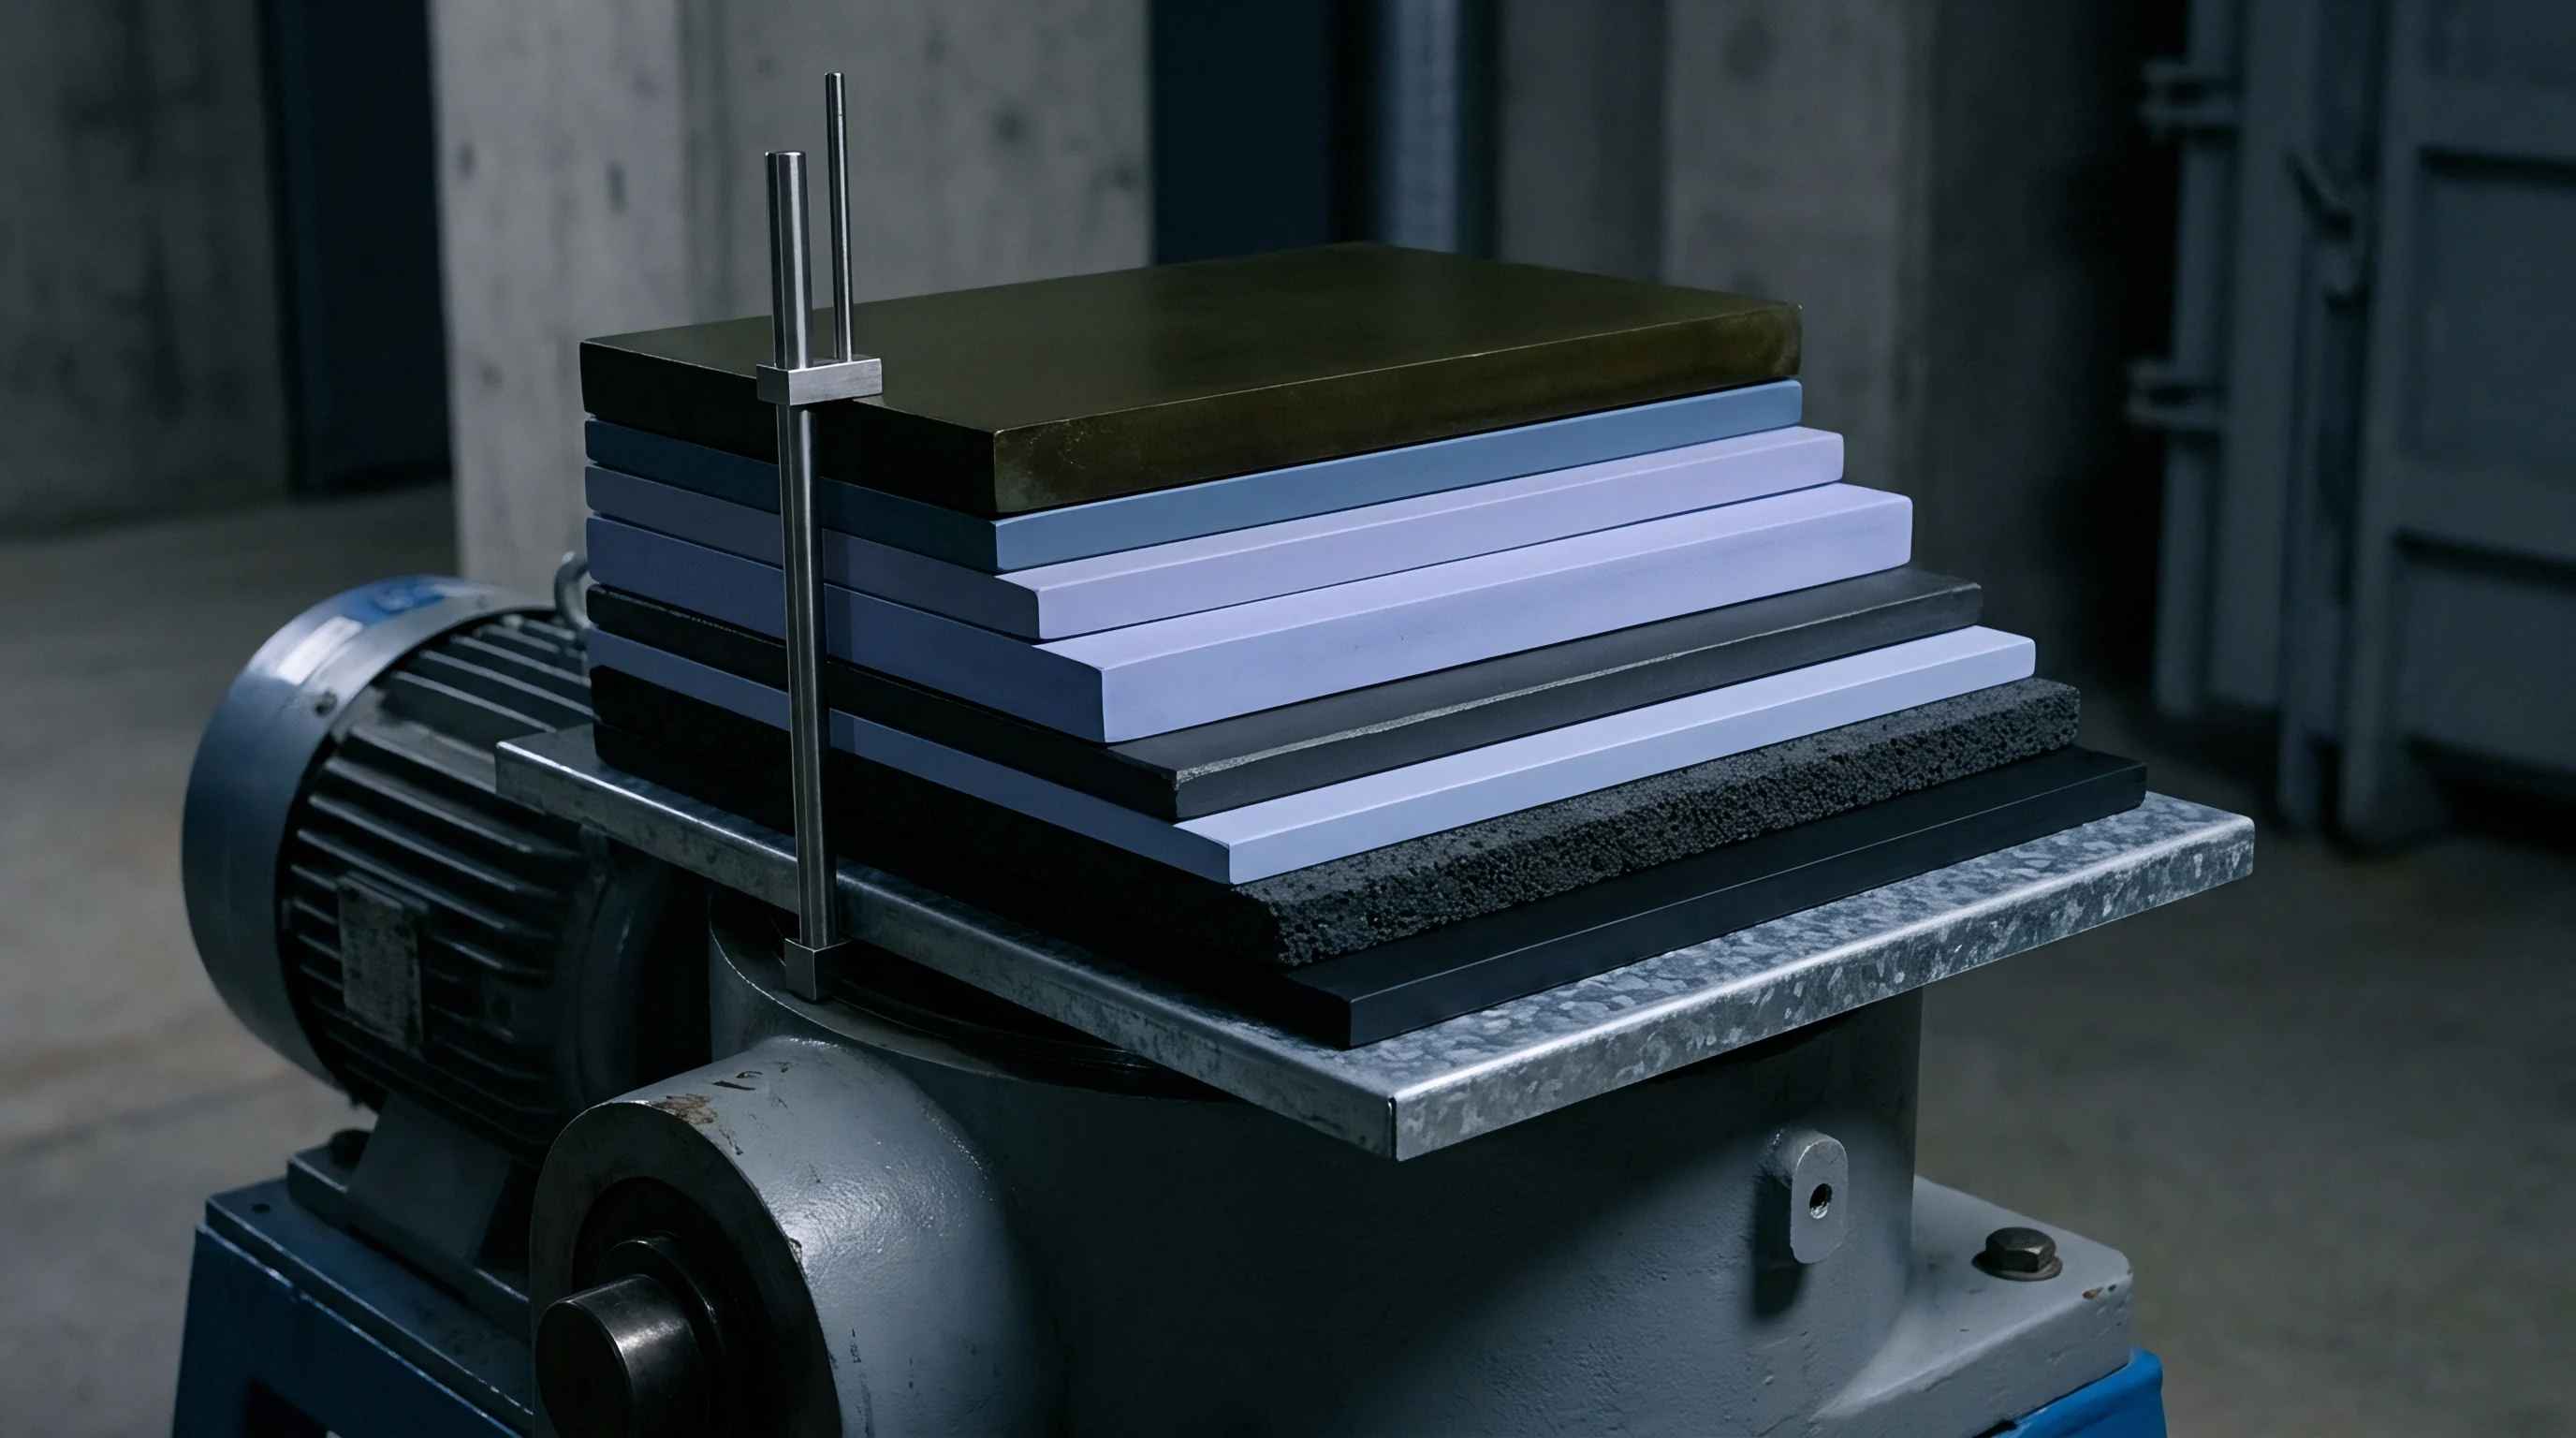
Non-contact displacement sensors around the fixture perimeter track localized plate bowing at sub-micrometer resolution. Capacitive sensors measure capacitance changes between a sensing electrode and the conductive platen surface. Because capacitance varies inversely with distance, these probes reach nanometer-scale precision in controlled environments.
Placing five to nine capacitive probes across the outer face of a platen provides real-time mapping of structural curvature during dynamic swelling tests.
Silicon anodes require especially precise pressure control.
Fiber Bragg Grating (FBG) networks embedded in channels on the platen surface offer an alternative high-density mapping approach. FBG sensors use periodic refractive index variations etched into optical fiber cores. As the platen flexes under load, strain transfers into the fiber and shifts the reflected Bragg wavelength.
Multiplexing dozens of FBG sensors along one fiber yields continuous internal strain maps inside the platen without requiring line-of-sight access or camera clearance in crowded chambers.
Platen flexure of twenty micrometers under a five kilonewton swell load induces up to thirty percent variance in localized stack pressure across large-format cells.
Integrating sensor networks into testing platens requires careful structural design. Machining sensor channels lowers the local moment of inertia, creating structural weak points that increase deflection unless compensated. Advanced designs use finite element topology optimization to place stiffening ribs along primary load paths while creating recessed pockets for metrology hardware.
Providing detailed deflection maps ensures raw displacement data undergoes automated compensation before entering lifecycle databases.
Fixtures rarely maintain absolute rigidity under high loads; physical measurement demonstrates that thermal expansion and structural flexure routinely override nominal sensor accuracies during multi-month qualification trials.


Optics
Non-contact measurement systems isolate true cell swelling by subtracting structural fixture distortion from raw displacement signals. Mechanical dial indicators and linear variable differential transformers rely on contact rods attached directly to fixture plates. When those plates bow, warm, or tilt, mechanical sensors record the combined motion of the cell face and the flexing fixture.
Optical metrology architectures decouple these signals by projecting reference coordinate frames onto both the cell surface and the tooling frame, eliminating the mechanical hysteresis of contact probes.
Implementing optical deflection mapping in production test setups requires balancing spatial resolution, measurement speed, and physical access. Multi-camera 3D DIC systems supply full-field vector displacement maps but need line-of-sight access through chamber windows. Dual-beam laser interferometers offer picometer-scale axial tracking but measure only single points per head.
Combining dense discrete laser arrays with spatial interpolation algorithms allows continuous mapping of complex platen flexure profiles during accelerated cycling.
Decoupling Fixture Bending from Anode Phase Changes
Graphite and silicon active materials undergo crystallographic volume jumps at specific state-of-charge thresholds. During lithiation, graphite transitions through discrete staging phases that appear as distinct steps in the cell thickness curve. Inside a compliant compression fixture, platen bending smooths over these sharp transition steps in raw displacement data.
Elastic bending energy stored in the flexing platen acts like a spring, compressing the cell during peak expansion and relaxing as it contracts.
Differential expansion can damage the ceramic separator.
Standard load cells miss underlying platen tilt.
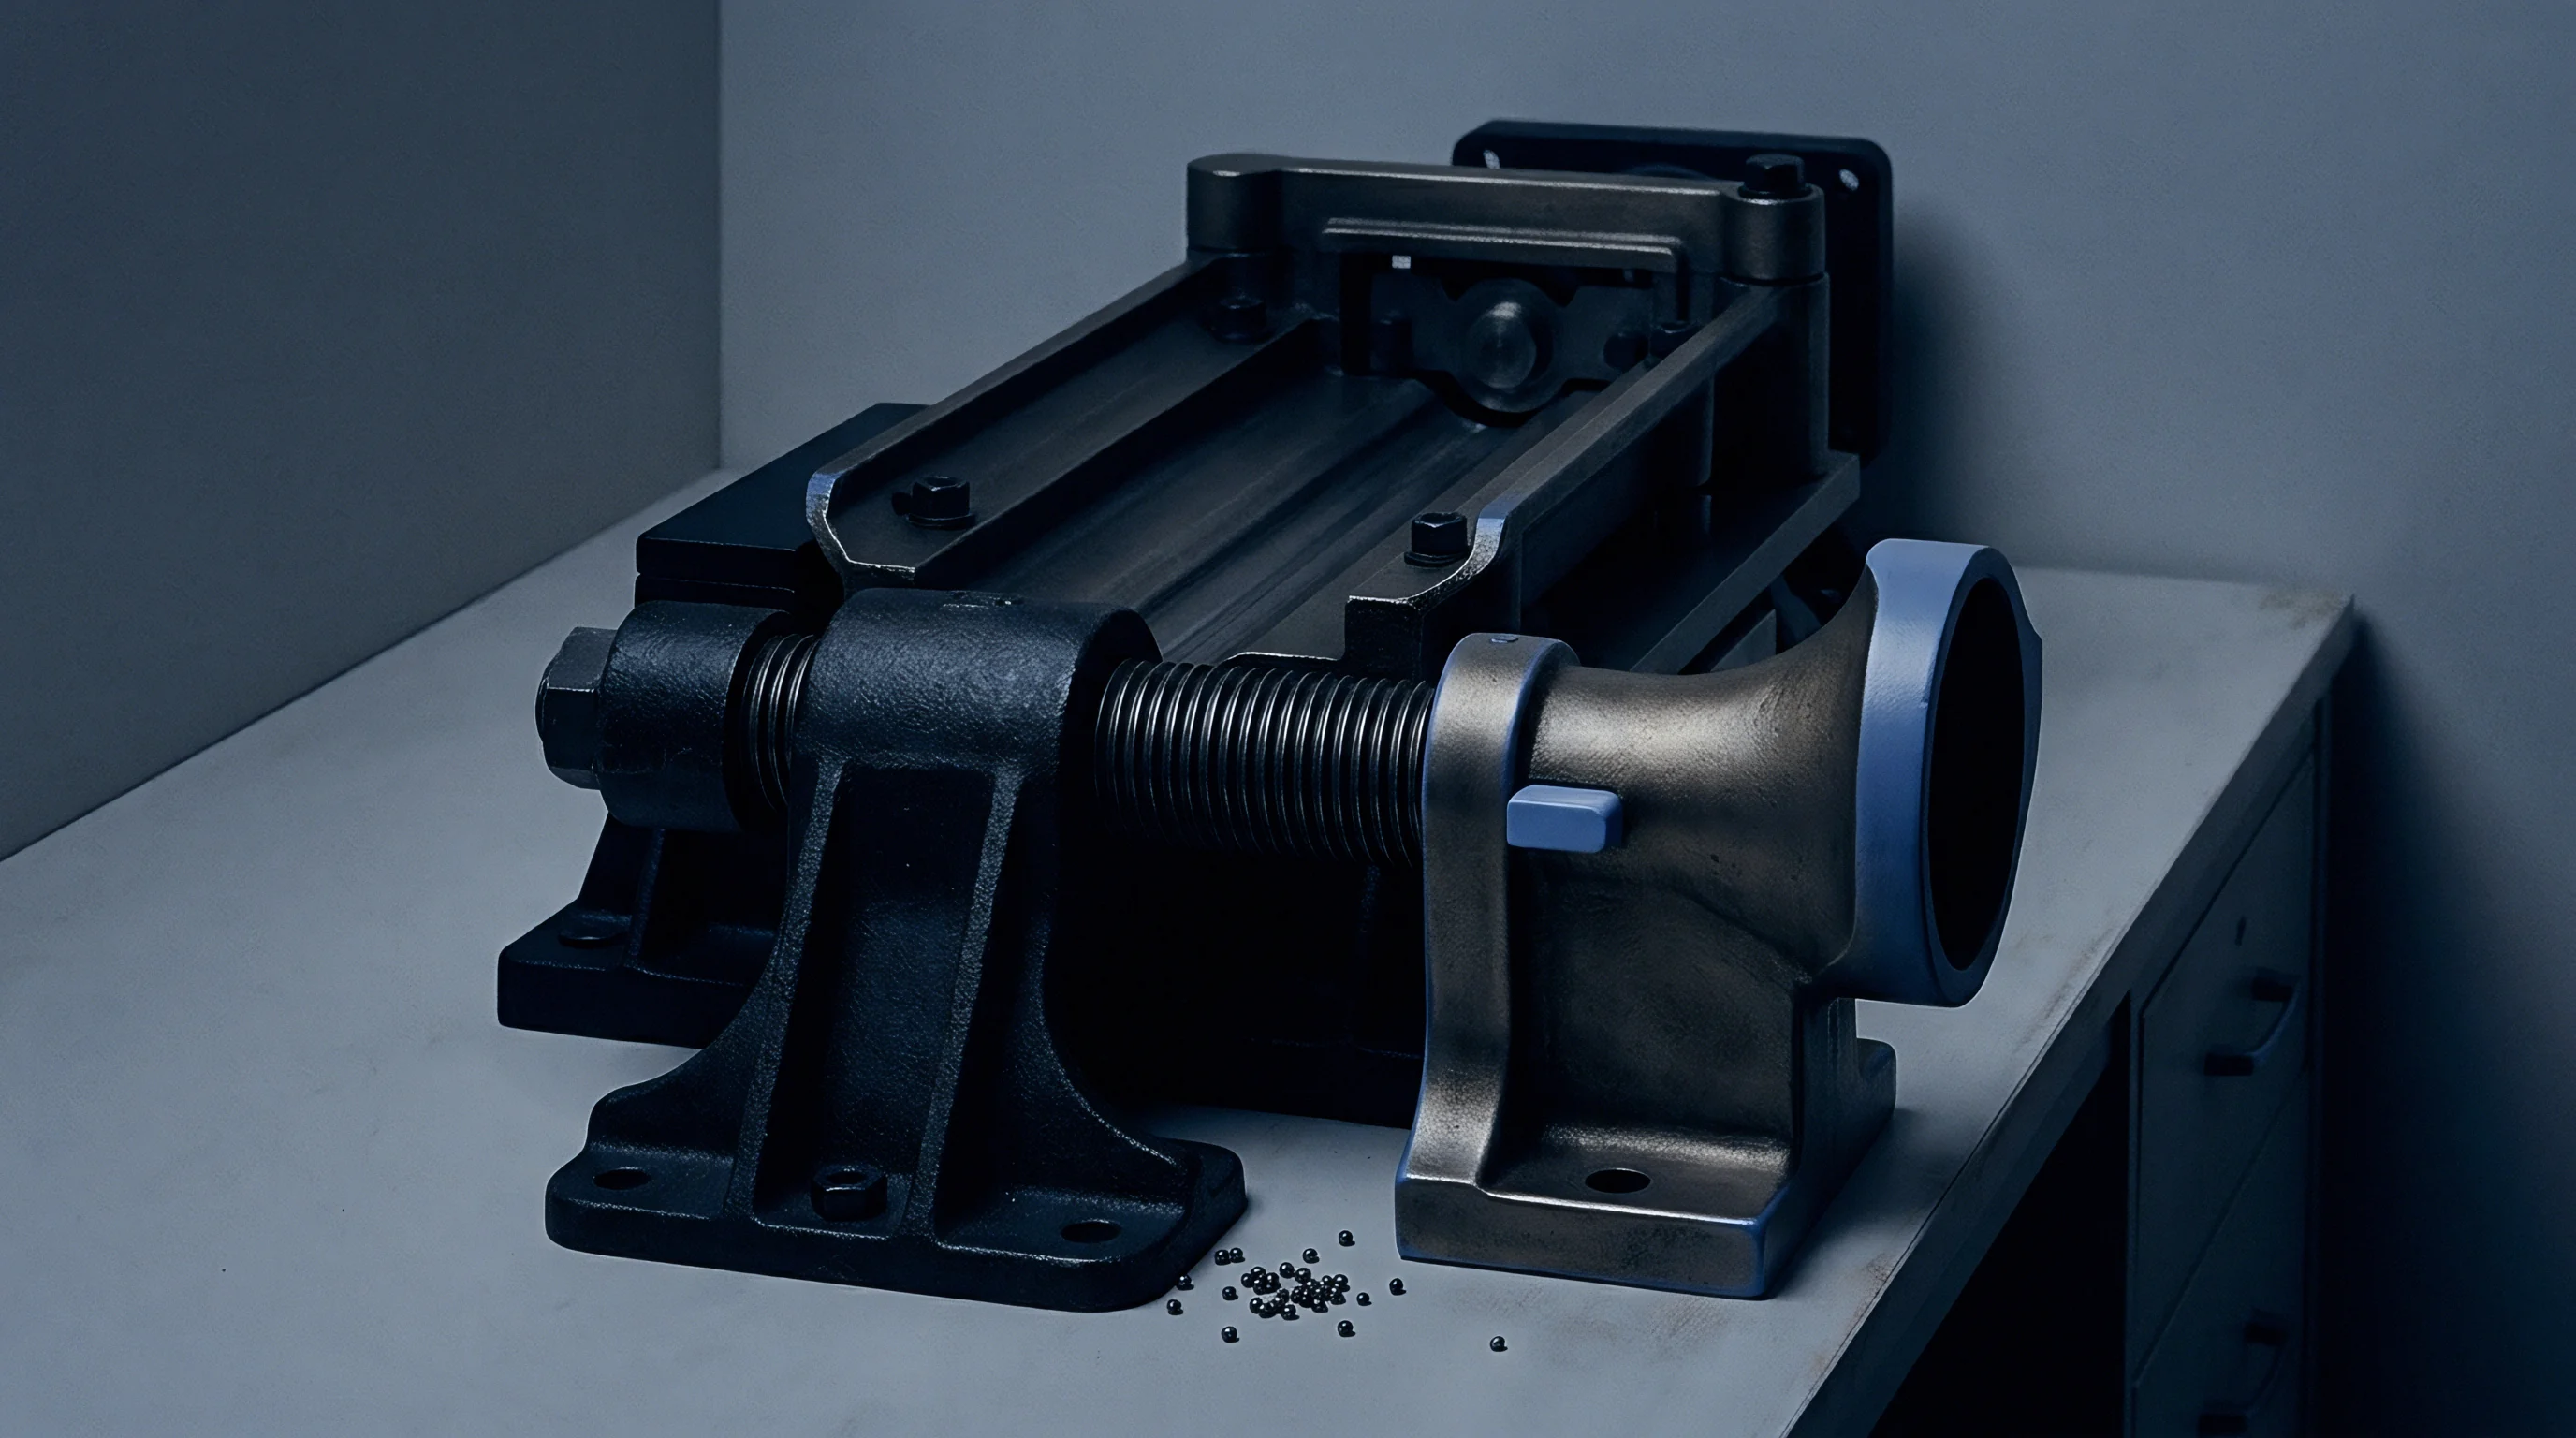
Correcting for fixture spring action requires real-time optical tracking of platen shape changes. During charging, the optical system measures continuous curvature across both upper and lower platens. The raw distance measured between the outer platen faces equals the sum of true cell thickness, lower platen flexure, upper platen flexure, and system thermal growth.
Subtracting optical flexure vectors from gross displacement restores the sharp phase-transition features of pure material intercalation.
Subtracting tooling compliance vectors yields net displacement corrections within zero point eight micrometers.
- Audit Fixture Structural Compliance Mount solid stainless steel calibration blocks inside the fixture and apply dynamic forces from zero to thirty kilonewtons using a calibrated hydraulic press, recording frame deformation across all optical channels.
- Map Environmental Thermal Drift Place the empty fixture in an environmental chamber and sweep temperatures from minus twenty to sixty degrees Celsius at zero force to build thermal expansion matrices for sensor mounts and frame structures.
- Compute Structural Stiffness Matrices Invert empirical force-deflection and temperature-deflection datasets to construct a multi-axis compliance matrix for the fixture configuration.
- Sync Optical Data Streams Align timestamps between optical acquisition channels and electrochemical cycler voltage and current records using hardware trigger signals.
- Execute Real-Time Differential Subtraction Process automated data pipelines during testing to subtract dynamic fixture deflection vectors from gross displacement measurements, isolating uncorrupted cell swelling profiles.
Integration with Multi-Channel Battery Cyclers
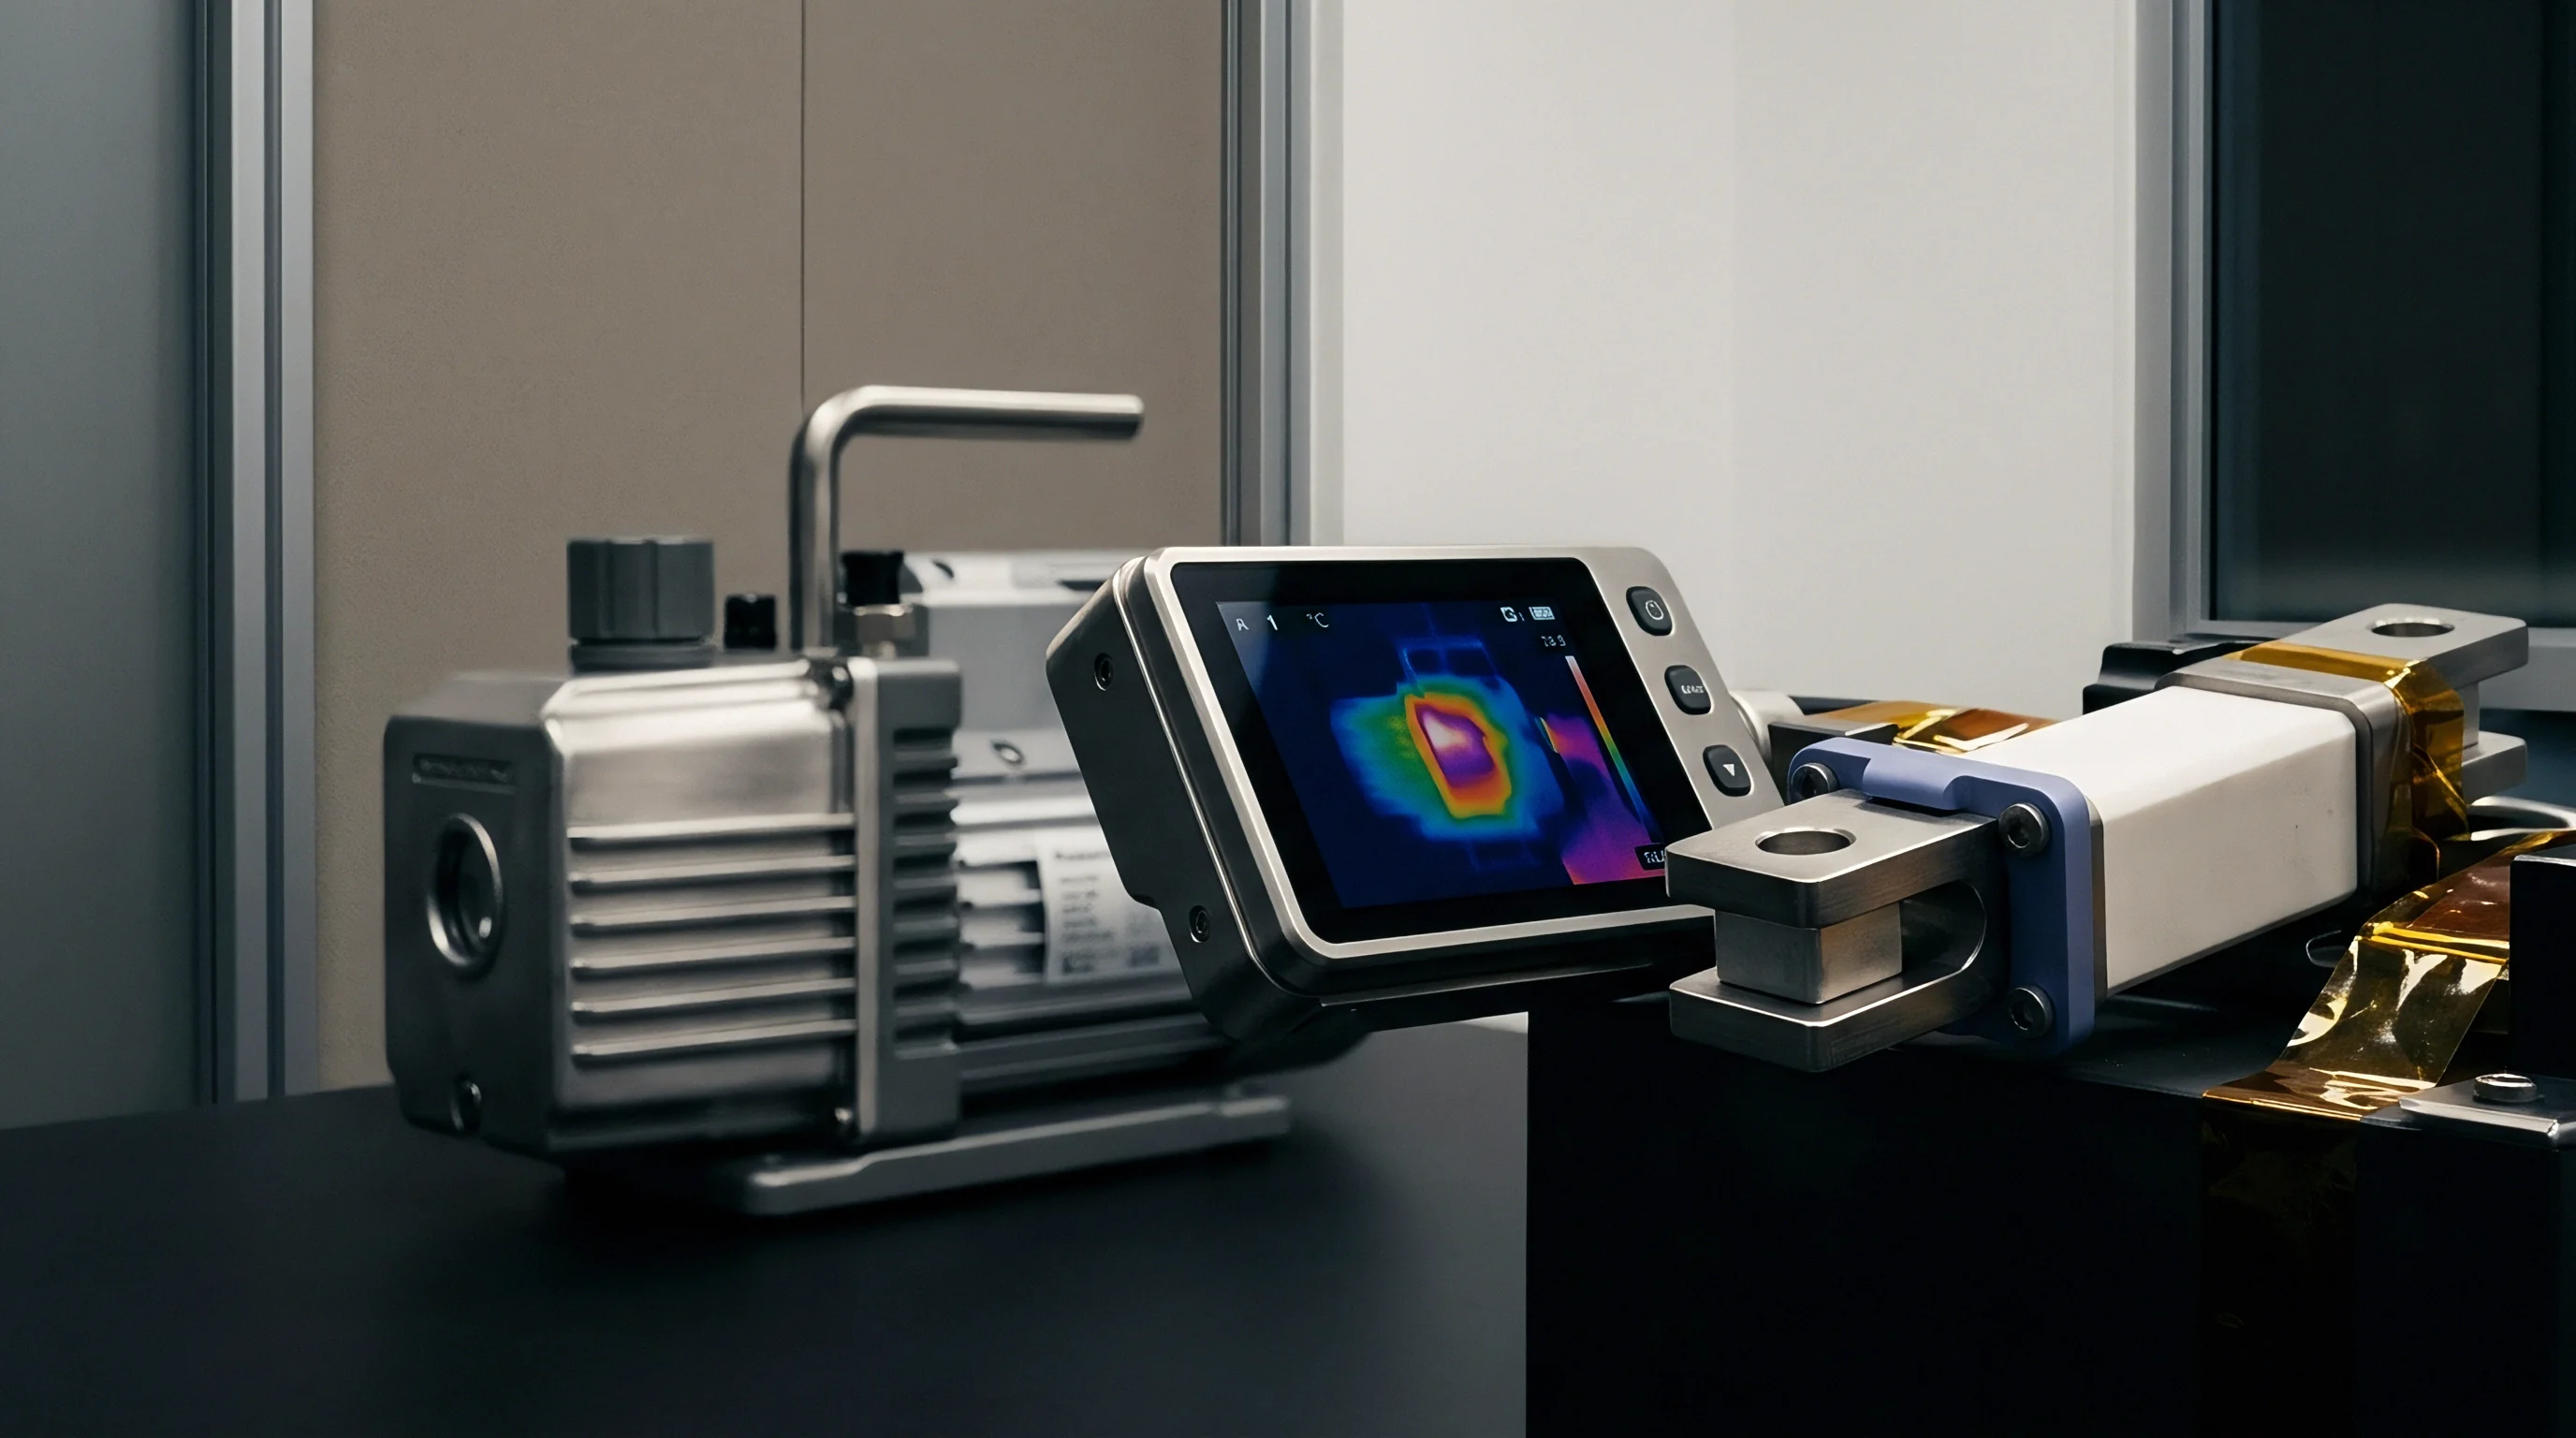
Real-time strain data feeds directly into automation software to adjust clamp spacing or maintain constant stack force. Commercial test laboratories operate hundreds of cycler channels simultaneously, generating continuous streams of electrical and thermal data. Integrating high-precision optical strain mapping into high-throughput operations requires low-latency signal conversion and automated calibration algorithms.
Unchecked platen deflection alters local current densities.
Modern test stations use field-programmable gate arrays to process optical camera or laser sensor signals at sampling rates above one kilohertz. The processed displacement map feeds directly to servomechanical or pneumatic actuators built into the fixture. If sensors detect platen flexure exceeding preset tolerances, motorized tie-rods or hydraulic pistons make compensatory pressure adjustments.
This closed-loop feedback maintains uniform pressure across the cell face throughout complex drive-cycle power profiles.
In situ optical deflection mapping resolves electrode phase transitions masked by fixture elasticity.
Under test protocol IEC 62660-2 clause 6.2, mechanical deformation measurements during electrical cycling must isolate cell dimensional growth from test equipment compliance to prevent systematic capacity grading errors.


Rigidity
Mechanical stiffness in test frame structures determines whether cell expansion occurs under constant-pressure or constant-volume boundary conditions. In production battery packs, cells are constrained by rigid aluminum enclosure walls, foam compression pads, or structural adhesives. Depending on module design, real-world boundary conditions sit between constant pressure, where external structures yield to maintain uniform force, and constant volume, where outer walls resist displacement entirely.
Test tooling must reproduce these exact boundary conditions to generate representative degradation data.
Achieving absolute structural rigidity inside a test frame is impossible due to the finite elastic modulus of metals. A load frame built from heavy steel channels still flexes elastically under twenty-kilonewton swell forces. Frame rigidity is quantified in kilonewtons per micrometer of displacement.
High-stiffness frames exceed fifty kilonewtons per micrometer, while basic benchtop fixtures often fall below five. Running a cell in a low-stiffness fixture exposes it to uncompensated displacement, invalidating comparisons with rigid pack enclosures.
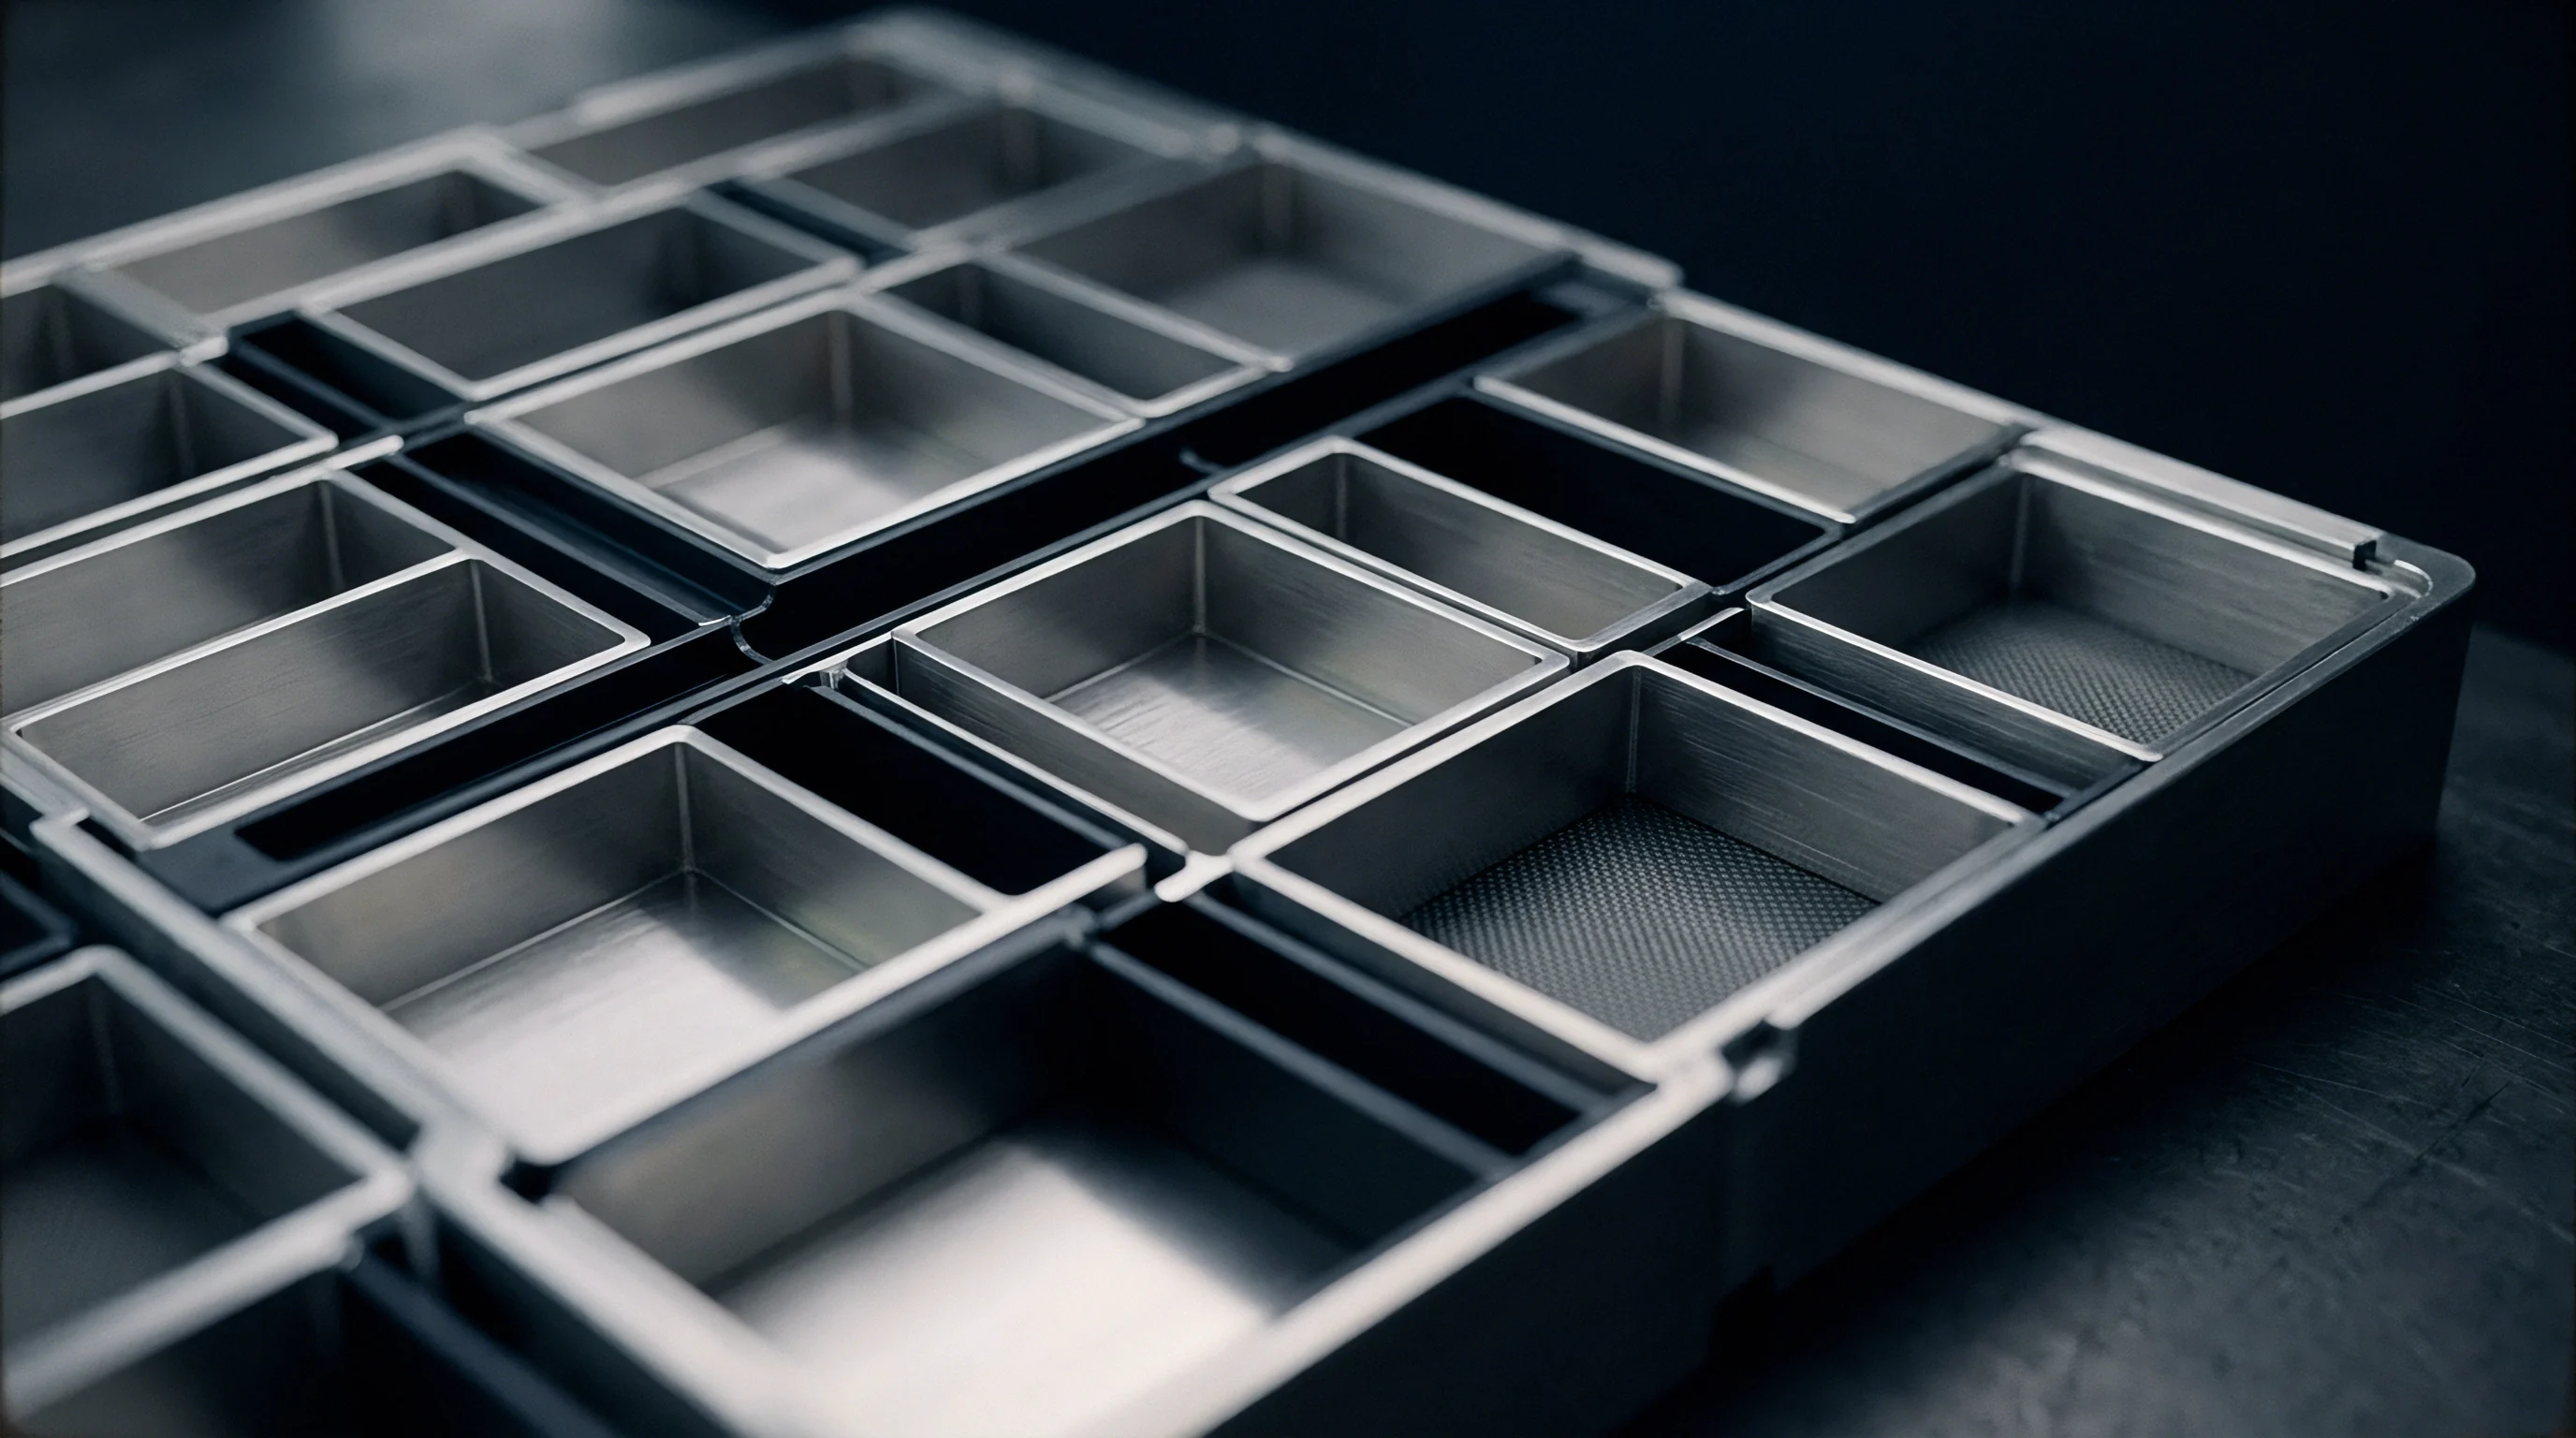
Where Does Fixture Deformation Mask Anode Swelling Mechanics?
Laboratory load frames frequently experience micro-yield in tie-rod threads under sustained cycling. When evaluating long-term degradation in high-nickel, silicon-composite pouch cells, small structural displacements introduce major artifacts into cycle-life plots. Silicon particles expand irreversibly over hundreds of cycles through continuous solid electrolyte interphase formation and mechanical pulverization.
If the rig yields elastically by two micrometers each cycle, it continuously relieves internal stress, masking particle cracking and artificially inflating recorded cycle life.
Frame flexure also disguises gas evolution rates.
The acceptable compliance threshold sits at five percent of cell thickness variation.
Rigid tooling helps prevent premature lithium plating.
Unchecked fixture distortion invalidates accelerated aging data.
Active deflection compensation restores true electrochemical fidelity.
Tooling compliance continuously alters true stack pressure.
Structural compliance alters the balance between elastic electrode breathing and plastic swelling. In early cycling, reversible intercalation drives elastic displacement. Over extended cycling, irreversible swelling dominates.
In a low-stiffness fixture, irreversible swelling pushes the platens apart, reducing the effective preload on the cell during subsequent discharged states. As baseline preload decays, contact impedance between active particles rises, triggering localized capacity loss that engineers might misattribute to chemical degradation rather than tooling yield.
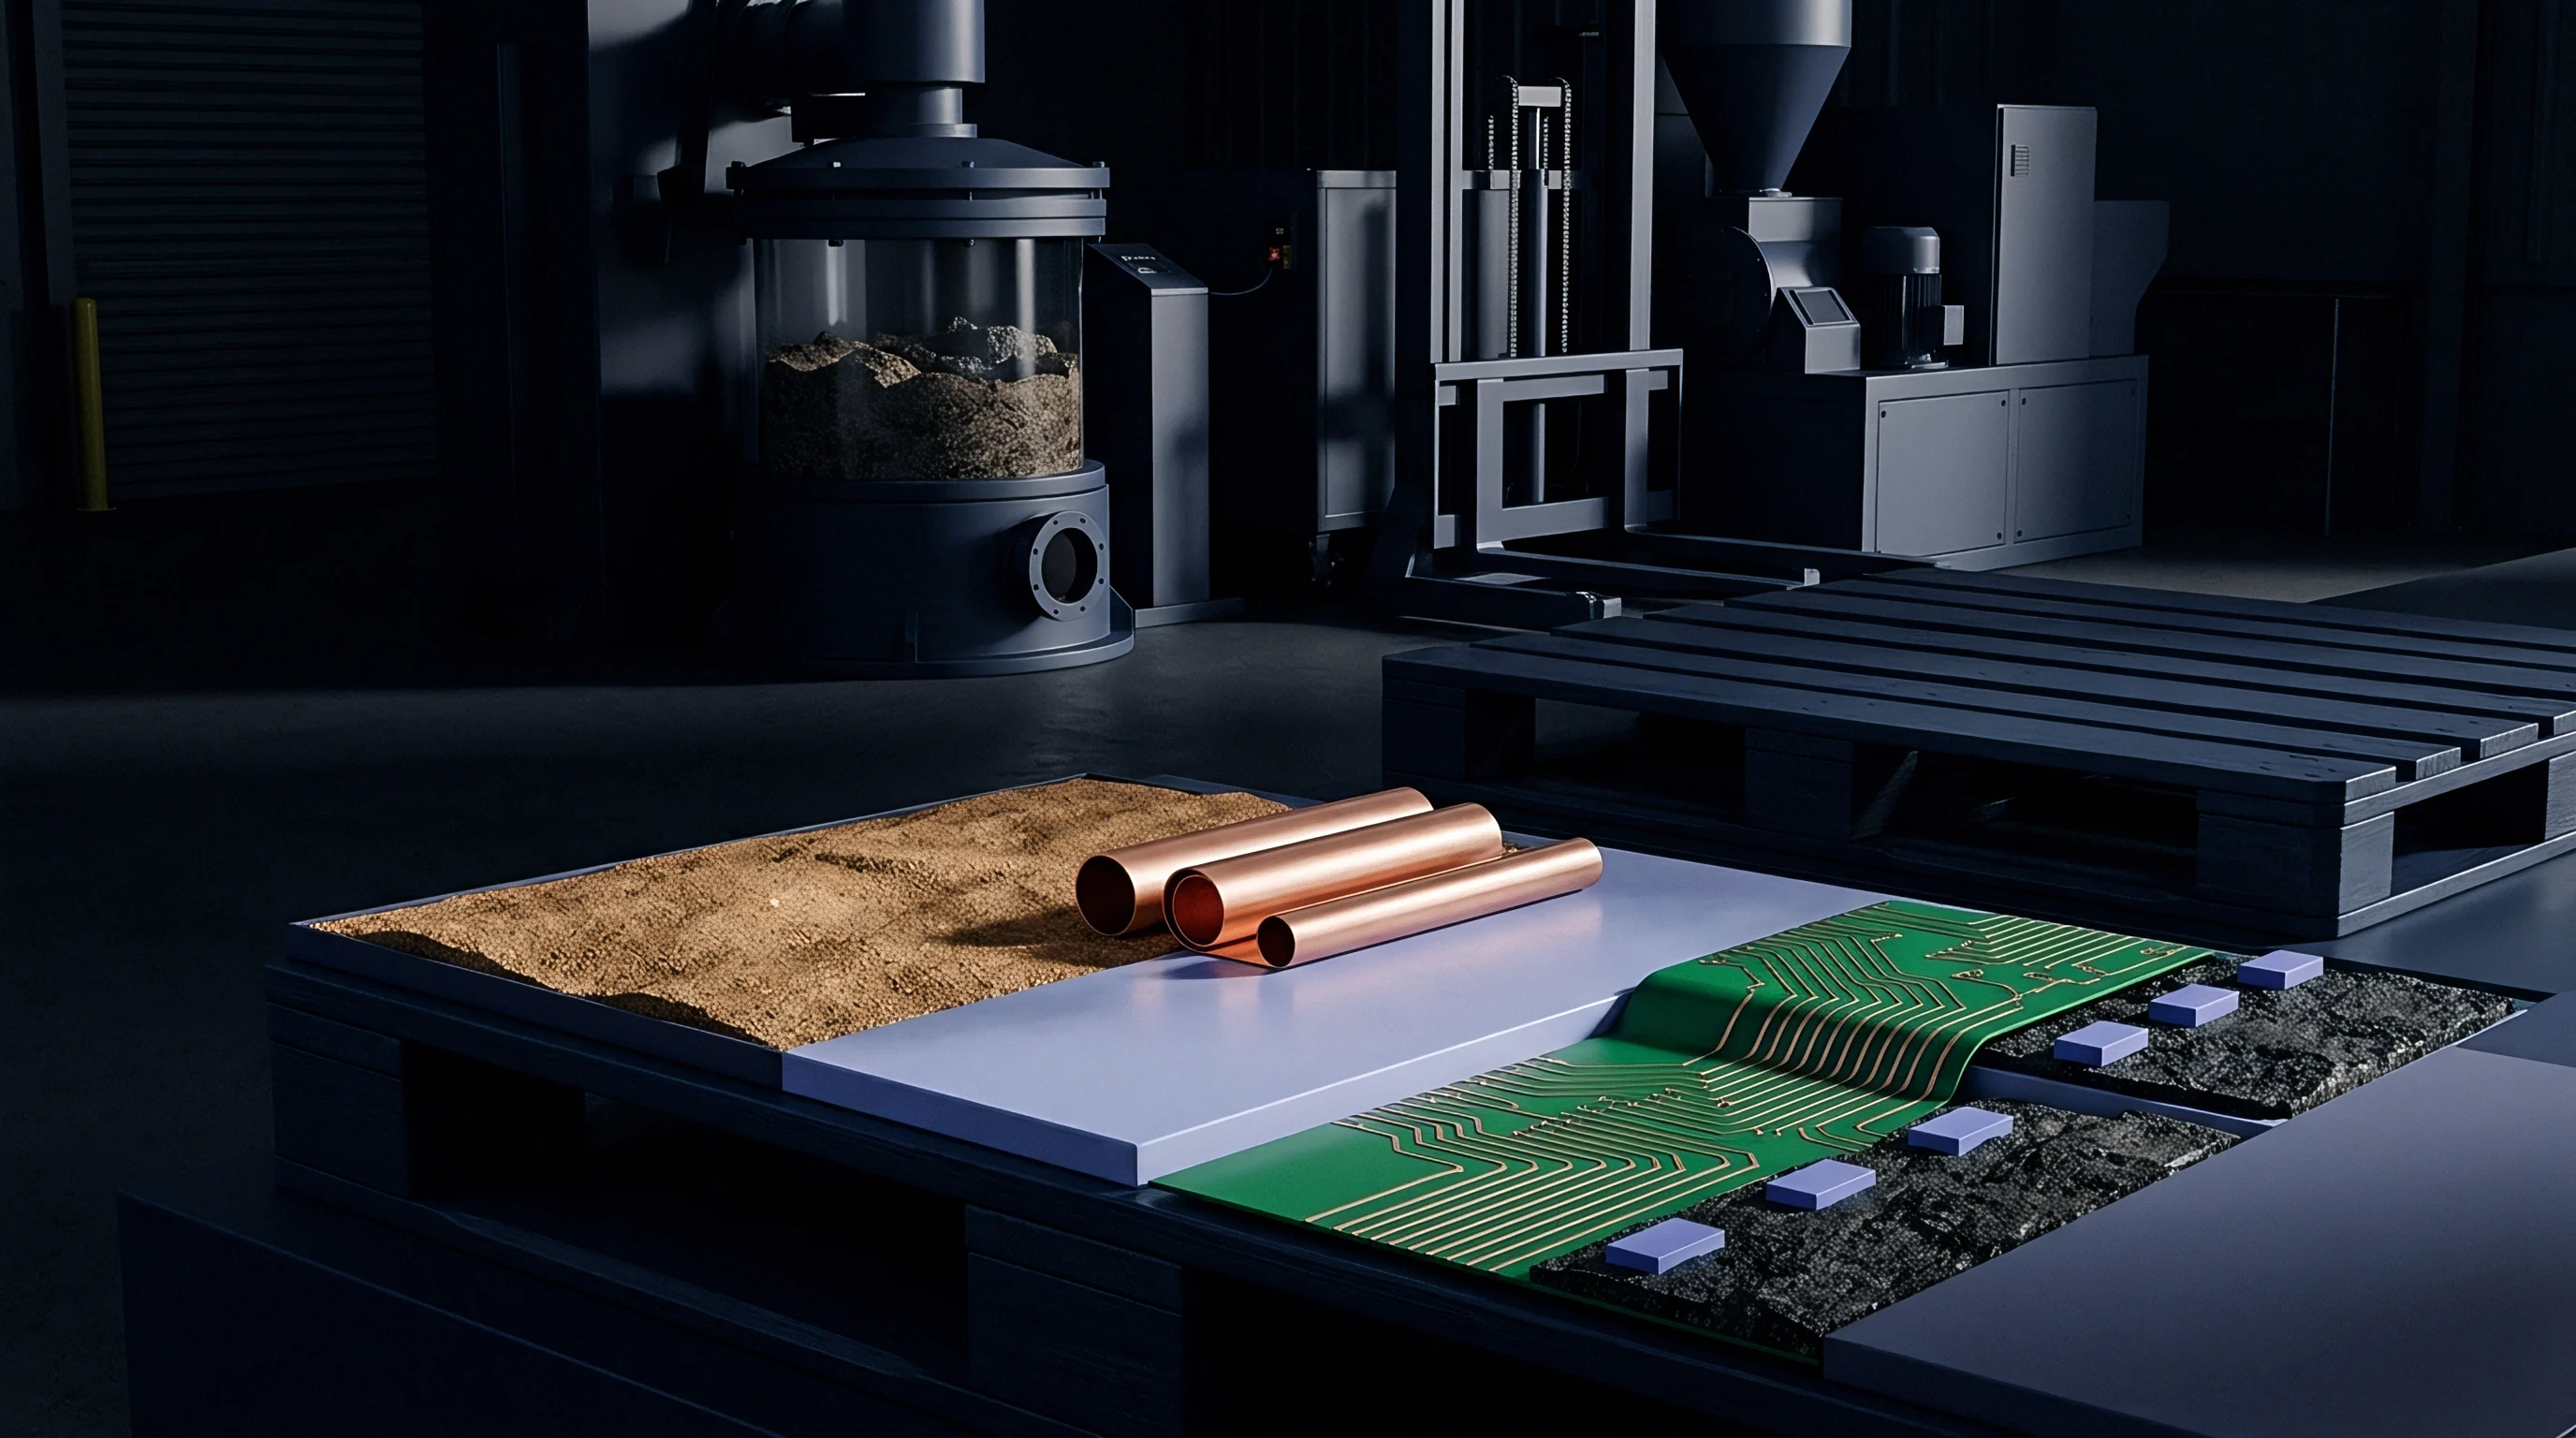
Finite Element Corrections in Automated Data Pipelines
Computational compliance matrices invert raw transducer outputs to recover true cell thickness profiles. When physical fixtures cannot achieve absolute mechanical stiffness, post-processing algorithms correct raw experimental data. Finite Element Analysis (FEA) models of the fixture generate compliance matrices defining displacement across every coordinate point on the platen surface as a function of multi-axis loads and thermal gradients.
| Cycling Phase | Raw Load Cell Force (kN) | Raw Displacement Probe Measurement (µm) | Optical Platen Deflection Vector (µm) | Tie-Rod Elastic Growth Vector (µm) | Corrected Net Cell Thickness Delta (µm) | Relative Measurement Error (%) |
|---|---|---|---|---|---|---|
| Initial Preload (SOC 0%) | 2.00 | 0.00 | 1.20 | 0.80 | -2.00 | N/A (Baseline Ref) |
| Mid-Charge (SOC 50%) | 8.50 | 45.30 | 12.40 | 6.20 | +26.70 | 69.6% Overestimation |
| Full Charge (SOC 100%) | 18.20 | 112.80 | 38.60 | 18.40 | +55.80 | 102.1% Overestimation |
| Mid-Discharge (SOC 50%) | 11.10 | 68.20 | 18.90 | 9.80 | +39.50 | 72.6% Overestimation |
| Fully Discharged (SOC 0%) | 2.40 | 8.50 | 2.10 | 1.10 | +5.30 | 60.3% Overestimation |
Executing finite element corrections requires streaming real-time force, temperature, and raw displacement data into processing pipelines. The pipeline multiplies the inverted compliance matrix by the instantaneous force-vector array to calculate the exact spatial deflection map of the tooling at each timestamp. Subtracting this calculated deflection map from raw probe measurements yields the true net dimensional change of the cell.
Applying automated FEA compliance adjustments reduces absolute measurement error from over one hundred percent down to less than two percent under peak swelling loads.
- Stiffness Threshold Matching Ensure the test fixture spring rate exceeds twenty-five times the bulk axial stiffness of the cell under test to minimize elastic stress relaxation.
- Thermal Drift Decoupling Use low-thermal-expansion alloys such as Invar or carbon-fiber composite tie-rods for long-term cycling fixtures in variable-temperature chambers.
- Active Load Compensation Integrate high-speed servomechanical actuators driven by real-time optical displacement feedback to maintain zero-displacement boundary conditions during variable C-rate charging.
- Multi-Point Force Calibration Calibrate load distribution across the platen area using matrix pressure sensor films before starting long-term electro-thermal testing trials.
A rule of thumb for battery compression testing dictates that structural fixture stiffness must exceed twenty-five times the bulk axial modulus of the cell under test to prevent tooling compliance from corrupting intercalation mechanics.
Choosing lighter aluminum plates over heavy reinforced steel assemblies for high-capacity prismatic cell testing cuts capital cost, but the resulting flexure forces engineers to rely on complex computational corrections to recover valid physical data.
Calibration
Metrological validation of compression tooling demands dynamic force-displacement profiling across operational temperature ranges. Static calibration protocols applying stationary loads at room temperature miss non-linear structural behavior that emerges during combined thermal and mechanical cycling. Validating test tooling requires installing precision reference blocks in place of live cells and mapping fixture deformation under simulated operational profiles.
Dynamic calibration verifies embedded strain gauges, optical sensors, and force transducers under realistic conditions. Reference blocks made from solid optical-grade fused silica or high-purity aluminum oxide provide precise thermal expansion and elastic modulus benchmarks. Subjecting these blocks to programmed force sweeps up to thirty kilonewtons while cycling chamber temperatures validates the entire measurement pipeline before loading expensive prototype cells into test channels.
Standardized Dynamic Load Metrology Procedures
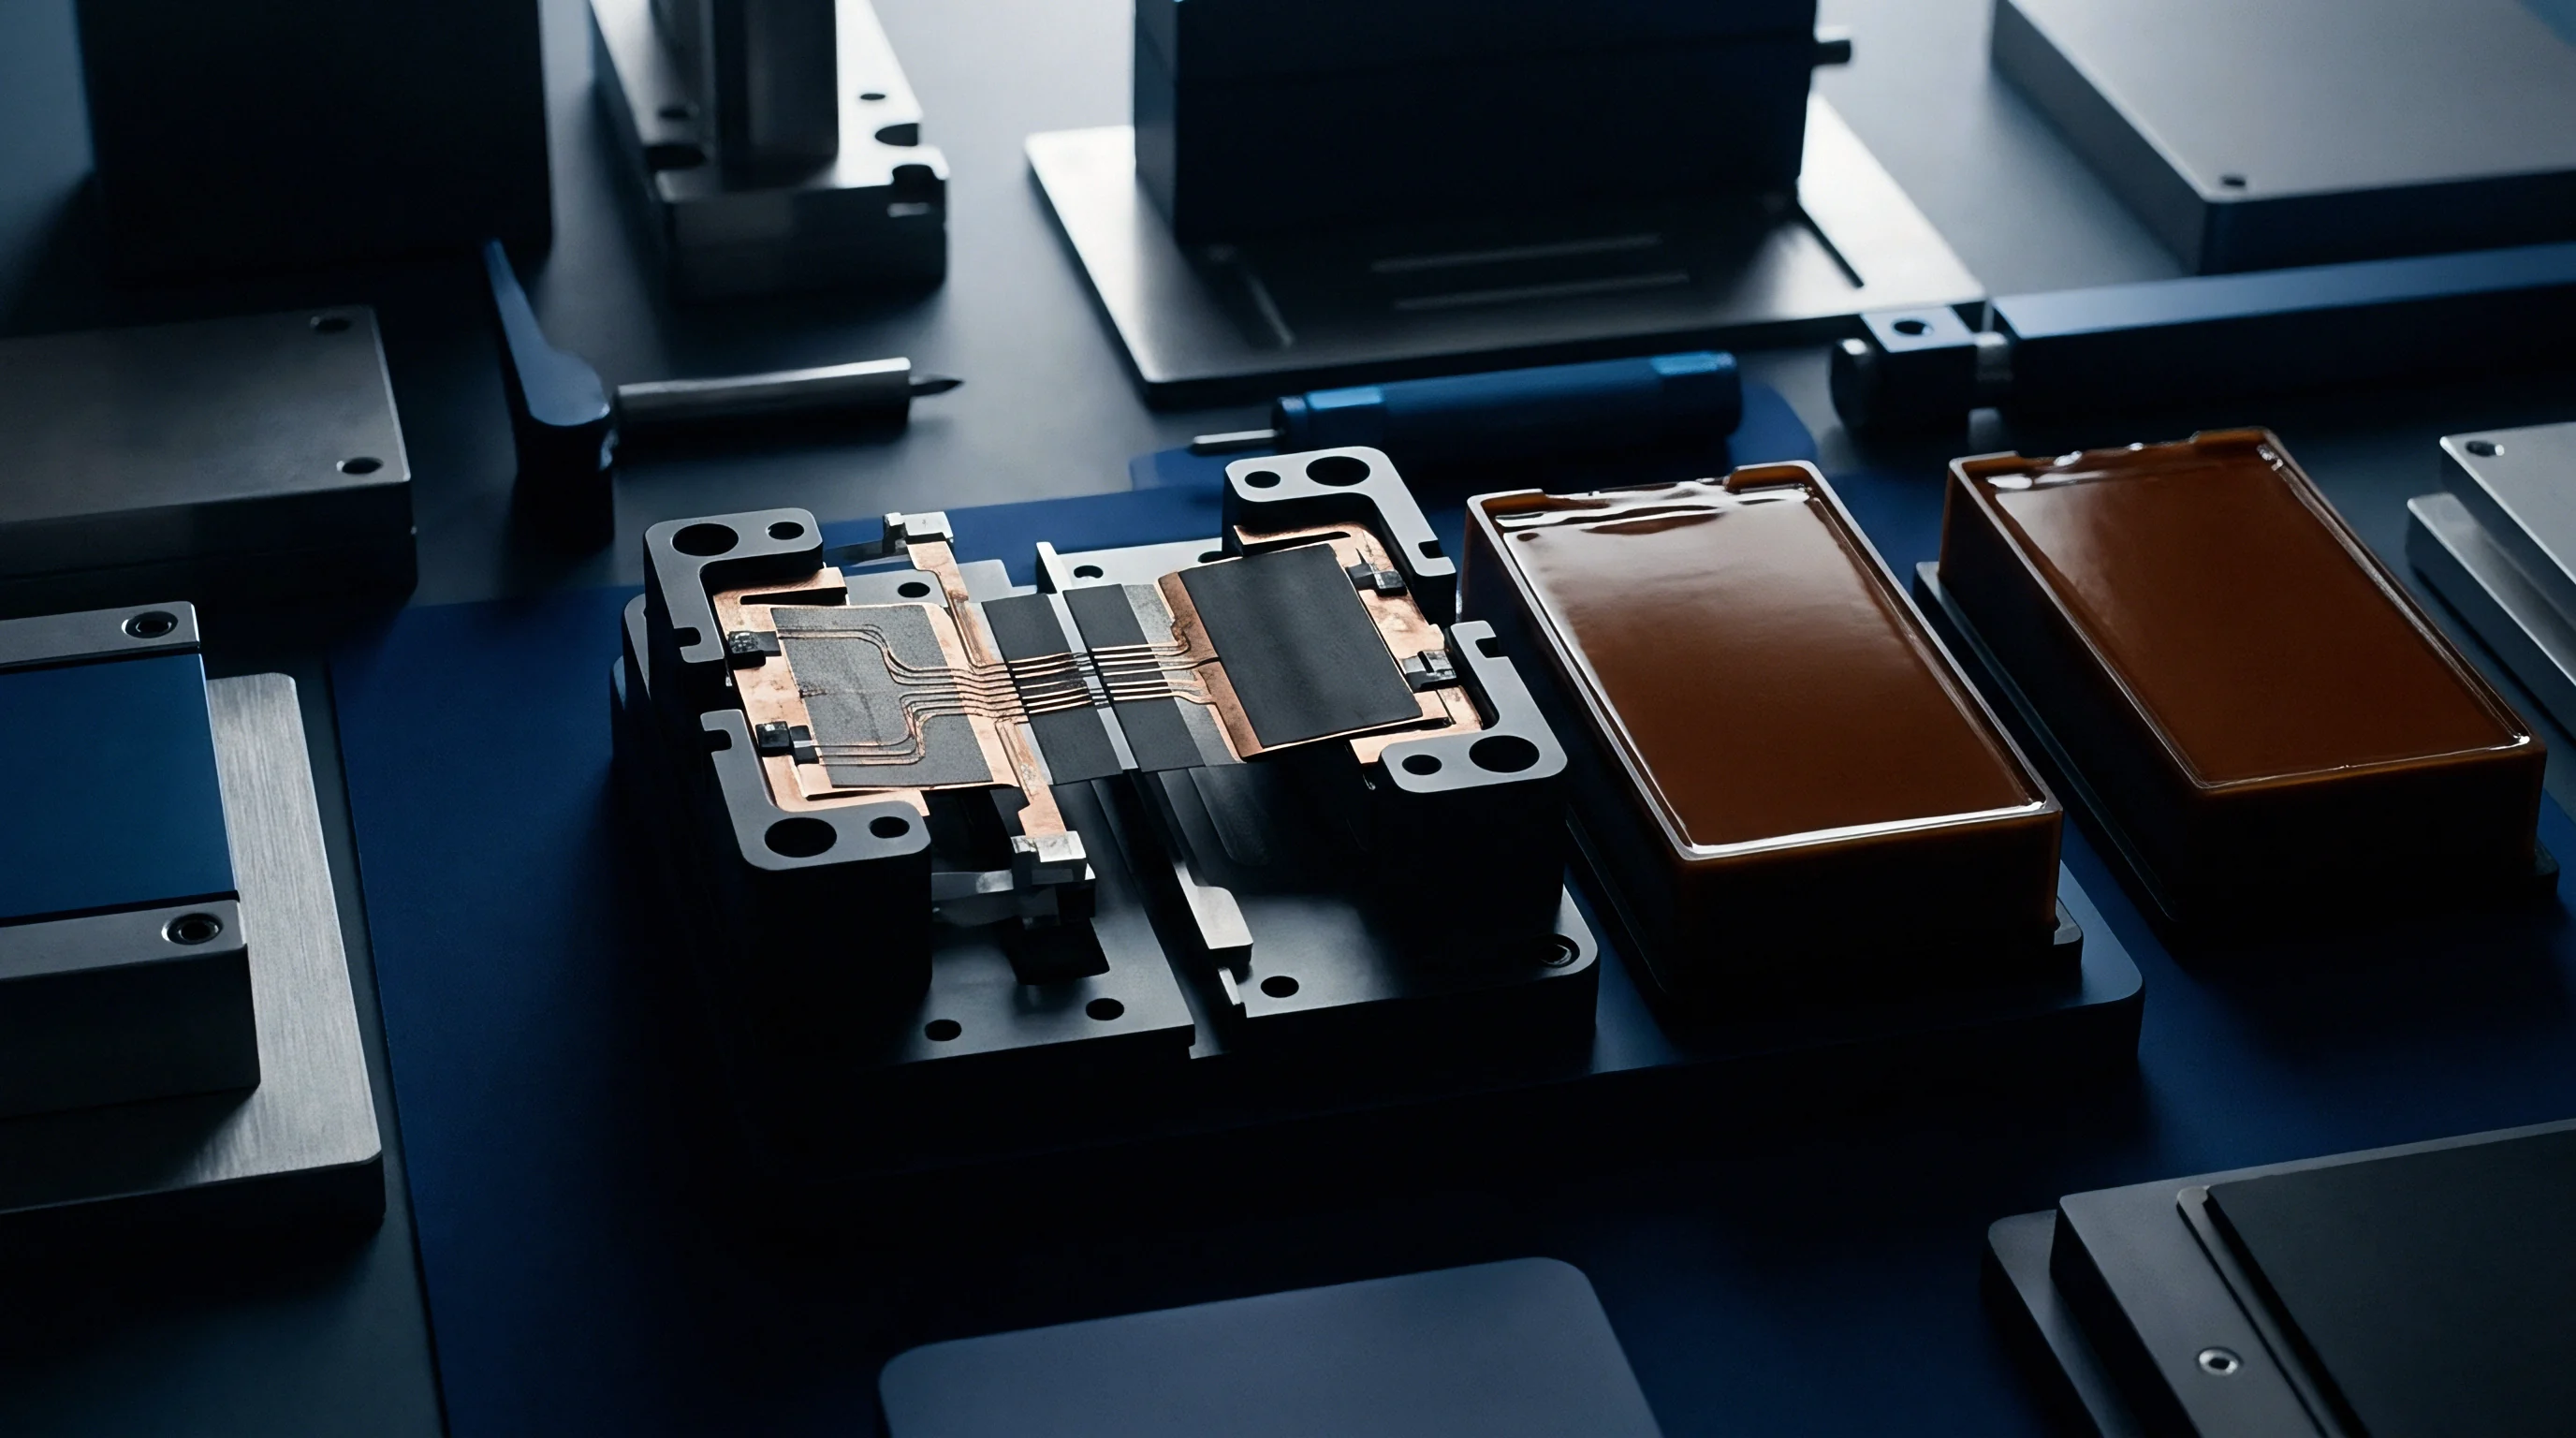
Reference aluminum load blocks fitted with calibrated strain gauges replace live cells during baseline compliance profiling. The reference block matches the external dimensions and mechanical interface geometry of the cell under test. Multi-axis strain gauge rosettes bonded across the block faces measure surface stress distribution directly, while external DIC systems monitor surrounding platen and frame deflection.
Applying dynamic load profiles to reference blocks isolates fixture hysteresis, mechanical backlash, and thermal drift vectors. During a force ramp from zero to twenty kilonewtons, mechanical interfaces like spherical load buttons, threaded rod joints, and platen guide pins settle, producing distinct displacement hysteresis loops. Mapping these loops lets software engineers program directional compliance compensation curves into cycler platforms, ensuring accurate measurement during both expansion and contraction.
Documentation Standards for Tooling Deflection Certificates
Verification dossiers detail platen displacement maps across the full operational temperature and force envelope. Equipment procurement guidelines for automotive and grid-storage battery laboratories mandate traceable structural deflection certificates for all compression fixtures. These certificates provide empirical proof that tooling stiffness meets metrological criteria under specified operating limits.
- Full-Field Deflection Maps Spatial displacement contour plots of platens recorded at zero point five, one point five, and three point zero megapascals across the operating temperature range.
- Component Compliance Breakdown Itemized stiffness metrics quantifying elastic contributions from platens, tie-rods, fasteners, and load cell assemblies under dynamic loading.
- Thermal Expansion Matrices Linear and non-linear thermal growth vectors for structural fixture elements derived across minus thirty to eighty degrees Celsius.
- Sensor Calibration Traceability Documented calibration records for integrated capacitive, optical, or strain-gauge sensors linked to national metrology standards.
Standardized deflection certification protects test integrity and prevents costly contractual disputes between cell suppliers and pack integration teams. When a prototype cell batch fails capacity retention targets during qualification testing, structural deflection certificates demonstrate whether failure stemmed from true electrochemical degradation or uncalibrated tooling compliance. Comprehensive metrological validation ensures test results remain reproducible across global laboratories and differing fixture architectures.
How far should test equipment vendors standardize dynamic structural deflection mapping methods before commercial battery qualification data can be legally cross-referenced between competing OEM laboratories?