Decoupling Surface Thermal Gradients from Differential Capacity Peak Splitting Diagnostics
Decouple surface thermal gradients from differential capacity curves by combining C/50 baseline cycling with multi-point thermistor arrays and model corrections.

Heat

Localized Overpotentials and Surface Temperature Gradients
Differential capacity analysis maps phase transitions in intercalation electrodes by recording small changes in incremental charge storage across narrow voltage windows. When uneven surface cooling occurs across a large-format pouch or prismatic cell, current density concentrates in warmer regions where solid-electrolyte interphase impedance is lower. These warmer areas discharge faster, reaching stage-transition potentials ahead of cooler margins on the same current collector sheet.
A surface temperature difference of four kelvin across an active pouch face shifts local open-circuit potential gradients by over six millivolts during phase transitions.
The aggregate terminal voltage reflects the parallel sum of these thermally uneven electrode regions. Because each region operates along its own local overpotential and temperature-dependent open-circuit voltage curve, taking the derivative of charge with respect to terminal voltage integrates several shifted electrochemical states at once, broadening the resulting differential peak.

Thermodynamic Entropy Coefficients and Potential Displacements
Thermodynamic open-circuit voltage shifts with temperature according to the entropic coefficient of the active material couple. In nickel-manganese-cobalt chemistries paired with graphite, this coefficient swings from negative values at low states of charge to positive values above seventy percent capacity. A five-kelvin temperature difference between the tab region and the cell base creates an entropic potential offset across the electrode face that acts as an intrinsic thermodynamic driving force, independent of applied current.
Applying current over this uneven thermodynamic baseline forces local overpotentials to adjust for both entropic voltage shifts and local variations in charge-transfer resistance. As a result, the composite differential capacity curve splits single distinct peaks into doublets or broad plateaus. Without spatial thermal correction, test engineers analyzing these features frequently misinterpret spatial kinetic spread as active material loss or structural lattice degradation within the cathode.
Supply agreements that tie end-of-life replacement thresholds to specific differential peak heights without defining fixture thermal boundary conditions allow suppliers to dispute legitimate warranty claims under IEC 62660-1 clause 6.2 testing tolerances.

Artifacts
Why Does Spatial Thermal Inhomogeneity Induce False Phase Peaks?
Differential capacity peaks mark phase coexistence regions where electrochemical potential stays nearly flat while lithium transitions between staging configurations. In a uniform, isothermal cell, a staging reaction produces a single sharp peak whose height reflects active electrode mass and whose position marks thermodynamic potential under uniform polarization. When surface temperatures vary spatially, warmer zones experience faster lithium-ion diffusion inside the solid host particles and lower liquid-junction resistance across separator pores.
These warmer zones cross the phase transition earlier during a constant-current ramp, while cooler areas lag behind, completing the same stoichiometric stage at a higher terminal voltage because of increased overpotential. The diagnostic trace splits, causing the aggregate derivative calculation to show two separate local maxima for what is actually a single crystallographic transition.
| Diagnostic Feature | Thermal Gradient Induced Artifact | Loss of Lithium Inventory | Loss of Negative Active Material |
|---|---|---|---|
| Peak Position Shift | Reversible when current rate drops below C/50 or thermal boundary vanishes | Monotonic upward shift on charge across subsequent cycles | Selective shift in high-voltage staging peaks above 3.85 volts |
| Peak Splitting Morphology | Asymmetric doublet matching surface thermocouple delta T distribution | Symmetric peak flattening without secondary crest formation | Secondary peak emergence accompanied by graphite phase shifting |
| Rest-Period Relaxation Rate | Rapid thermal decay matching convective time constant under ten minutes | Zero relaxation effect on differential curve geometry | Zero relaxation effect on equilibrium open-circuit voltage profile |
| C-Rate Sensitivity | Peak splitting disappears entirely at C/100 despite fixed external chillers | Peak area deficit remains constant across C/100 through C/10 rates | Peak ratio changes proportionally with total stoichiometric balance |

Distinguishing Apparent Kinetic Broadening from Active Material Loss
True degradation modes alter the stoichiometric balance of lithium inside the cell. Loss of lithium inventory shifts the operating windows of the positive and negative electrodes relative to each other, translating the differential capacity curve along the voltage axis without splitting individual peaks. Loss of active material reduces the total integrated area beneath chemistry-specific peaks, directly reflecting the reduction in available intercalation sites.
- Anode Stage Doublets appear when through-plane thermal resistance across thick electrode stacks forces surface layers to deintercalate before the inner core reaches the identical state of charge.
- Cathode Peak Flattening develops under planar heat flux conditions where liquid electrolyte conductivity variations stretch the nickel-rich transition peak across an eighty-millivolt window.
- False Plating Signatures emerge during charge relaxation when thermal equalization current flows internally between hot and cold zones, creating a transient differential voltage plateau identical to lithium stripping.
Observed peak doublets can easily stem from testing chamber cooling air currents rather than cell manufacturing defects.
Separation
What Sensor Array Density Is Sufficient for Reconstruction?
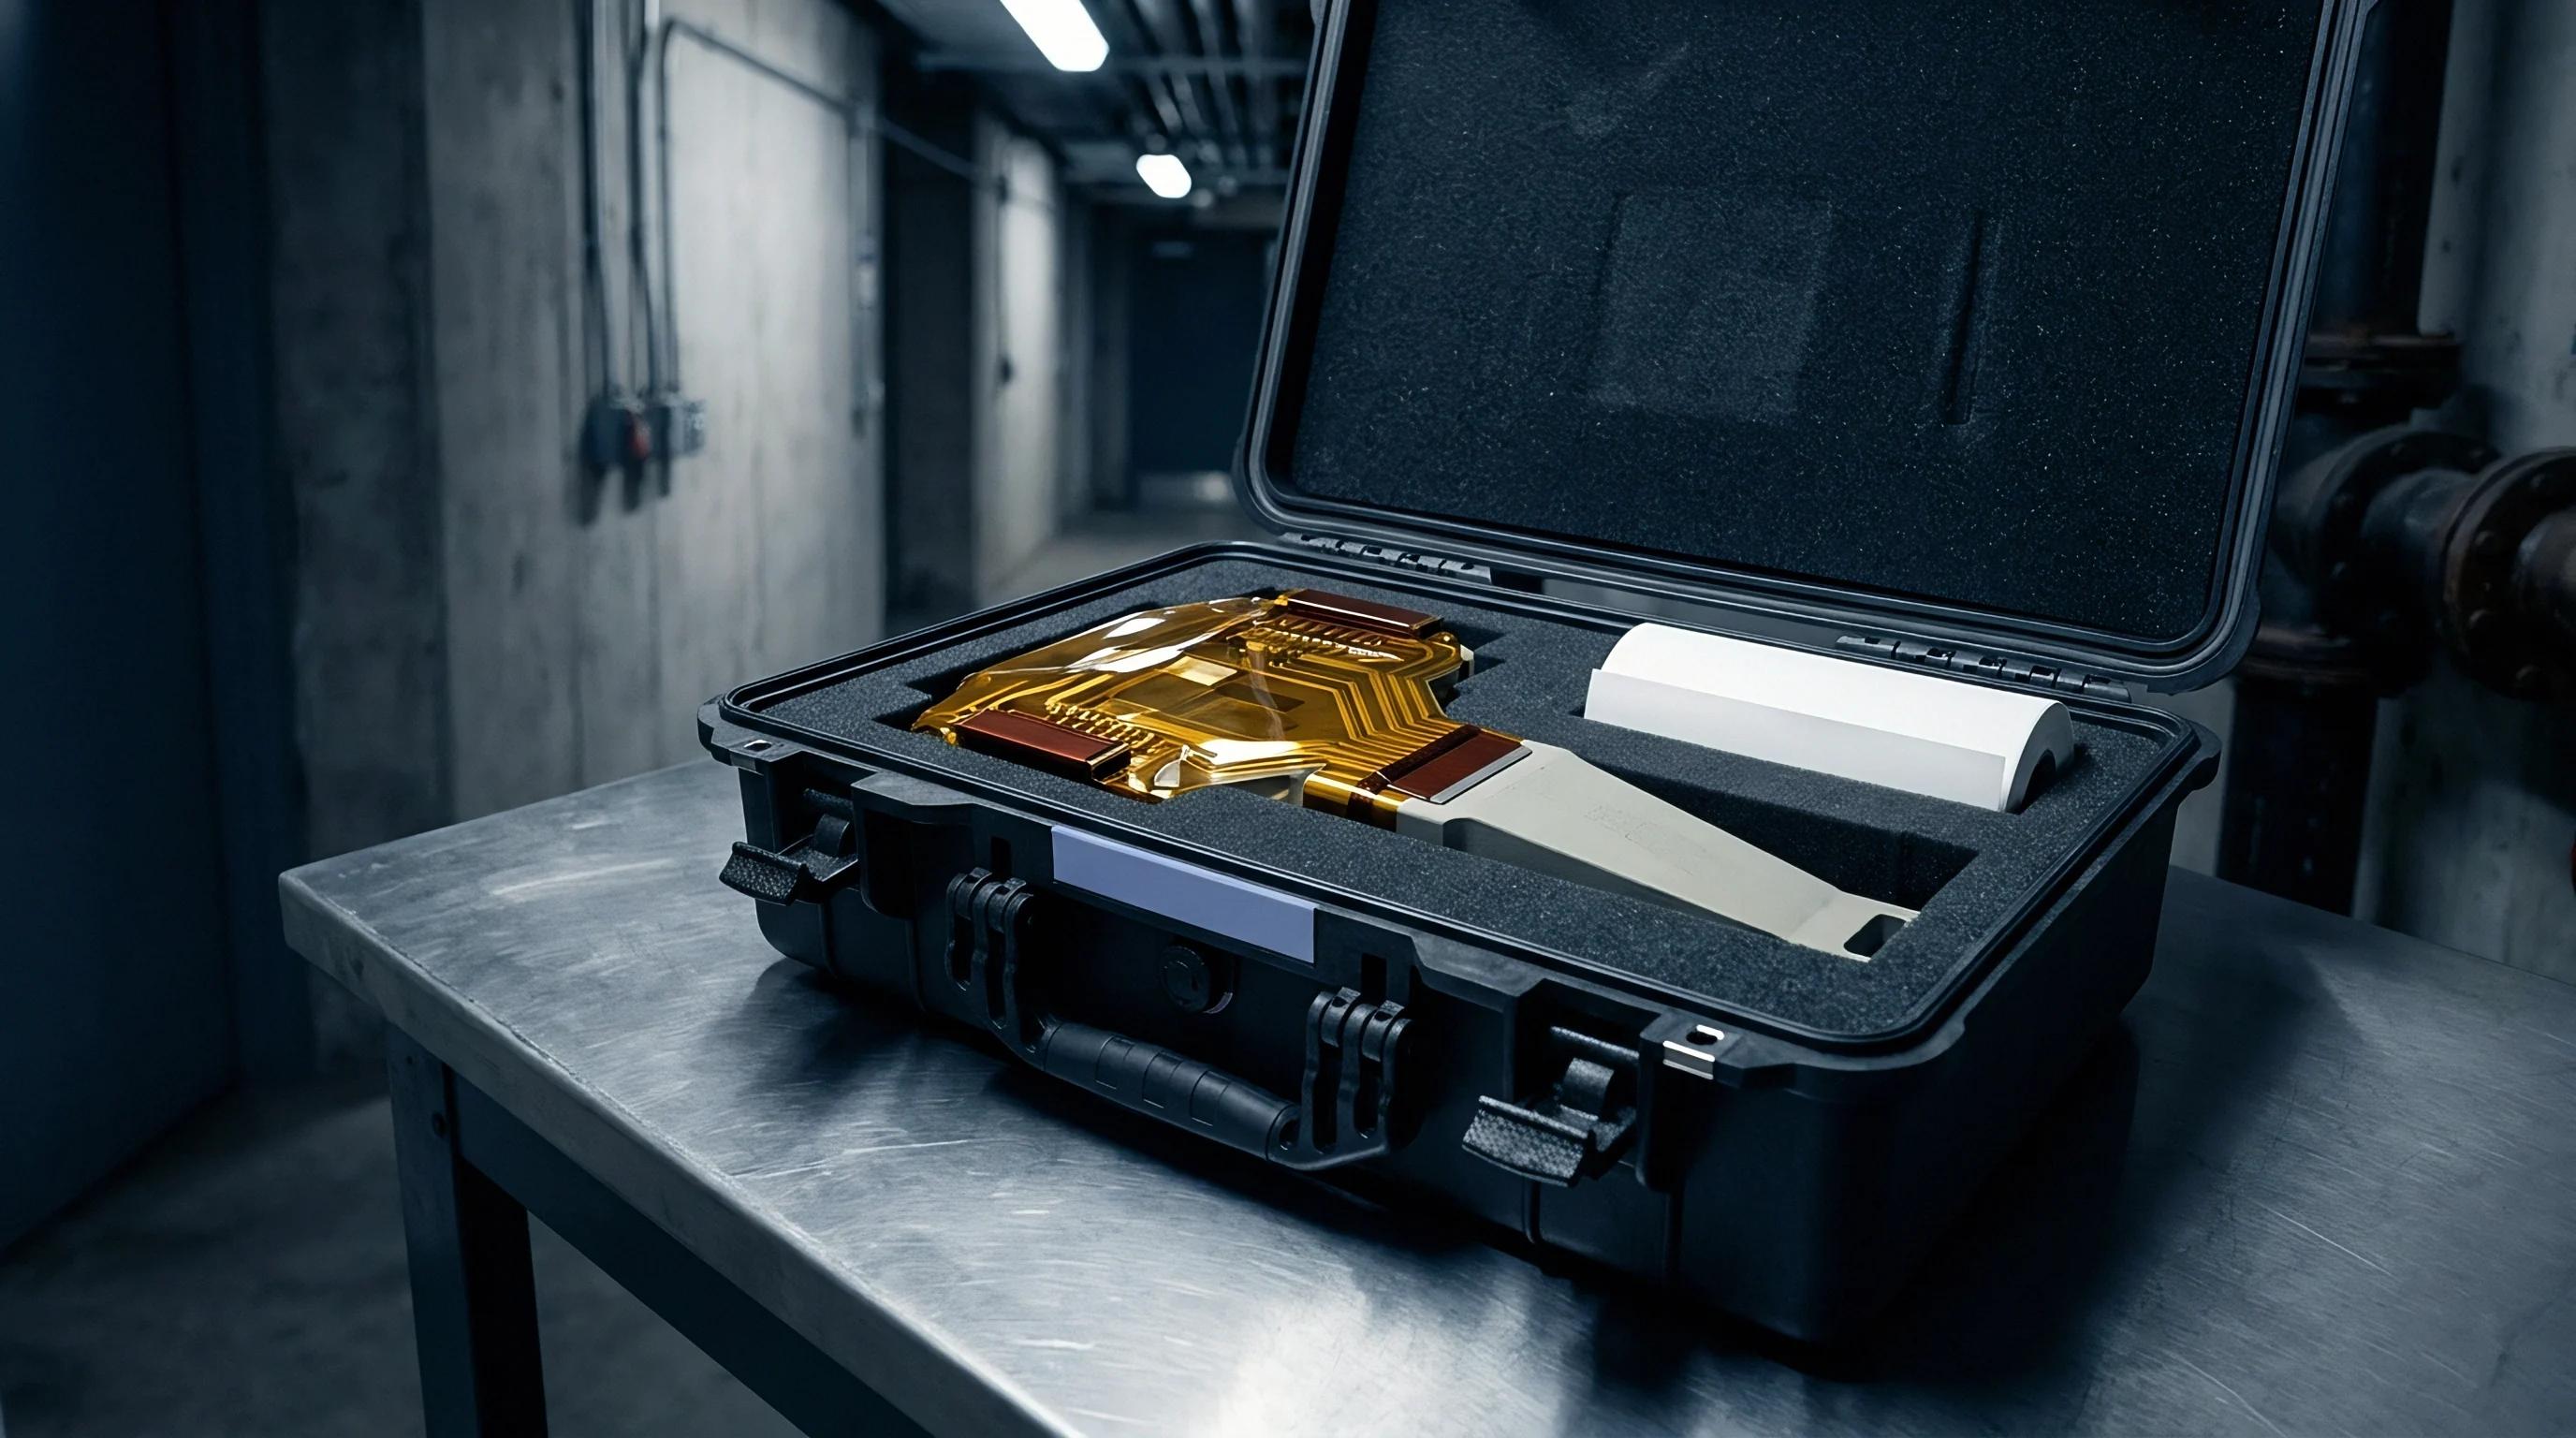
Resolving true electrochemical peak splitting requires multi-point surface temperature tracking synchronized with current-voltage logging. A single thermocouple mounted at the cell center misses edge effects and tab-junction Joule heating. Surface thermocouple matrices arranged on a forty-millimeter grid map the full spatial temperature field across both faces of large-format automotive cells.
Standard test chambers without surface heat flux monitoring pass thermally distorted capacity data straight into degradation classifiers.
Mathematical decoupling uses a distributed equivalent circuit model that divides the cell surface into parallel sub-elements. Each sub-element incorporates an empirical entropic coefficient function alongside Arrhenius-governed charge-transfer resistance. Based on measured surface temperatures, the algorithm solves for local current distribution across all nodes and subtracts the thermal overpotential component from terminal voltage before computing differential capacity derivatives.
| Grid Resolution | Sensor Type | Thermal Delta T Limit | Decoupling Fidelity |
|---|---|---|---|
| Point Center | Single Type-T Thermocouple | Over 5.0 Kelvin | Fails to detect tab cooling artifacts |
| Four Corner Dual Tab | Four-Wire RTD Class A | 1.5 to 3.0 Kelvin | Resolves macro planar splitting |
| 40mm Grid Array | Calibrated NTC Thermistor Foil | 0.3 to 1.0 Kelvin | Isolates individual electrode phase peaks |
| Infrared Micro-bolometer | Operando Thermal Imaging Array | Under 0.2 Kelvin | Enables full spatial deconvolution |

Operando Spatial Deconvolution Protocols
When sensor density is constrained inside sealed commercial packs, dynamic rate-switching protocols help verify peak origins. The sequence drops the current from C/10 to C/50 just before an anticipated phase transition voltage. If the differential capacity doublet collapses into a single sharp peak at the lower rate, the original splitting was caused by thermally driven kinetic overpotential gradients.
Decoupling algorithms encounter mathematical instability when separating phase transitions in blended cathode chemistries, such as nickel-cobalt-manganese mixed with lithium iron phosphate, where flat two-phase plateaus overlap with steep single-phase solid solution regions within the same thermal operating window.


Boundary

Thermal Chamber Fixturing and Compression Tooling
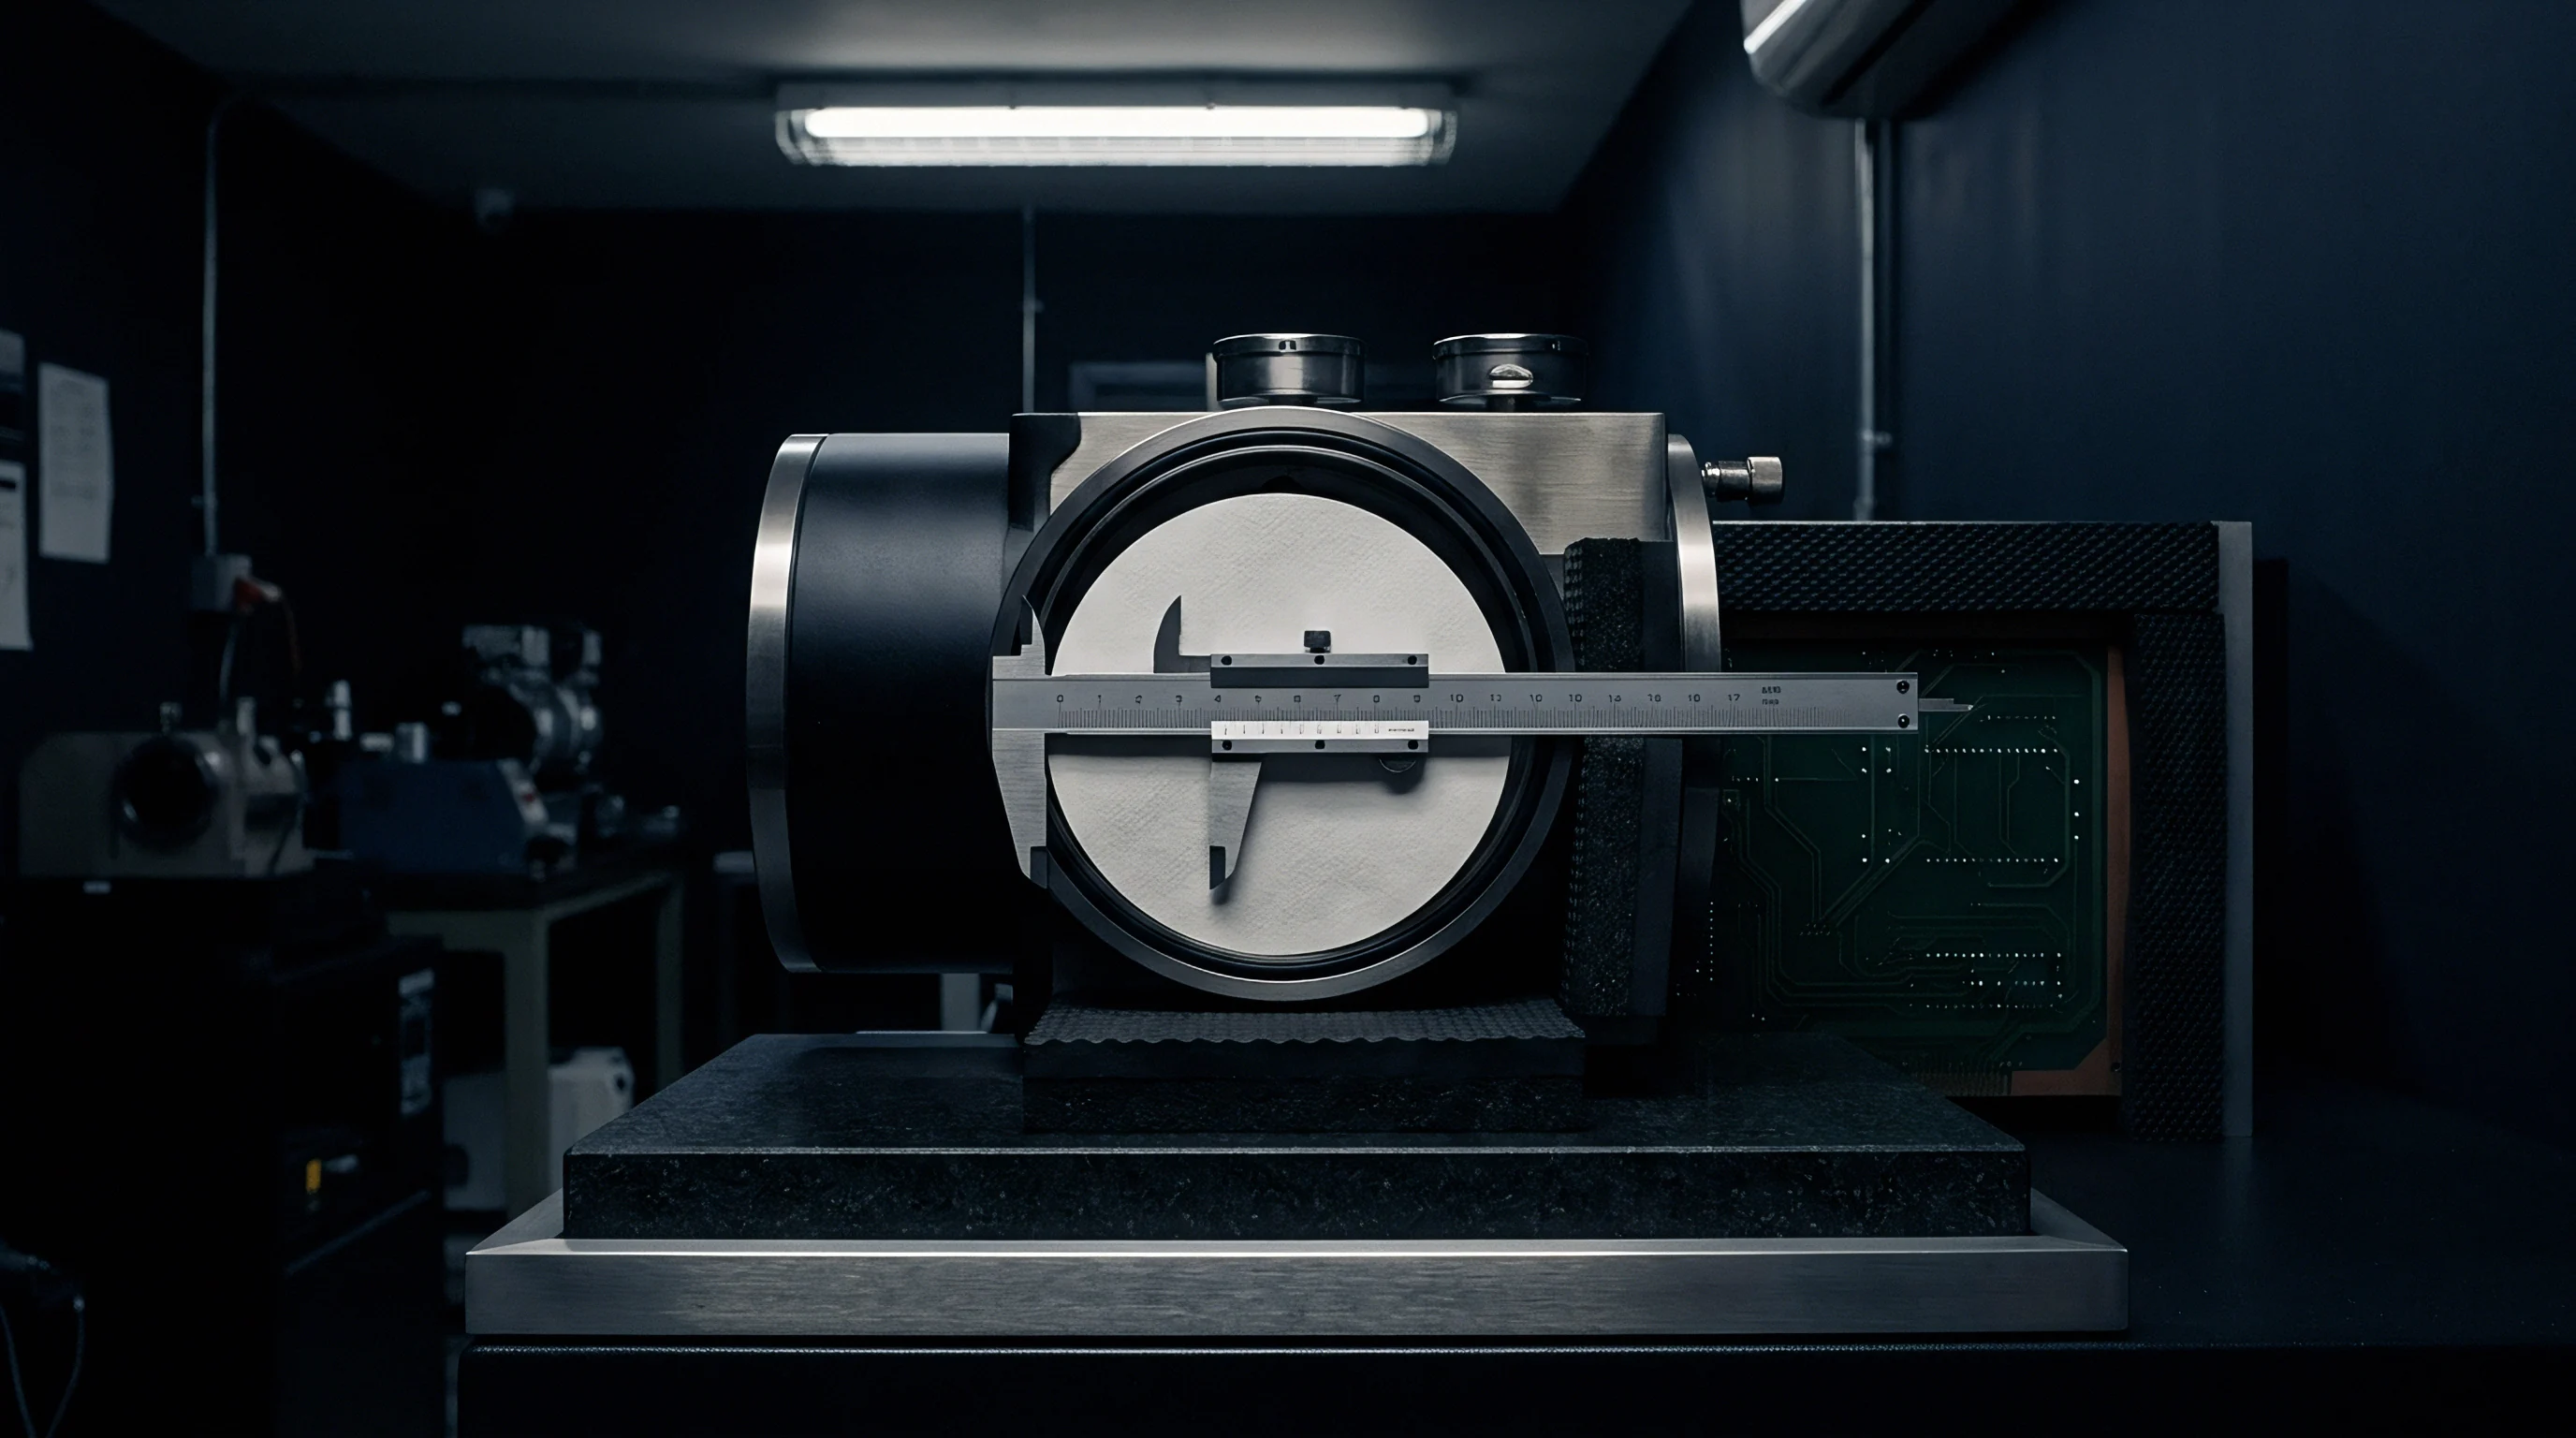
Test fixtures for differential capacity screening must eliminate asymmetric thermal paths. Uninsulated aluminum clamping plates act as heat sinks that pull energy from the cell faces while leaving the tabs exposed to ambient convection. Standardizing fixture thermal mass requires non-conductive compression plates combined with active surface heat-flux control.
IEC 62660-1 Section 6.2 enforces ambient stabilization to eliminate baseline temperature shifts before capacity measurement.
Applying uniform mechanical pressure between zero point two and zero point four megapascals keeps contact resistance steady across internal electrode layers. Uneven compression produces local variations in interfacial thermal resistance; areas with lower contact pressure form hot spots under heavy current loads, creating internal thermal gradients that external surface thermistors cannot detect.
- Thermal Soak Interval enforces a minimum three-hour dwell period inside the environmental chamber at twenty-five degrees Celsius before initiating diagnostic cycling.
- Current Step Limitation restricts the baseline diagnostic charge and discharge current to a rate not exceeding C/25 across the entire open-circuit voltage characterization window.
- Surface Variance Threshold aborts the diagnostic sequence whenever differential surface temperature sensors register a gradient exceeding zero point five kelvin across the active area.
- Convective Airflow Shielding isolates the cell under test inside an insulated secondary enclosure to prevent forced air currents from creating localized cooling zones on the casing.
Allowing an extended equilibrium dwell period restores thermal and electrochemical balance across the cell.
Stable chamber temperatures do not guarantee internal thermal homogeneity when cycling cells through high-entropy phase transitions.

Warranty

Incoming Inspection Standards and Disputed Batch Rejections
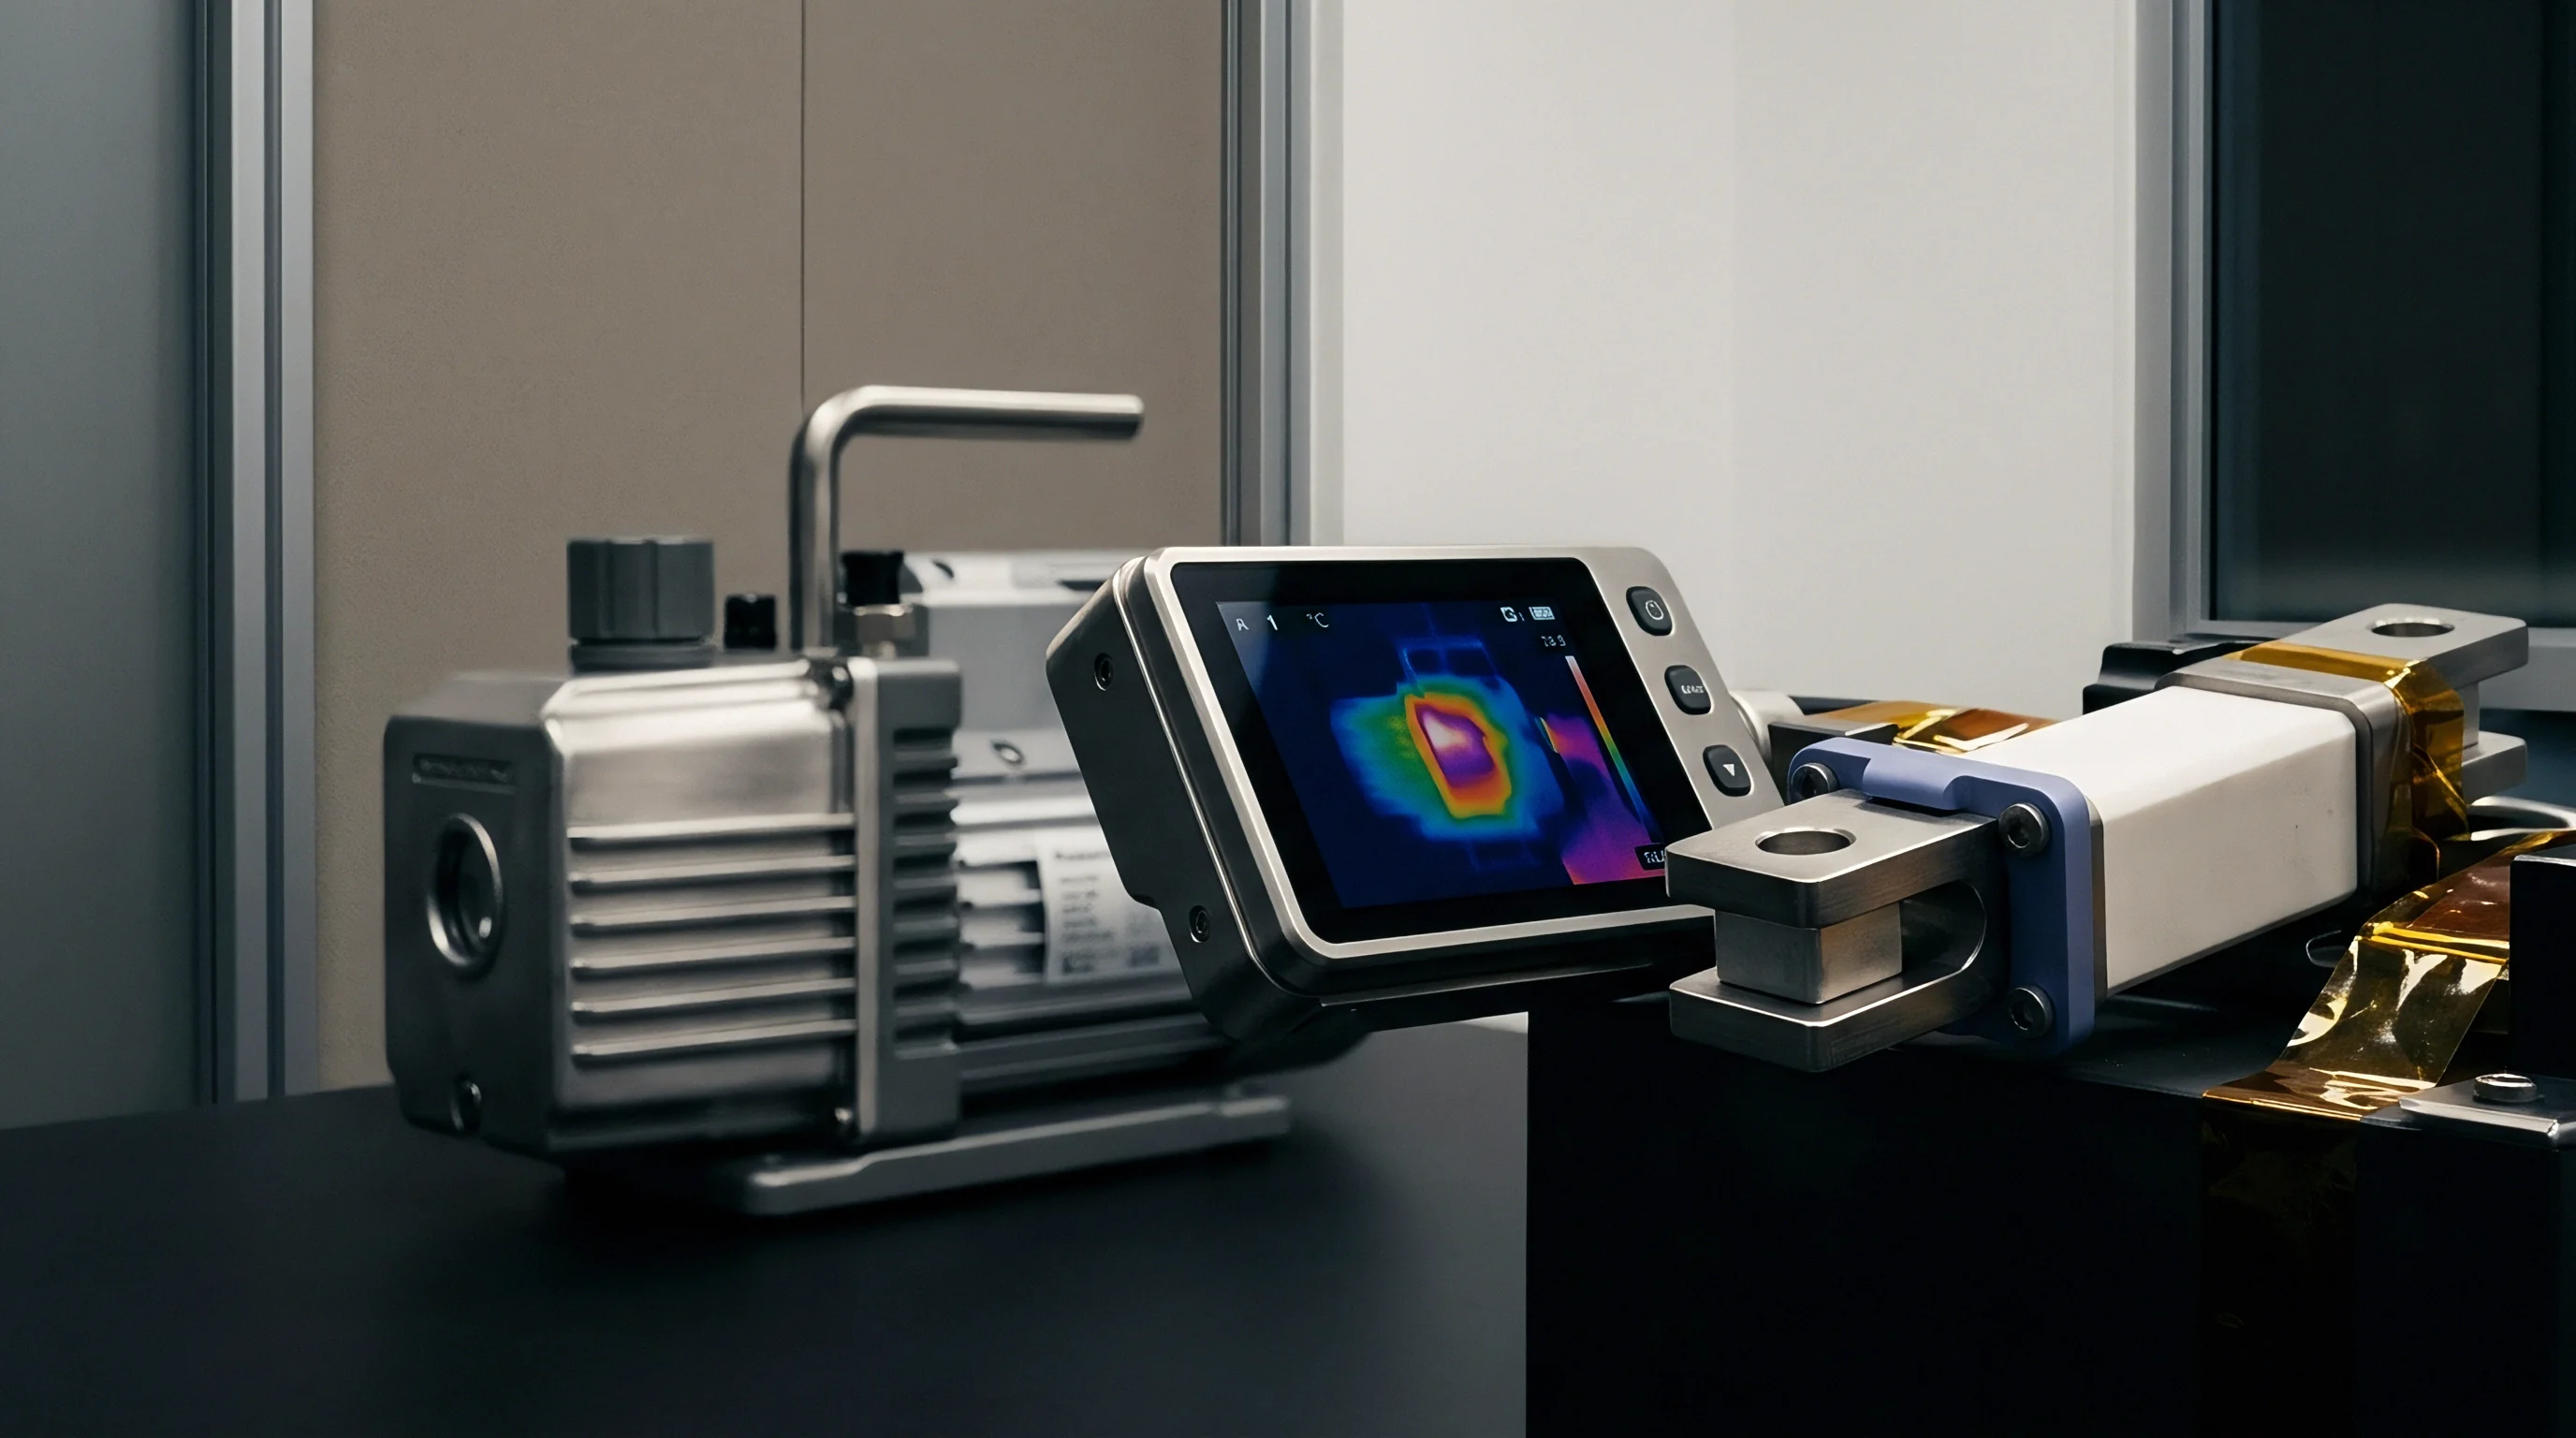
Commercial battery procurement contracts often specify differential capacity peak thresholds as incoming quality criteria. Buyers use automated dQ/dV algorithms to check fresh cells for early electrode degradation, manufacturing inconsistencies, or off-spec material blending. When testing laboratories run these screens without strict thermal gradient controls, false peak splitting can trigger unwarranted batch rejections.
Cell thermal asymmetry during diagnostic cycling dissolves the baseline evidence needed to enforce supplier degradation penalties.
Suppliers routinely challenge these rejections by demonstrating that peak splitting artifacts disappear when cells are tested in an isothermal mineral oil bath. The financial consequences of invalid rejections add up quickly through freight demurrage, testing delays, and lost production capacity.
Defining explicit technical testing parameters in the master purchase agreement protects both parties. Contracts need to specify exact fixture geometry, maximum surface thermal gradients, sensor placement rules, and the filtering algorithms applied to raw differential capacity data. Omitting explicit thermal stabilization criteria leaves the buyer liable for testing costs and storage fees if incoming quality claims fail in formal arbitration.