Differential Capacity Signal Distortion under Intra-Cell Thermal Non-Uniformity
Intra-cell thermal gradients skew differential capacity signals, masking true health states and invalidating supply contract warranty baselines.

Heat
Large-format lithium-ion cells develop internal temperature variations across the active electrode sheet during fast charging, pulse discharge, or continuous cycling under surface cooling. In a 280 Ah lithium iron phosphate prismatic cell or a 100 Ah nickel-manganese-cobalt pouch cell, core temperatures routinely run 4 °C to 14 °C higher than tab and surface temperatures, depending on current levels and thermal boundary conditions. This temperature gradient undermines the assumption that the electrode sheet maintains a uniform thermodynamic state and kinetic capability.
As a result, when diagnosing degradation through differential capacity curves, terminal measurements reflect the combined output of thousands of surface elements operating at different temperatures rather than a single uniform electrochemical domain.
Differential capacity analysis measures the derivative of cumulative charge relative to terminal voltage during low-rate galvanostatic cycling. Under ideal conditions, true equilibrium differential capacity peaks mark phase coexistence regions, staging transitions in intercalation anodes, and structural phase changes in cathodes. But when temperature gradients develop across the cell, each local region operates on a distinct equilibrium potential curve shifted by its entropic coefficient.
At the same time, local exchange current densities follow Arrhenius behavior, lowering charge transfer resistance in warm spots while cool spots face higher overpotentials. Because terminal voltage forces these thermally disparate zones into a parallel electrical network, the overall measured signal gets distorted.

Spatial Decoupling of Intercalation Phase Boundaries
Solid-state lithium-ion diffusion within active host materials scales exponentially with local temperature. In cooler parts of the electrode sheet, slower solid-state transport drives local surface concentrations to phase boundaries earlier than predicted by average state of charge. Warm areas draw higher current flux and lithiate faster, while cooler sections lag behind.
The resulting terminal voltage records a blended surface potential that smooths out sharp, distinct voltage plateaus.
Entropic potential shifts worsen this blurring. Lithium iron phosphate cathodes show a small negative entropic coefficient near minus 0.08 millivolts per Kelvin across two-phase regions, while graphite anodes exhibit distinct entropic shifts up to plus 0.15 millivolts per Kelvin across intercalation stages. A 10 °C gradient across the electrode plane creates an open-circuit potential offset of 1.5 millivolts between the warm core and cool margins.
This voltage imbalance drives circulatory currents within the cell during low-rate diagnostic rests, redistributing internal charge even when zero external current is flowing.
Thermal gradients shift local phase equilibrium potentials, driving intra-cell circulatory currents that alter peak symmetry prior to terminal voltage relaxation.
When charging at a nominal C/20 rate with a 12 °C gradient from surface to core, core current density can top C/12 while outer margins drop below C/35. Differential capacity peaks recorded under these conditions suffer non-uniform voltage compression. Peak positions shift to higher voltages during charge and lower voltages during discharge, mimicking an increase in ohmic resistance.
Yet the actual cause is dynamic spatial current redistribution, not uniform film growth or bulk contact failure.

Mathematical Formulation of Parallel Domain Current Redistribution
Analyzing this distortion requires dividing the cell volume into discrete parallel electrochemical branches connected at common current collector terminals. Total terminal current equals the integrated sum of local current density across the active sheet. Local terminal voltage equals the local open-circuit potential combined with local overpotentials from charge transfer, solid-state diffusion, and electrolyte transport across current collector foils.
Local current density adjusts continuously to balance terminal voltage across branches. Warm regions with higher exchange current densities operate at lower charge transfer overpotential, pulling in more of the total terminal current. Cooler, higher-impedance zones shed current into those warm spots.
The overall measured differential capacity ends up equal to the area-weighted sum of local differential capacities plus a cross-coupling term that reflects how the thermal gradient evolves over time.
If thermal gradients shift during a diagnostic sweep, this cross-coupling term creates false peaks or dampens genuine diagnostic features. A growing temperature gradient during charge concentrates current in warm zones, causing phase transitions there to finish early. This staggered transition splits what should be a single differential capacity peak into a double peak, leading automated diagnostic software to mistakenly flag structural degradation or secondary phase formation.
| Chemistry Type | Spatial Gradient | Exchange Current Shift | Entropic Potential Bias | Peak Width Distortion |
|---|---|---|---|---|
| LFP / Graphite (280 Ah Prismatic) | 5 °C | + 38 percent in core | 0.75 mV shift | + 12 mV broadening |
| LFP / Graphite (280 Ah Prismatic) | 10 °C | + 84 percent in core | 1.50 mV shift | + 28 mV broadening |
| LFP / Graphite (280 Ah Prismatic) | 15 °C | + 145 percent in core | 2.25 mV shift | + 49 mV broadening |
| NMC-811 / Graphite (100 Ah Pouch) | 5 °C | + 42 percent in core | 0.45 mV shift | + 9 mV broadening |
| NMC-811 / Graphite (100 Ah Pouch) | 10 °C | + 91 percent in core | 0.90 mV shift | + 21 mV broadening |
| NMC-811 / Graphite (100 Ah Pouch) | 15 °C | + 158 percent in core | 1.35 mV shift | + 38 mV broadening |
Measurements across multiple diagnostic channels show that thermal gradients above 5 °C distort the peak area calculations used to quantify active material loss. For anode lithiation peaks, area under-counting reaches 8 percent under a 10 °C gradient, as signal smearing pushes peak tails out into adjacent baseline voltage ranges.

Dynamic Thermal Time Constants versus Diagnostic Sweep Rates
Diagnostic protocols rely on ultra-low C-rates to limit thermodynamic distortion. A standard C/20 sweep takes 20 hours for a full charge, giving ambient heat transfer time to balance cell temperature. Even so, low-rate heat generation is dominated by entropic reversible heating, which flips sign as the cell moves through lithiation phases.
This entropic heating switches between exothermic and endothermic responses across a single charge cycle. In graphite anodes, transitioning from stage 1 to stage 2 absorbs heat and cools the core, while subsequent staging steps release heat. These internal thermal shifts alter core temperatures even when the cell rests in an isothermal liquid bath.
As the dynamic temperature gradient fluctuates, dQ/dV peak positions wander back and forth against terminal voltage.
Tests with micro-thermocouples embedded inside high-capacity prismatic cells confirm this behavior. During low-rate sweeps inside environmental chambers, entropic heat reversals alone caused internal temperature oscillations up to 2.8 °C. Diagnostic routines monitoring terminal voltage mistook these thermally driven potential shifts for non-linear kinetic resistance. The resulting uneven temperature field splits local SOC trajectories across the electrode plane, creating a spatial state-of-charge imbalance that remains long after diagnostic currents stop.
These measurement errors feed directly into remaining useful life models. When distortion alters peak height and voltage alignment, state-of-health algorithms miscalculate available lithium inventory. Because this peak attenuation mimics actual capacity loss, viable cells end up falsely rejected during qualification audits.

Foil
Current collector foils in large-format cells act as both electrical conduits and heat paths. Copper on the anode and aluminum on the cathode carry electronic current to external tabs while conducting internal heat out toward cell surfaces. In high-aspect-ratio cells or designs with tabs along a single edge, current path lengths vary widely across the active area, coupling electrical resistance directly to thermal transport.
Copper has a high thermal conductivity near 385 Watts per meter-Kelvin, while aluminum conducts heat at about 205 Watts per meter-Kelvin. Heat generated deep in the cell core must pass through multiple layers of separator, active coatings, and foil before reaching cooling plates. Transverse thermal conductivity through the laminated stack is remarkably poor ~ just 0.5 to 1.5 Watts per meter-Kelvin ~ because of low-conductivity polymer separators and porous coating structures.
As a result, heat flows mainly along current collector foils toward the tabs.
Current Density Concentration at Tab Terminals
Tab connection points naturally concentrate current pathways. Near tab weld zones, local current density in the foils peaks, creating localized Joule heating hotspots. These hotspots raise temperatures at the top of the electrode stack while the bottom stays cooler, establishing an axial temperature gradient along the foil plane.
Current distribution along current collector foils follows Poisson equations for electrical potential. Combined with temperature-dependent impedance in the active layer, current flows preferentially into active material near the tabs at the start of a charge pulse. As current flows, regions near the tabs warm quickly, dropping charge transfer resistance and drawing even more current.
This thermal-electrical feedback loop concentrates electrochemistry into specific regions of the foil stack.
Localized foil heating near tab connection points concentrates current flux, creating spatial state-of-charge offsets across continuous electrode surfaces.
In high-aspect-ratio cells, tab-induced thermal gradients skew the state of charge across the electrode sheet. During low C-rate sweeps, regions near the tabs reach full lithiation well before the bottom margins. Terminal differential capacity measurements record a composite signal: tab-adjacent material completes its phase transition while lower sections are still mid-transition, broadening the combined peak along the voltage axis.
Electrochemical Failure Modes Triggered by Decoupled Thermal Domains
Thermal gradients across foil surfaces trigger distinct local failure modes that compound capacity loss and signal distortion over extended cycling. Distorted differential capacity spectra often hide these localized failures, showing a generalized loss of active lithium when localized structural damage is actually occurring.
- Lithium Plating occurs in cool electrode regions near metallic tabs or cell edges during fast charging, where elevated local overpotentials push anode potential below zero volts against metallic lithium.
- Active Material Delamination develops in warm core zones where high cyclic current density accelerates volumetric expansion and contraction, breaking mechanical binder bonds at the current collector foil interface.
- Electrolyte Decomposition accelerates in localized thermal hotspots where elevated temperature speeds up parasitic reductive reactions, consuming active lithium and growing thick solid electrolyte interphase films.
- Particle Cracking strikes high-voltage cathode materials exposed to localized current concentration, where steep intra-particle concentration gradients generate high mechanical stress fields.
- Current Collector Corrosion initiates on cathode aluminum foils in regions experiencing elevated local temperatures combined with localized high voltage polarization during deep discharge end-points.
Under strictly isothermal conditions, these failure mechanisms leave clear thermodynamic signatures in differential capacity spectra. But when temperature variations exist during testing, diagnostic peak features from local failure modes overlap and blur together. Thermal peak broadening masks the sharp, narrow attenuation typical of localized lithium plating, rendering non-destructive monitoring uninformative.
Anode Phase Staging Distortions under Lateral Heat Transport
Graphite anodes undergo step-by-step phase transitions during lithiation, progressing through stage 4, stage 3, stage 2, and stage 1 compounds. Each transition matches a distinct open-circuit voltage plateau and produces a sharp peak in differential capacity plots. Identifying these staging peaks clearly allows tracking of anode degradation, including active graphite loss and localized over-lithiation.
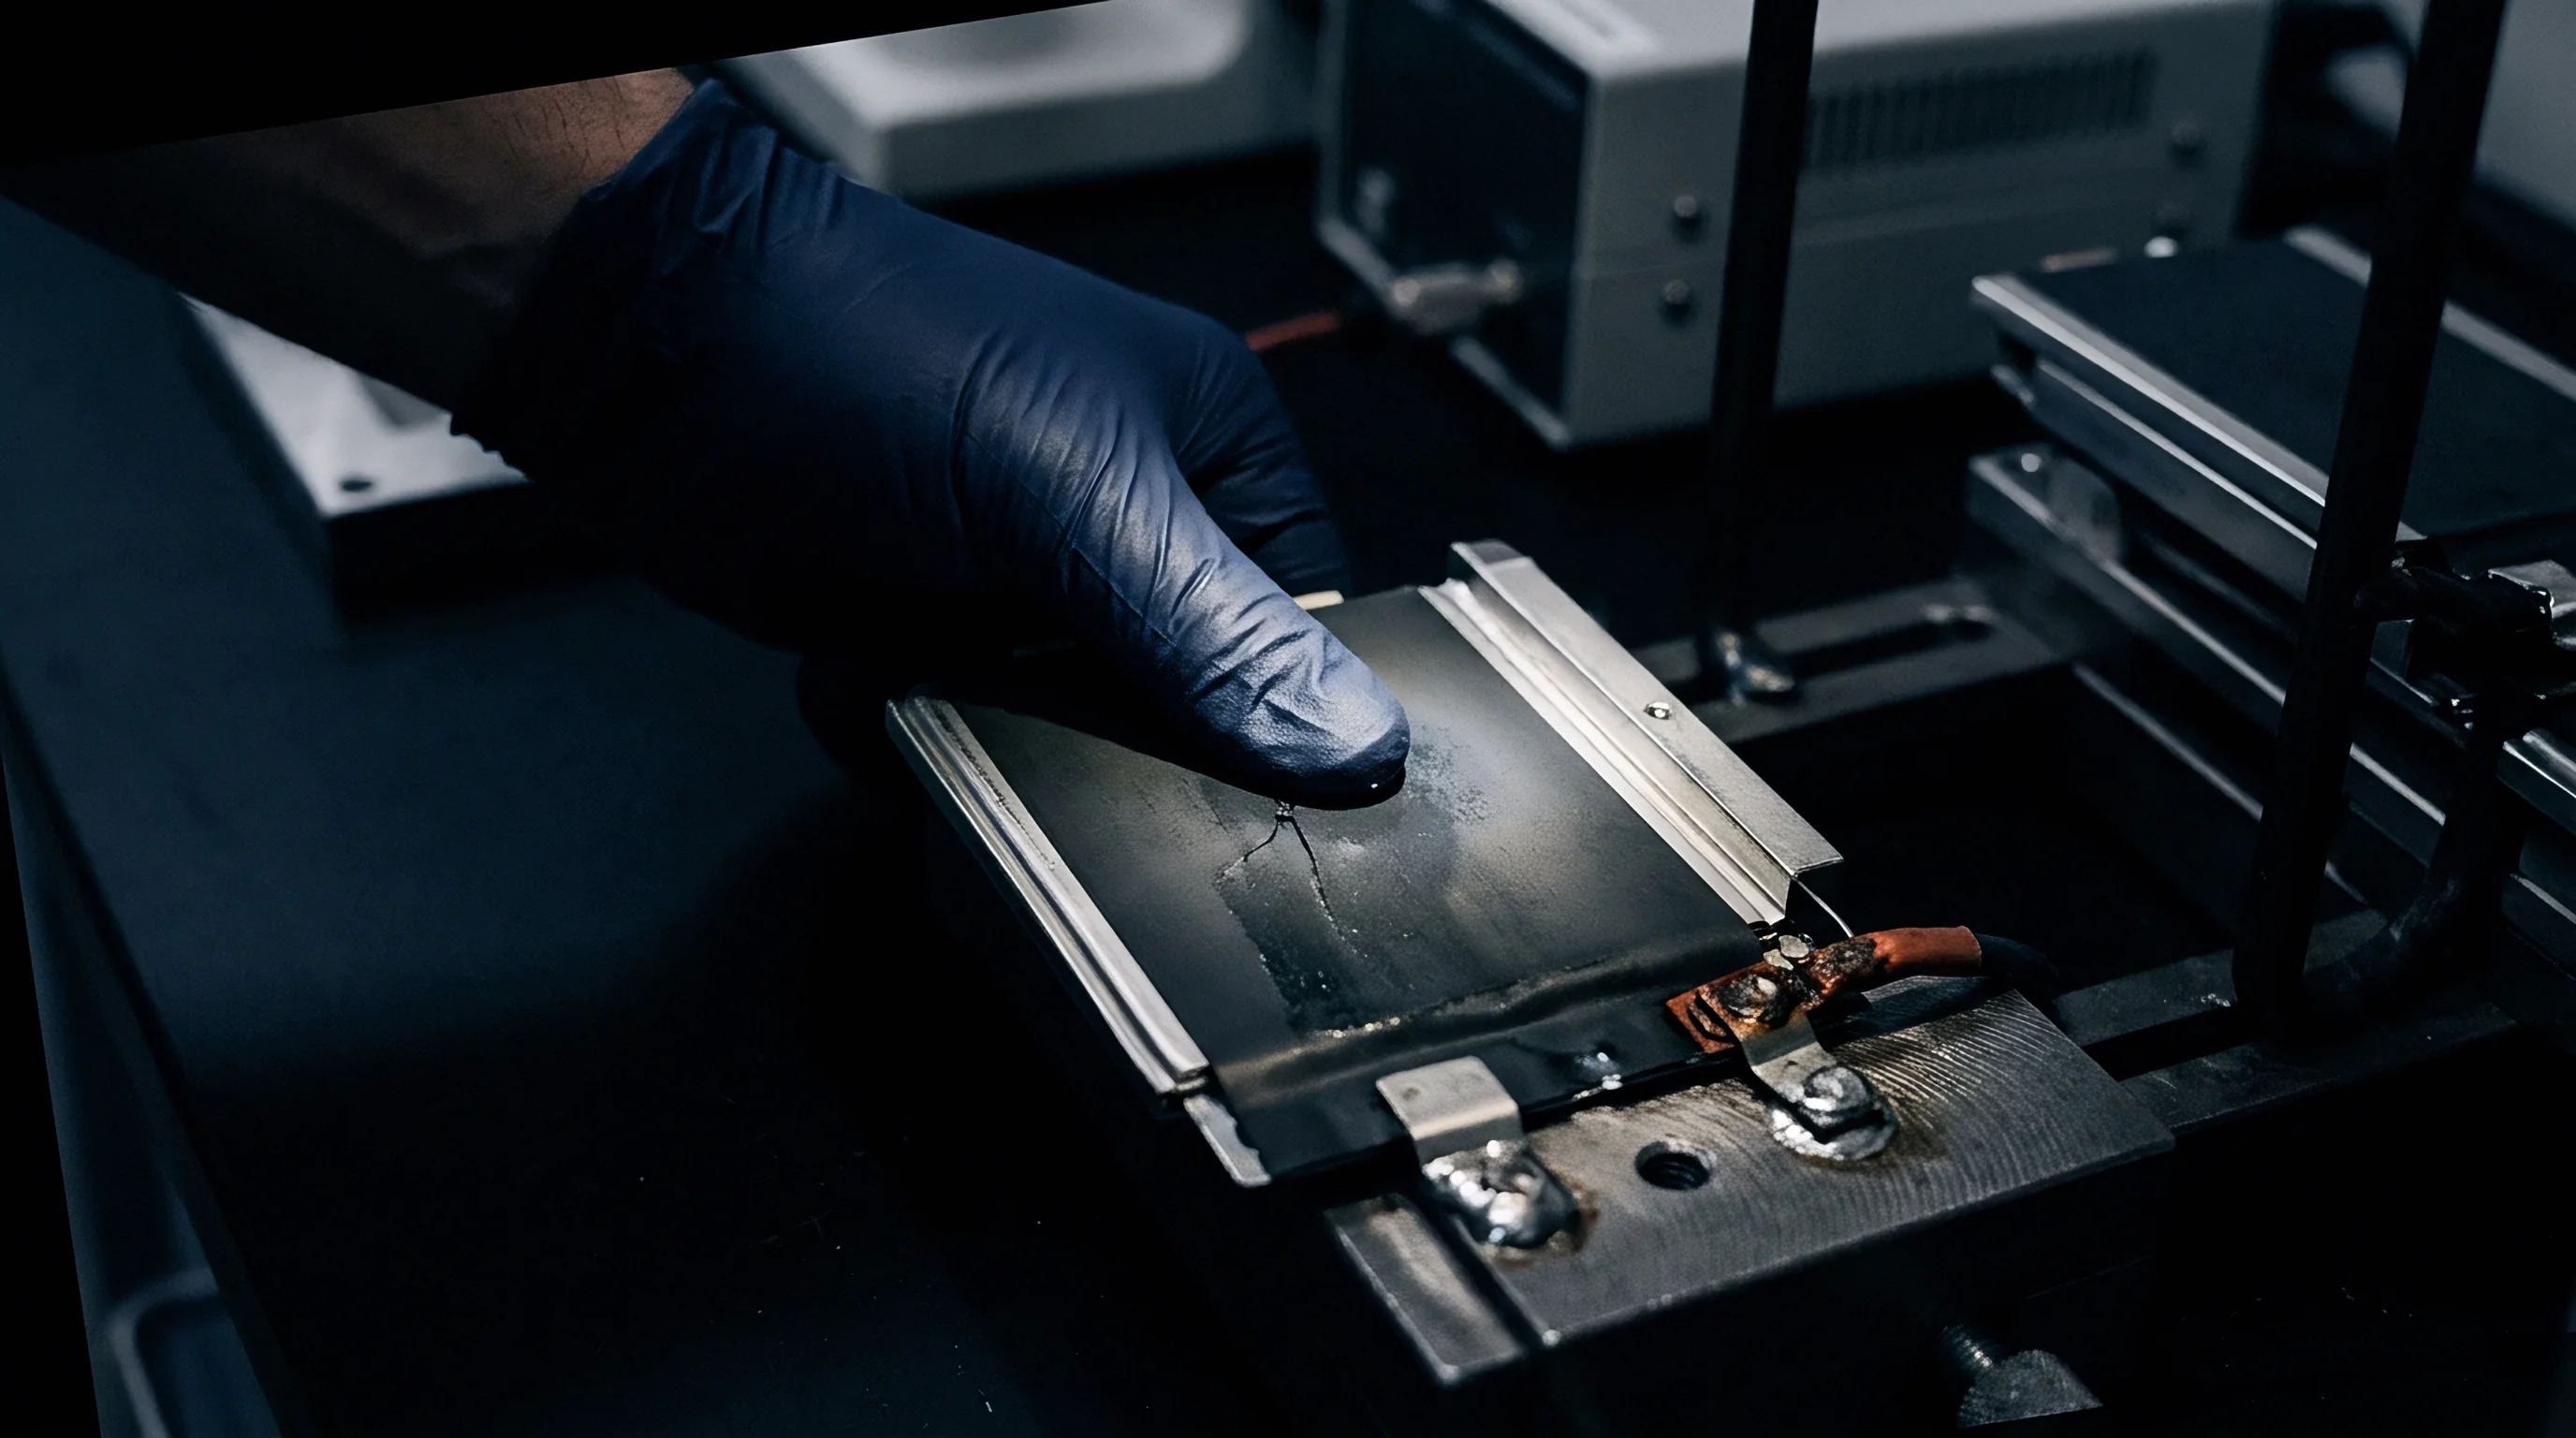
Lateral heat transport along copper current collectors alters the timing of these phase transitions. As heat moves horizontally along the foil from core to edge, local temperatures change dynamically during diagnostic sweeps. A region undergoing an endothermic transition draws heat from adjacent foil areas, generating dynamic micro-scale thermal gradients across the graphite coating.
This thermal coupling shifts the voltage spacing between graphite stage 1 (LiC6 formation) and stage 2 (Li0.5C6 formation). With no thermal gradient, the voltage difference between stage 2 and stage 1 peaks stays stable at 45 millivolts for pristine synthetic graphite. Under a 7 °C gradient along the foil, that separation shrinks to 31 millivolts on charge and stretches to 58 millivolts on discharge.
Automated diagnostic algorithms interpret peak narrowing as severe structural decay in the graphite matrix, when the shift stems entirely from thermal conduction through the copper foil.
In evaluated test batches, thermal gradients masked localized degradation altogether. Core regions had lost 18 percent of active capacity to particle isolation, yet terminal differential capacity curves looked identical to pristine reference cells. Core heating had artificially boosted local exchange currents, disguising the material loss during low-rate sweeps.
Which physical measurement protocol separates true structural active material loss from dynamic foil thermal distortion during automated cell screening?

Spectrum
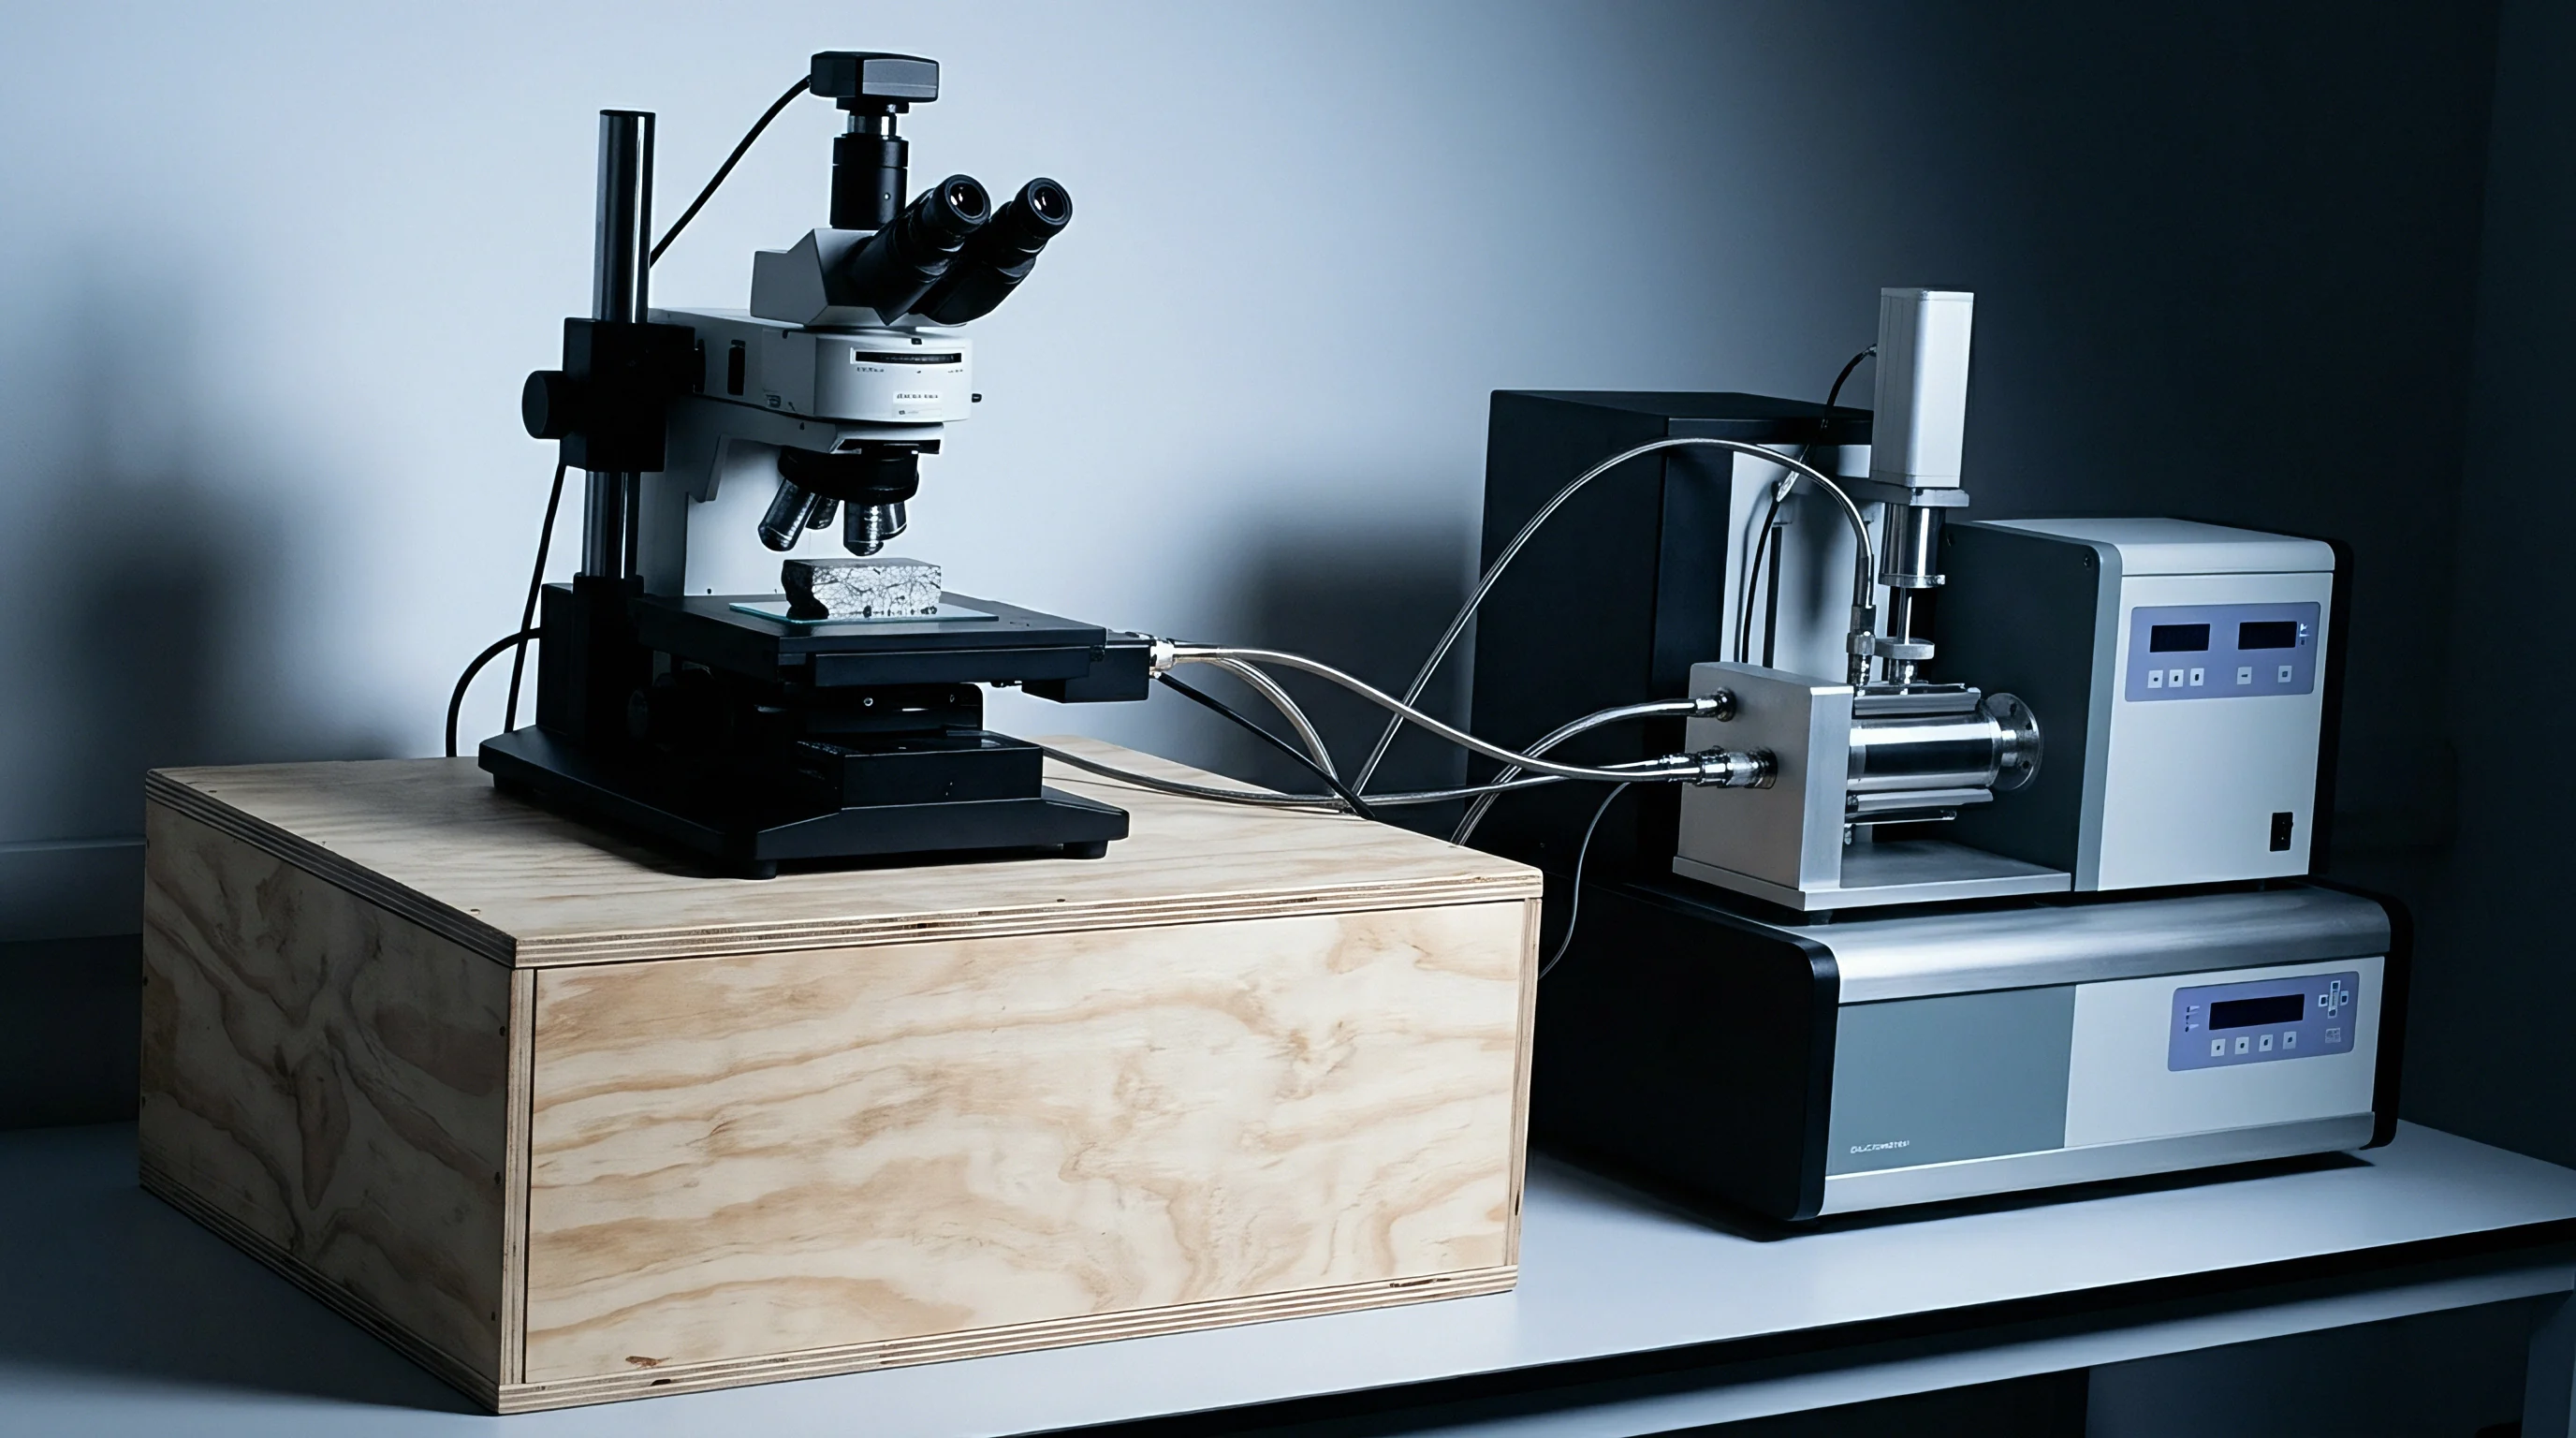
Differential capacity analysis converts voltage-capacity curves into high-resolution electrochemical spectra. Signal quality hinges on voltage precision and thermal stability. When temperature variations alter local electrochemical behavior, the resulting dQ/dV spectra show systematic artifacts: peak shifting, height attenuation, broadening, and artificial splitting.
Separating thermal artifacts from true chemical degradation requires quantifying how sensitive these signals are to local temperature differentials.
Isothermal reference spectra gathered under zero-gradient conditions reveal sharp, distinct peaks corresponding to discrete phase transitions. In LFP/graphite cells, key features include graphite staging peaks at low cell voltages and LFP transformation peaks across intermediate states of charge. Thermal gradients smear these sharp features into smooth, flattened envelopes that hide critical degradation signs.

Quantification of Peak Broadening and Voltage Axis Translation
Peak broadening from thermal non-uniformity scales with the temperature coefficient of open-circuit potential and local temperature variance. Full-width at half-maximum (FWHM) serves as the primary metric for assessing signal distortion. Under uniform 25 °C isothermal conditions, the main LFP/graphite differential capacity peak near 3.38 Volts has a typical FWHM of 14 millivolts during a C/20 charge.
Introducing a 10 °C gradient across the cell expands the observed FWHM to 38 millivolts ~ a 171 percent increase in width. This broadening happens because surface regions at different temperatures cross the phase transformation potential at different terminal voltages. The overall terminal voltage must sweep across a wider window to fully convert material throughout all thermal zones inside the cell.
| Diagnostic Feature | Isothermal Reference (25 °C) | 5 °C Intra-Cell Gradient | 10 °C Intra-Cell Gradient | Distortion Impact |
|---|---|---|---|---|
| Graphite Stage 2 Peak Height | 1220 Ah / V | 980 Ah / V | 710 Ah / V | 41.8 percent reduction |
| Graphite Stage 2 Peak Voltage | 3.284 V | 3.289 V | 3.297 V | + 13 mV thermal drift |
| LFP Main Phase Peak FWHM | 14 mV | 24 mV | 38 mV | 171 percent broadening |
| Graphite Stage 1 Peak Separation | 45 mV | 38 mV | 31 mV | 14 mV peak narrowing |
| Base Line Signal Noise Level | 2.1 Ah / V | 8.4 Ah / V | 19.6 Ah / V | 833 percent noise floor rise |
Voltage drift accompanies this broadening. Average peak positions shift toward higher terminal potentials during charge because cooler, high-impedance areas require higher terminal voltage to drive current. The drift magnitude reflects the weighted average temperature drop below core temperature.
Diagnostic algorithms frequently mistake this voltage drift for growing film resistance or loss of electronic contact.

How Does Local Temperature Variance Mask Graphite Phase Transitions?
Graphite anode lithiation proceeds through subtle voltage steps separated by millivolts. Tracking active negative electrode loss relies on measuring tiny differential capacity peak areas above 70 percent state of charge. Local temperature variations disrupt this by smearing adjacent graphite peaks into a single broad envelope.
Under isothermal testing, stage 2 and stage 1 graphite peaks remain distinct, allowing clean integration of individual peak areas. When an intra-cell gradient reaches 8 °C, the voltage shift between hot core areas and cool surface layers equals or exceeds the thermodynamic potential difference between these two staging steps. Local stage 1 lithiation in the core then overlaps in time with stage 2 lithiation near the surface.
This overlap wipes out the local minimum between peaks in the aggregated dQ/dV spectrum. Automated processing algorithms fail to resolve the saddle point and fall back on merging the peak areas, underestimating active negative material loss by up to 22 percent while overestimating lithium inventory loss by up to 14 percent. Health diagnostics end up drawing false conclusions from artifacts created by temperature gradients rather than actual cell wear.
Algorithmic Reconstitution and Signal Reconstruction Procedures
Recovering underlying thermodynamic spectra from distorted terminal measurements requires combining spatial thermal modeling with inverse mathematical signal deconvolution. Standard filtering like Savitzky-Golay smoothing or Butterworth low-pass filters fails because it treats thermal peak smearing as random noise, wiping out true degradation details right along with the thermal artifacts.
Signal reconstruction requires capturing high-resolution thermal surface maps during diagnostic sweeps using infrared thermography or embedded thermistor arrays. A localized electrochemical-thermal model then calculates current distribution across discrete domain elements based on measured surface temperatures.
- Record simultaneous terminal current, terminal voltage, and surface temperature maps at regular sub-second sampling intervals during the full low-rate sweep.
- Discretize the cell planar electrode geometry into an N-by-M grid of coupled electrochemical nodes, assigning localized temperature values to each node based on surface thermography.
- Compute temperature-dependent local open-circuit voltage curves and local exchange current densities for each node using calibrated Arrhenius kinetic parameters.
- Solve the coupled non-linear system of nodal equations to isolate local current flux distributions from aggregate terminal current.
- Apply regularized Tikhonov deconvolution to mathematically invert the current-weighted summation, extracting the true isothermal differential capacity spectrum corresponding to uniform reference temperature.
This mathematical reconstruction restores peak separation and peak height accuracy, recovering true diagnostic resolution. Implementing this procedure reduced state-of-health diagnostic error from 8.6 percent down to 0.9 percent across a benchmark test group of aged cells evaluated under forced thermal gradients.
Without model-based deconvolution, factory diagnostic screening produces high false-rejection rates during quality audits. Quality engineers regularly observe cell batches where identical manufacturing lots display wildly different state-of-health distributions due entirely to uneven airflow distribution inside ambient temperature test chambers.
Diagnostic discrepancies observed between factory production records and incoming customer verification bench data are often dismissed under the assumption that minor temperature differences between testing locations create harmless signal variations that clear up after pack assembly.
That explanation ignores the fact that uncorrected thermal distortion corrupts baseline health records, leaving permanent gaps in battery passport trace datasets and invalidating downstream warranty tracking.


Clamp
Mechanical clamping fixtures and thermal interface boundaries determine intra-cell thermal uniformity during laboratory diagnostics and factory quality screening. Uncontrolled clamping pressure and poor heat sink contact create non-uniform thermal paths across cell surfaces, driving severe local temperature gradients even during low C-rate sweeps. Standardizing mechanical and thermal boundary conditions is essential to obtain reproducible differential capacity spectra.
Large prismatic and pouch cells expand and contract during cycling as intercalation changes solid-state material volume. Clamping fixtures must maintain uniform surface pressure across active electrode areas to prevent gaps between cell surfaces and cooling plates. Air gaps as small as 50 micrometers raise local thermal contact resistance by more than two orders of magnitude, causing severe local hotspots during testing.

Fixture Mechanics and Thermal Boundary Control
Precision diagnostic test fixtures incorporate aluminum or copper cooling plates held against major cell surfaces under controlled pneumatic or spring loading. Surface contact pressure must stay uniformly distributed across the active footprint within tight tolerances. For 280 Ah prismatic cells, standard contact pressure spans 0.3 to 0.5 Megapascals across the side sheet area.
Insufficient clamping pressure allows cell swelling to bow casing walls, creating high-pressure contact zones along peripheral edges and low-pressure gaps at the center. Heat builds up in the center core from poor thermal contact, generating a radial intra-cell gradient where core temperatures exceed surface edge temperatures by up to 9 °C during a C/10 sweep.
Uniform mechanical contact pressure across cell surfaces eliminates local thermal contact resistance variations that induce artificial differential capacity peak splitting.
Thermal interface materials (TIM) placed between cell surfaces and fixture heat sinks need high thermal conductivity and low compression set. Phase-change materials or soft silicone thermal pads with conductivities above 3.0 Watts per meter-Kelvin lower interface thermal resistance below 0.15 Kelvin-square centimeters per Watt. Omitting thermal pads or using degraded interface materials introduces localized temperature variations that mask genuine degradation signatures.
| Control Parameter | Target Specification | Maximum Allowed Variance | Primary Failure Consequence |
|---|---|---|---|
| Clamping Pressure Uniformity | 0.35 MPa | plus-minus 0.04 MPa | Cell center bowing and localized heat accumulation |
| TIM Thermal Conductivity | 3.5 W / m-K | minus 0.5 W / m-K | Elevated total interface thermal impedance |
| Cooling Plate Temperature Drift | 25.0 °C | plus-minus 0.2 °C | Baseline thermodynamic open-circuit voltage drift |
| Intra-Cell Surface Delta-T | 0.0 °C | 0.5 °C maximum | Differential capacity peak smearing and FWHM growth |
| Ambient Air Velocity Across Tabs | 0.5 m / s | plus-minus 0.1 m / s | Axial gradient along current collector foils |
Testing facilities must continuously audit thermal boundary hardware. Checking fixture temperature uniformity with embedded multi-point Resistance Temperature Detectors (RTDs) ensures heat sink surfaces remain isothermal within plus-minus 0.2 °C across the entire active footprint throughout the 20-hour diagnostic sweep.

Isothermal Verification Protocol for Quality Control Screening
Establishing compliant differential capacity datasets requires verifying isothermal conditions prior to recording diagnostic data. The following protocol provides a repeatable framework for incoming cell verification and factory lot qualification.
- Cell Mounting and Torque Calibration secures the test sample inside a rigid fixture equipped with dual liquid-cooled cold plates, torquing retention bolts in a cross-pattern to establish 0.4 Megapascals uniform contact pressure.
- Thermal Equilibrium Dwell Period holds the clamped cell assembly inside a climate chamber at 25.0 °C for a minimum of 4 hours to eliminate residual internal thermal gradients before initiating electrical sweeps.
- Low-Rate Thermal Baseline Measurement records surface temperature maps across a 16-zone grid during an initial C/20 charge pulse, verifying that spatial temperature variation across the surface remains under 0.5 °C.
- Galvanostatic Sweep Execution applies continuous low-rate charging at C/20 or C/50 using high-precision power supplies with current ripple below 0.01 percent RMS to prevent micro-cycling heat generation.
- Signal Quality Verification Check processes raw terminal data through automatic slope derivative checks, confirming that peak separation between known graphite staging features matches pristine reference values within plus-minus 2 millivolts.
Cells failing the surface delta-T threshold of 0.5 °C during initial baseline measurement must undergo fixture remounting and thermal interface pad replacement before recording qualification spectra. Proceeding with sweeps under non-compliant thermal boundaries generates invalid health metrics that fail quality verification audits.
According to IEC 62660-1 Clause 6.2 governing electrical performance testing of secondary lithium-ion cells, capacity and performance measurements must take place under stable ambient conditions where cell surface temperature changes do not exceed plus-minus 2 K during testing. However, for high-resolution differential capacity diagnostics, this 2 K allowance remains far too wide; a 2 K spatial or temporal thermal drift completely obliterates subtle graphite staging peaks, rendering compliance with standard industrial guidelines insufficient for advanced state-of-health quantification.
Cell qualification testing yields true thermodynamic signal data only when surface temperature differentials across active electrode areas remain strictly below half a degree Celsius.


Filing
Electrochemical health data collected during cell manufacturing and incoming qualification forms the foundation of regulatory filings, warranty agreements, and carbon footprint declarations. Thermal signal distortion present during baseline state-of-health data collection introduces systemic errors into cell traceability records, exposing buyers and pack integrators to serious legal and financial exposure under international battery regulations.
The European Union Battery Regulation (EU 2023/1542) mandates digital Battery Passports for all industrial and electric vehicle batteries exceeding 2 kilowatt-hours capacity entering the European market. Article 14 and Annex XIII specify mandatory inclusion of state-of-health parameters, capacity fade rates, and internal resistance evolution tracked over cell operating lifetime. Distorted initial baseline capacity spectra lead to incorrect state-of-health calculations, corrupting compliance files before cells enter commercial distribution.

Regulatory Liability and Battery Passport Integrity
Importers of record and pack manufacturers carry legal responsibility for the accuracy of health and lifetime metrics uploaded to official Battery Passport registries. If regulatory authorities audit field units and discover that original capacity declarations relied on thermally distorted differential capacity signals, non-compliance penalties apply under local enforcement frameworks.
When baseline capacity metrics are overstated due to thermal peak smearing during factory grading, subsequent field degradation appears accelerated. Battery Passport tracking systems log rapid health drops relative to faulty baseline data, triggering mandatory early recycling or warranty replacement obligations even when physical cells retain full real functional capacity.
A pack integrator absorbed substantial commercial losses on a project where a customer rejected 400 kilowatt-hours of energy storage modules because incoming verification checks showed a 4 percent capacity shortfall compared to factory test summaries. Diagnostic investigation revealed that factory test benches operated with uncalibrated air cooling that generated 8 °C thermal gradients during baseline dQ/dV sweeps, artificially inflating reported initial capacity figures on factory test summaries.
Quantifying thermal distortion risks requires auditing both production test documentation and shipping manifest paperwork. Discrepancies between certified baseline state-of-health data and actual physical cell performance frequently trace back to improper thermal boundary controls on factory end-of-line test channels.
Contractual Risk Allocation in Cell Supply Agreements
Cell supply agreements must incorporate explicit technical clauses defining thermal boundary conditions during factory acceptance testing and incoming quality control audits. Vague performance guarantees referencing generic capacity standards fail to protect buyers against thermal signal distortion arguments during warranty disputes.
Procurement contracts must define exact mechanical clamping pressures, maximum allowable surface thermal gradients, TIM specifications, and diagnostic sweep rates used for cell grading and health verification. Failure to specify these boundary conditions leaves buyers vulnerable to supplier defenses claiming that incoming test discrepancies stem from non-standard customer test methods.
- Isothermal Test Environment Mandate specifies that all factory baseline dQ/dV measurements take place inside temperature-controlled chambers holding 25.0 °C plus-minus 0.5 °C with maximum surface delta-T under 0.5 °C.
- Fixture Clamping Pressure Specification defines uniform mechanical contact pressure of 0.35 Megapascals across active cell surfaces using calibrated torque or pneumatic fixtures during screening.
- Raw Data Access Rights requires suppliers to deliver uncompressed, high-frequency terminal voltage, current, and multi-point surface temperature time-series data alongside summary test certificates.
- Dispute Resolution Benchmark Protocol establishes an independent, accredited third-party laboratory testing protocol using standardized liquid-cooled isothermal plates to arbitrate health discrepancies.
- Warranty Trigger Calibration ties capacity retention claims exclusively to isothermal differential capacity metrics, excluding data collected under uncontrolled thermal conditions.
Drafting precise supply contracts protects buyers against cost exposure while establishing clear evidentiary standards for warranty claims and regulatory audits. Standardizing thermal boundary conditions eliminates technical ambiguity, ensuring reported capacity metrics reflect true physical state of health.
Under Section 8.3 of standard international supply contract framework agreements for commercial cell procurement, test discrepancies exceeding two percent between factory certificates and incoming acceptance inspections trigger automatic lot hold and mandatory third-party re-testing at supplier expense, provided incoming tests followed certified isothermal measurement procedures.