Predictive Degradation Modeling of Core-to-Surface Thermal Gradients in High Energy Density Prismatic Formats
Core-to-surface thermal gradients in prismatic cells drive localized plating and SEI growth, requiring 3D electro-thermal models to prevent early fade.

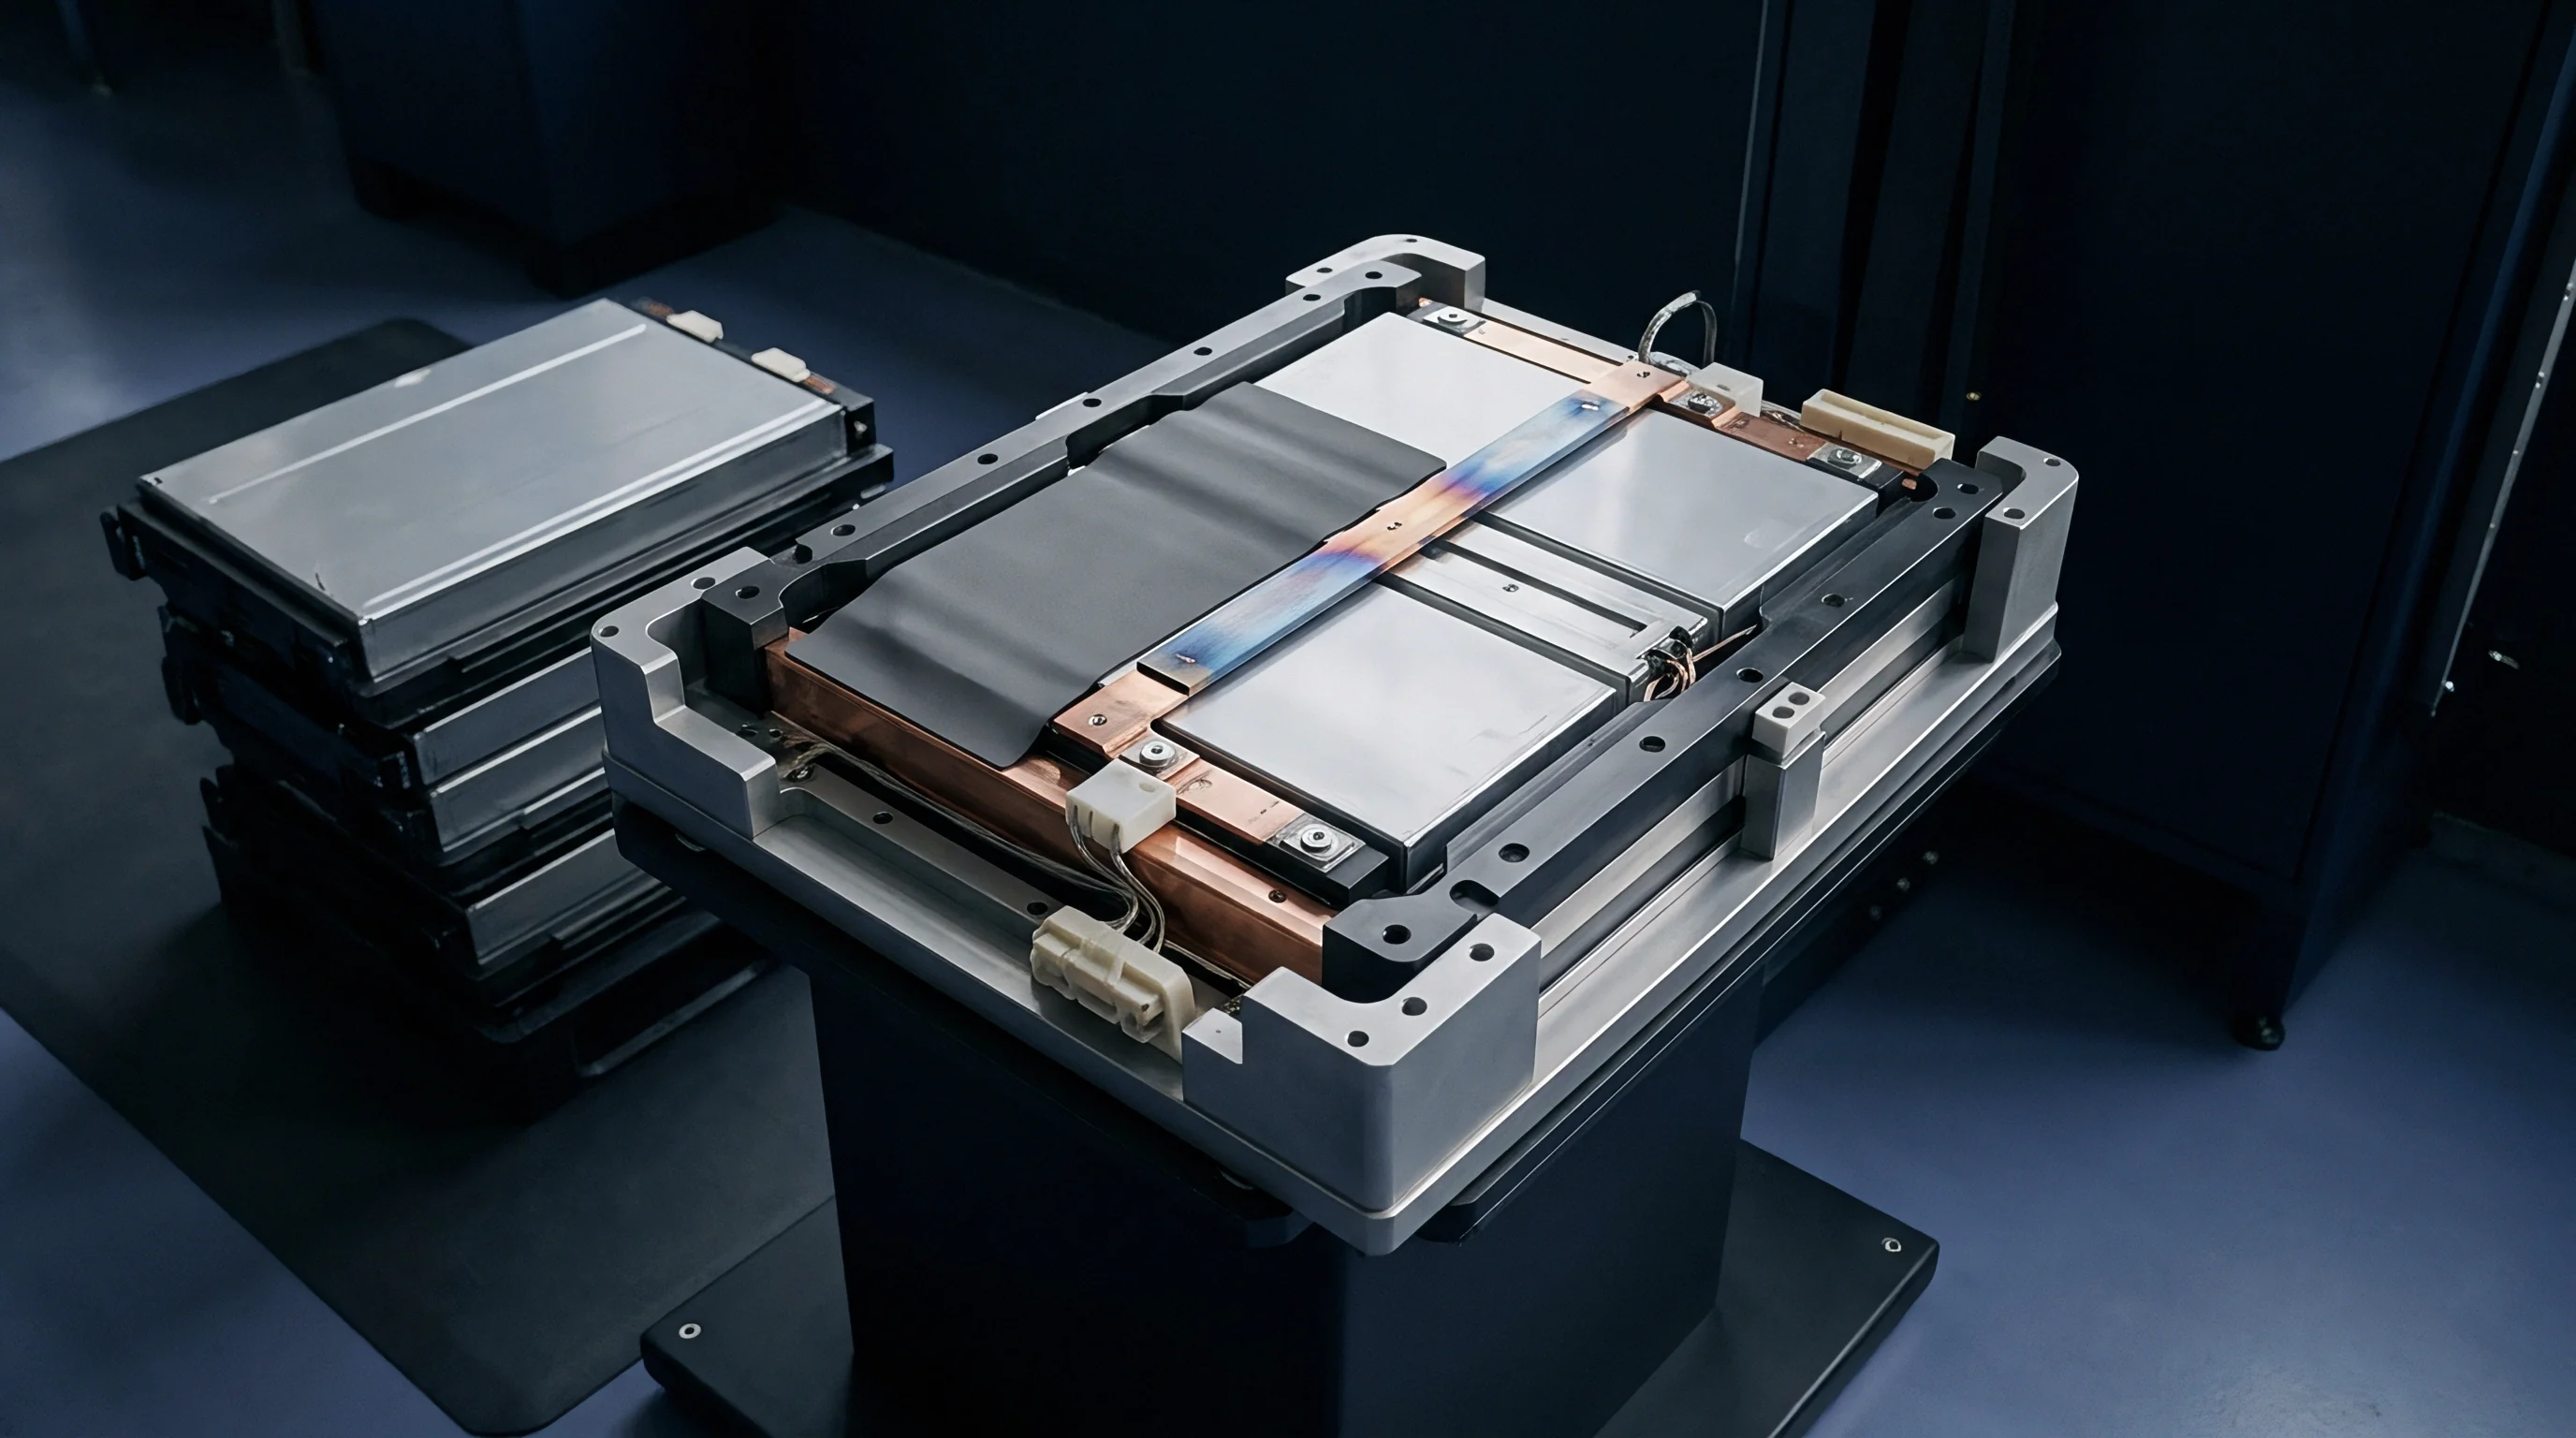
Geometry
Structural anisotropy severely complicates heat removal in high energy density prismatic cells. For large-format variants (100 Ah to 300 Ah) built with nickel-rich cathodes and silicon-graphite anodes, internal thermal resistance is substantial. Heat generated in the central jellyroll or electrode stack must traverse hundreds of alternating material layers ~ current collectors, coatings, and polymer separators ~ before reaching the aluminum case.
Along the collector foils, in-plane thermal conductivity ranges from 20 W/m K to 30 W/m K. Across the stack, however, cross-plane transport drops to between 0.5 W/m K and 1.5 W/m K, dictated largely by state of charge and electrolyte wetting.
Under fast charging or heavy discharge, this directional disparity sets up steep temperature differentials between the core and the casing. In a 280 Ah prismatic cell undergoing continuous 2C fast charging, Joule heating combined with entropic heat generation yields volumetric heat rates above 80 kW/m³. External cooling hardware ~ whether bottom cold plates or dual-side jackets ~ can pull heat only from exterior surfaces.
Consequently, the cross-plane Biot number routinely exceeds 0.5, rendering lumped-capacitance assumptions invalid and necessitating multi-dimensional thermal modeling.
| Layer Component | Material Composition | In-Plane Conductivity (W/m K) | Cross-Plane Conductivity (W/m K) | Volumetric Heat Capacity (kJ/m³ K) |
|---|---|---|---|---|
| Positive Electrode | NMC811 on Aluminum Foil (15 µm) | 28.4 | 1.12 | 2450 |
| Negative Electrode | Si-C Composite on Copper Foil (8 µm) | 315.0 | 0.85 | 2100 |
| Separator | Ceramic-Coated PE/PP (12 µm) | 0.45 | 0.32 | 1200 |
| Liquid Electrolyte | 1.0M LiPF6 in EC/EMC (3:7 vol) | 0.17 | 0.17 | 1950 |
| Composite Stack | Wound Jellyroll / Z-Fold Stack | 24.8 | 0.88 | 2080 |
During sustained 2C discharge, core-to-surface gradients in 79 mm thick cells reach 12 K to 18 K. Infrared imaging of the case reveals nothing about interior temperatures, creating a blind spot for battery management systems. When BMS algorithms track only surface thermistors, they systematically miss core peaks, obscuring localized thermal stress and accelerated degradation deep in the stack.
Core-to-surface thermal gradients exceeding 15 K during continuous 2C discharge shift local current density distributions by up to 35 percent across high energy density prismatic jellyrolls.
During aggressive cycling, the core consistently runs hotter than surrounding layers. That elevated temperature drops local charge-transfer resistance and accelerates SEI formation, while cooler outer zones encounter higher ionic transport resistance through the electrolyte. As a result, current shunts disproportionately into the hotter center during the initial stages of high-rate charging.

What Drives Cross-Plane Thermal Resistance inside Jellyroll Stacks?
Interfacial contact resistance between active material coatings and collector foils accounts for more than 40 percent of total cross-plane thermal impedance in compressed stacks. Microscopic surface roughness leaves voids occupied by liquid electrolyte, whose low conductivity (around 0.17 W/m K) turns these liquid pockets into effective insulating barriers. External pack compression alters these gap dimensions over time, directly shifting cross-plane conductivity as the cell ages.
Gas generation from ongoing SEI growth and parasitic side reactions introduces additional transport barriers. Micro-bubbles from ethylene carbonate breakdown displace liquid electrolyte between layers, cutting local cross-plane conductivity by up to 25 percent. When these pockets accumulate in central electrode layers, heat retention compounds and widens the gap between core and surface temperatures.
Predicting transient core temperatures requires solving the non-isothermal heat equation with spatial source terms:
ρ C_p (∂T / ∂t) = ∇ · (k ∇T) + q_gen
Where ρ is density, C_p is specific heat capacity, k is the anisotropic thermal conductivity tensor, and q_gen is the volumetric heat generation rate from ohmic resistance, charge-transfer overpotentials, and reversible entropic heat. As the core heats, local electrolyte conductivity climbs, redirecting current density and establishing a coupled electro-thermal feedback loop.
Manufacturing specifications typically cap core-to-surface thermal deltas at 5 K during normal cycling to limit localized aging. In practice, baseline tolerances in coating thickness and separator porosity expand this spread, driving thermal divergence between individual cells within high-voltage modules.

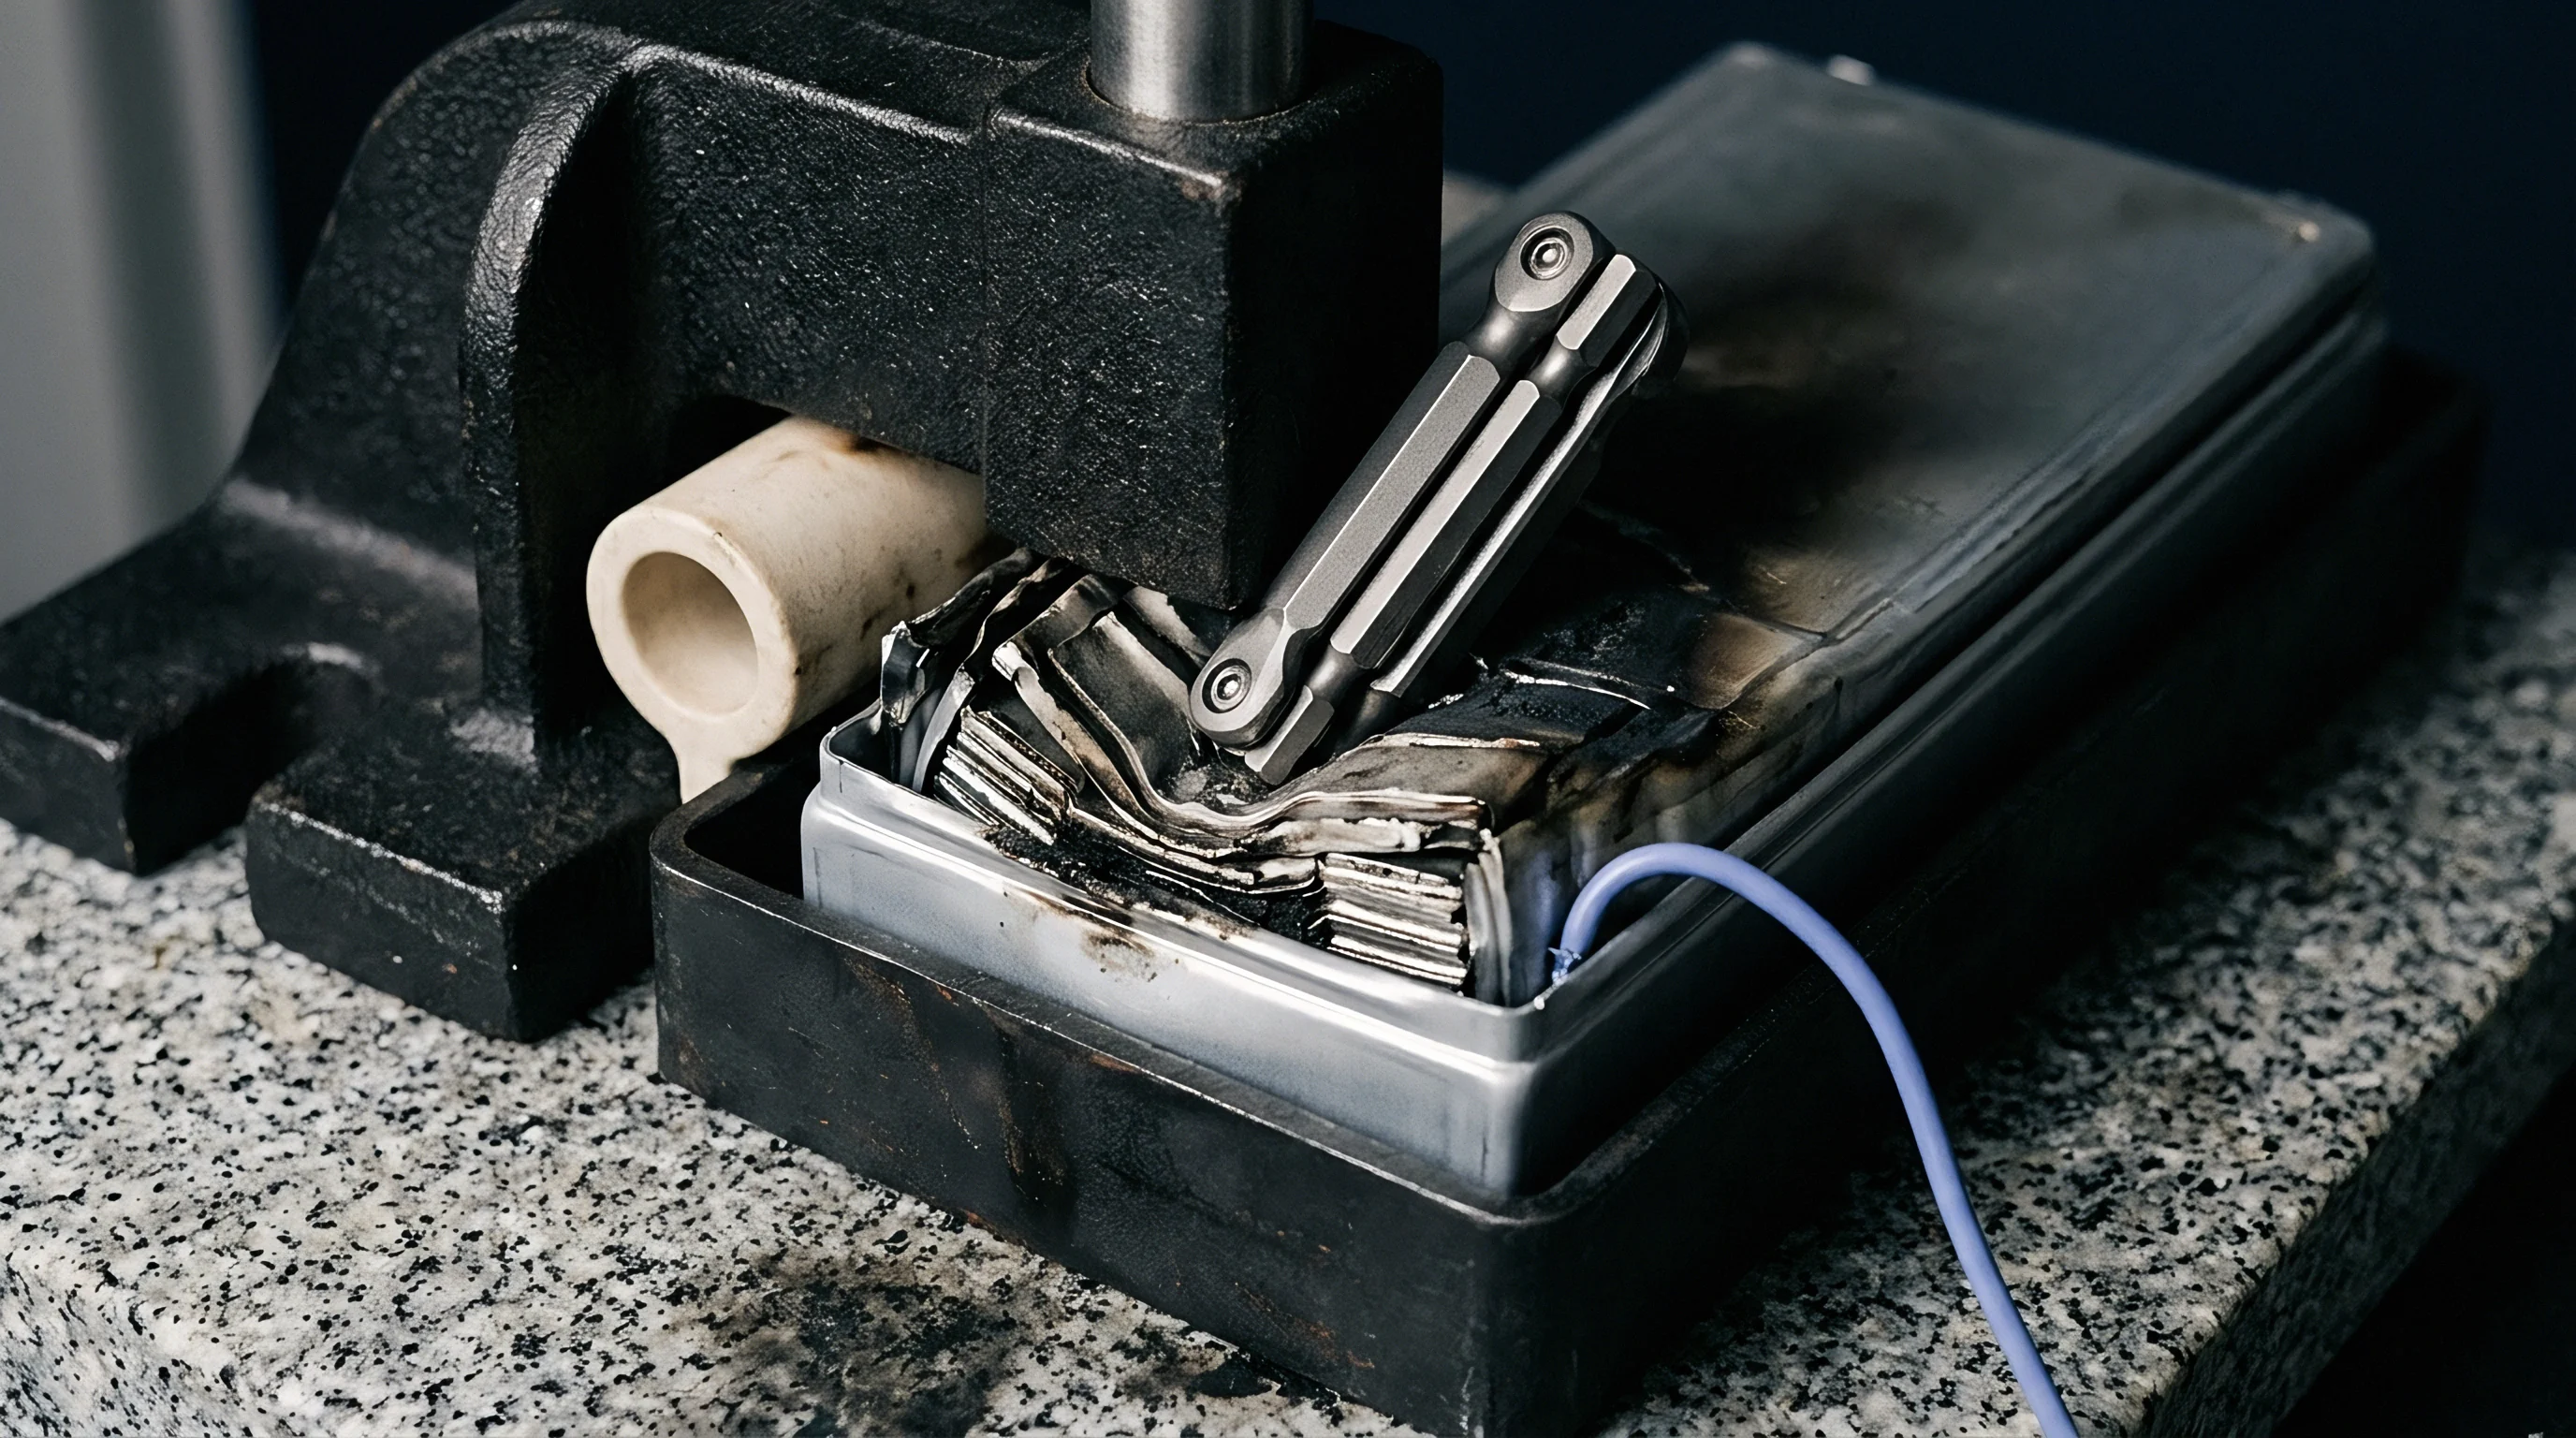
Kinetics
Thermal gradients warp electrochemical kinetics throughout the cell volume. Reaction rate constants for both lithium intercalation and side reactions follow Arrhenius temperature dependence:
k_rxn = A exp(-E_a / (R T))
Where A is the pre-exponential factor, E_a is activation energy, R is the universal gas constant, and T is local absolute temperature. Because the core operates several degrees above the perimeter, side reactions governing SEI growth proceed much faster in central layers.
Continuous SEI growth consumes cyclable lithium while driving up internal cell impedance. In the hot core, accelerated solvent reduction on the anode builds a thicker passivation layer. When core temperatures exceed 45 degrees Celsius, transition metal dissolution from the cathode also accelerates; dissolved manganese, cobalt, or nickel ions migrate across the separator and deposit directly into the anode SEI, destabilizing it.
| Reaction Process | Dominant Kinetic Regime | Activation Energy E_a (kJ/mol) | Primary Degradation Manifestation |
|---|---|---|---|
| SEI Layer Growth | Thermally Driven Solvation Reduction | 48.5 | Capacity Fade via Lithium Inventory Loss |
| Lithium Plating | Overpotential Driven Mass Transfer | 12.3 | Sudden Death Shorting & Active Li Loss |
| Transition Metal Dissolution | Thermal Acid Attack on Cathode | 67.2 | Structure Degradation & SEI Breakdown |
| Electrolyte Decomposition | High Voltage Thermal Oxidation | 74.0 | Impedance Rise & Gas Generation |
| Graphite Exfoliation | Mechanical-Solvation Co-Intercalation | 35.1 | Active Material Isolation |
Near the cooled surfaces, an entirely different degradation mechanism takes over during fast charging. Lower temperatures elevate charge-transfer resistance and suppress solid-state lithium diffusion within graphite particles. If local anode potential drops below 0 V versus Li/Li+, metallic lithium deposits directly onto the graphite surface instead of intercalating.
Plating strips active lithium from the inventory and generates dendrites capable of piercing the separator.
This splits the degradation profile across a single cell: the hot core endures rapid SEI growth and cathode metal dissolution, while the chilled outer layers experience lithium plating during the exact same charge window. Over thousands of cycles, these opposing paths establish deep non-uniformities in local state of charge and active capacity.
Standard UN 38.3 transport certification tests confirm safety under external mechanical and thermal stress but fail to reflect localized core degradation caused by internal operational thermal gradients.
Capturing this spatial aging requires discretizing the cell into thermal zones coupled by equivalent electrical circuits. Current density redistributes as local impedances evolve: early SEI accumulation in the core raises central impedance, eventually shunting current outward toward cooler, less resistive surface layers during lower-rate discharge.
This redistribution induces cyclical mechanical stress across the stack. Differential thermal expansion between the core and exterior produces shear stresses at the electrode-separator interface. Over sustained cycling, these interfacial stresses cause micro-cracking within cathode particles and induce coating delamination from current collectors.

How Does Local Overpotential Shift under Thermal Gradients?
Local overpotential governs the partition between intercalation and parasitic reactions. At the surface of a base-cooled cell, lower local temperatures increase charge-transfer overpotential η_ct according to Butler-Volmer kinetics:
j = j_0 { exp – exp }
Suppressed exchange current density j_0 requires a larger overpotential η_ct to sustain a given current throughput. That elevated overpotential can easily pull the anode potential below 0 V, inducing lithium plating during charging at rates as low as 1.5C whenever surface temperatures drop below 15 degrees Celsius.
Conversely, the warmer core maintains high exchange current density and depressed charge-transfer overpotentials, but higher absolute temperature accelerates side reactions with steep activation energies, particularly solvent reduction. Because overpotential profiles evolve dynamically across the stack during every cycle, the dominant degradation mechanisms shift locations over the life of the pack.
Supplier warranty terms frequently restrict fast charging when surface thermistors fall below defined thresholds. While that protects outer layers from plating, it leaves the hotter core vulnerable to accelerated degradation during high-rate discharge pulses.
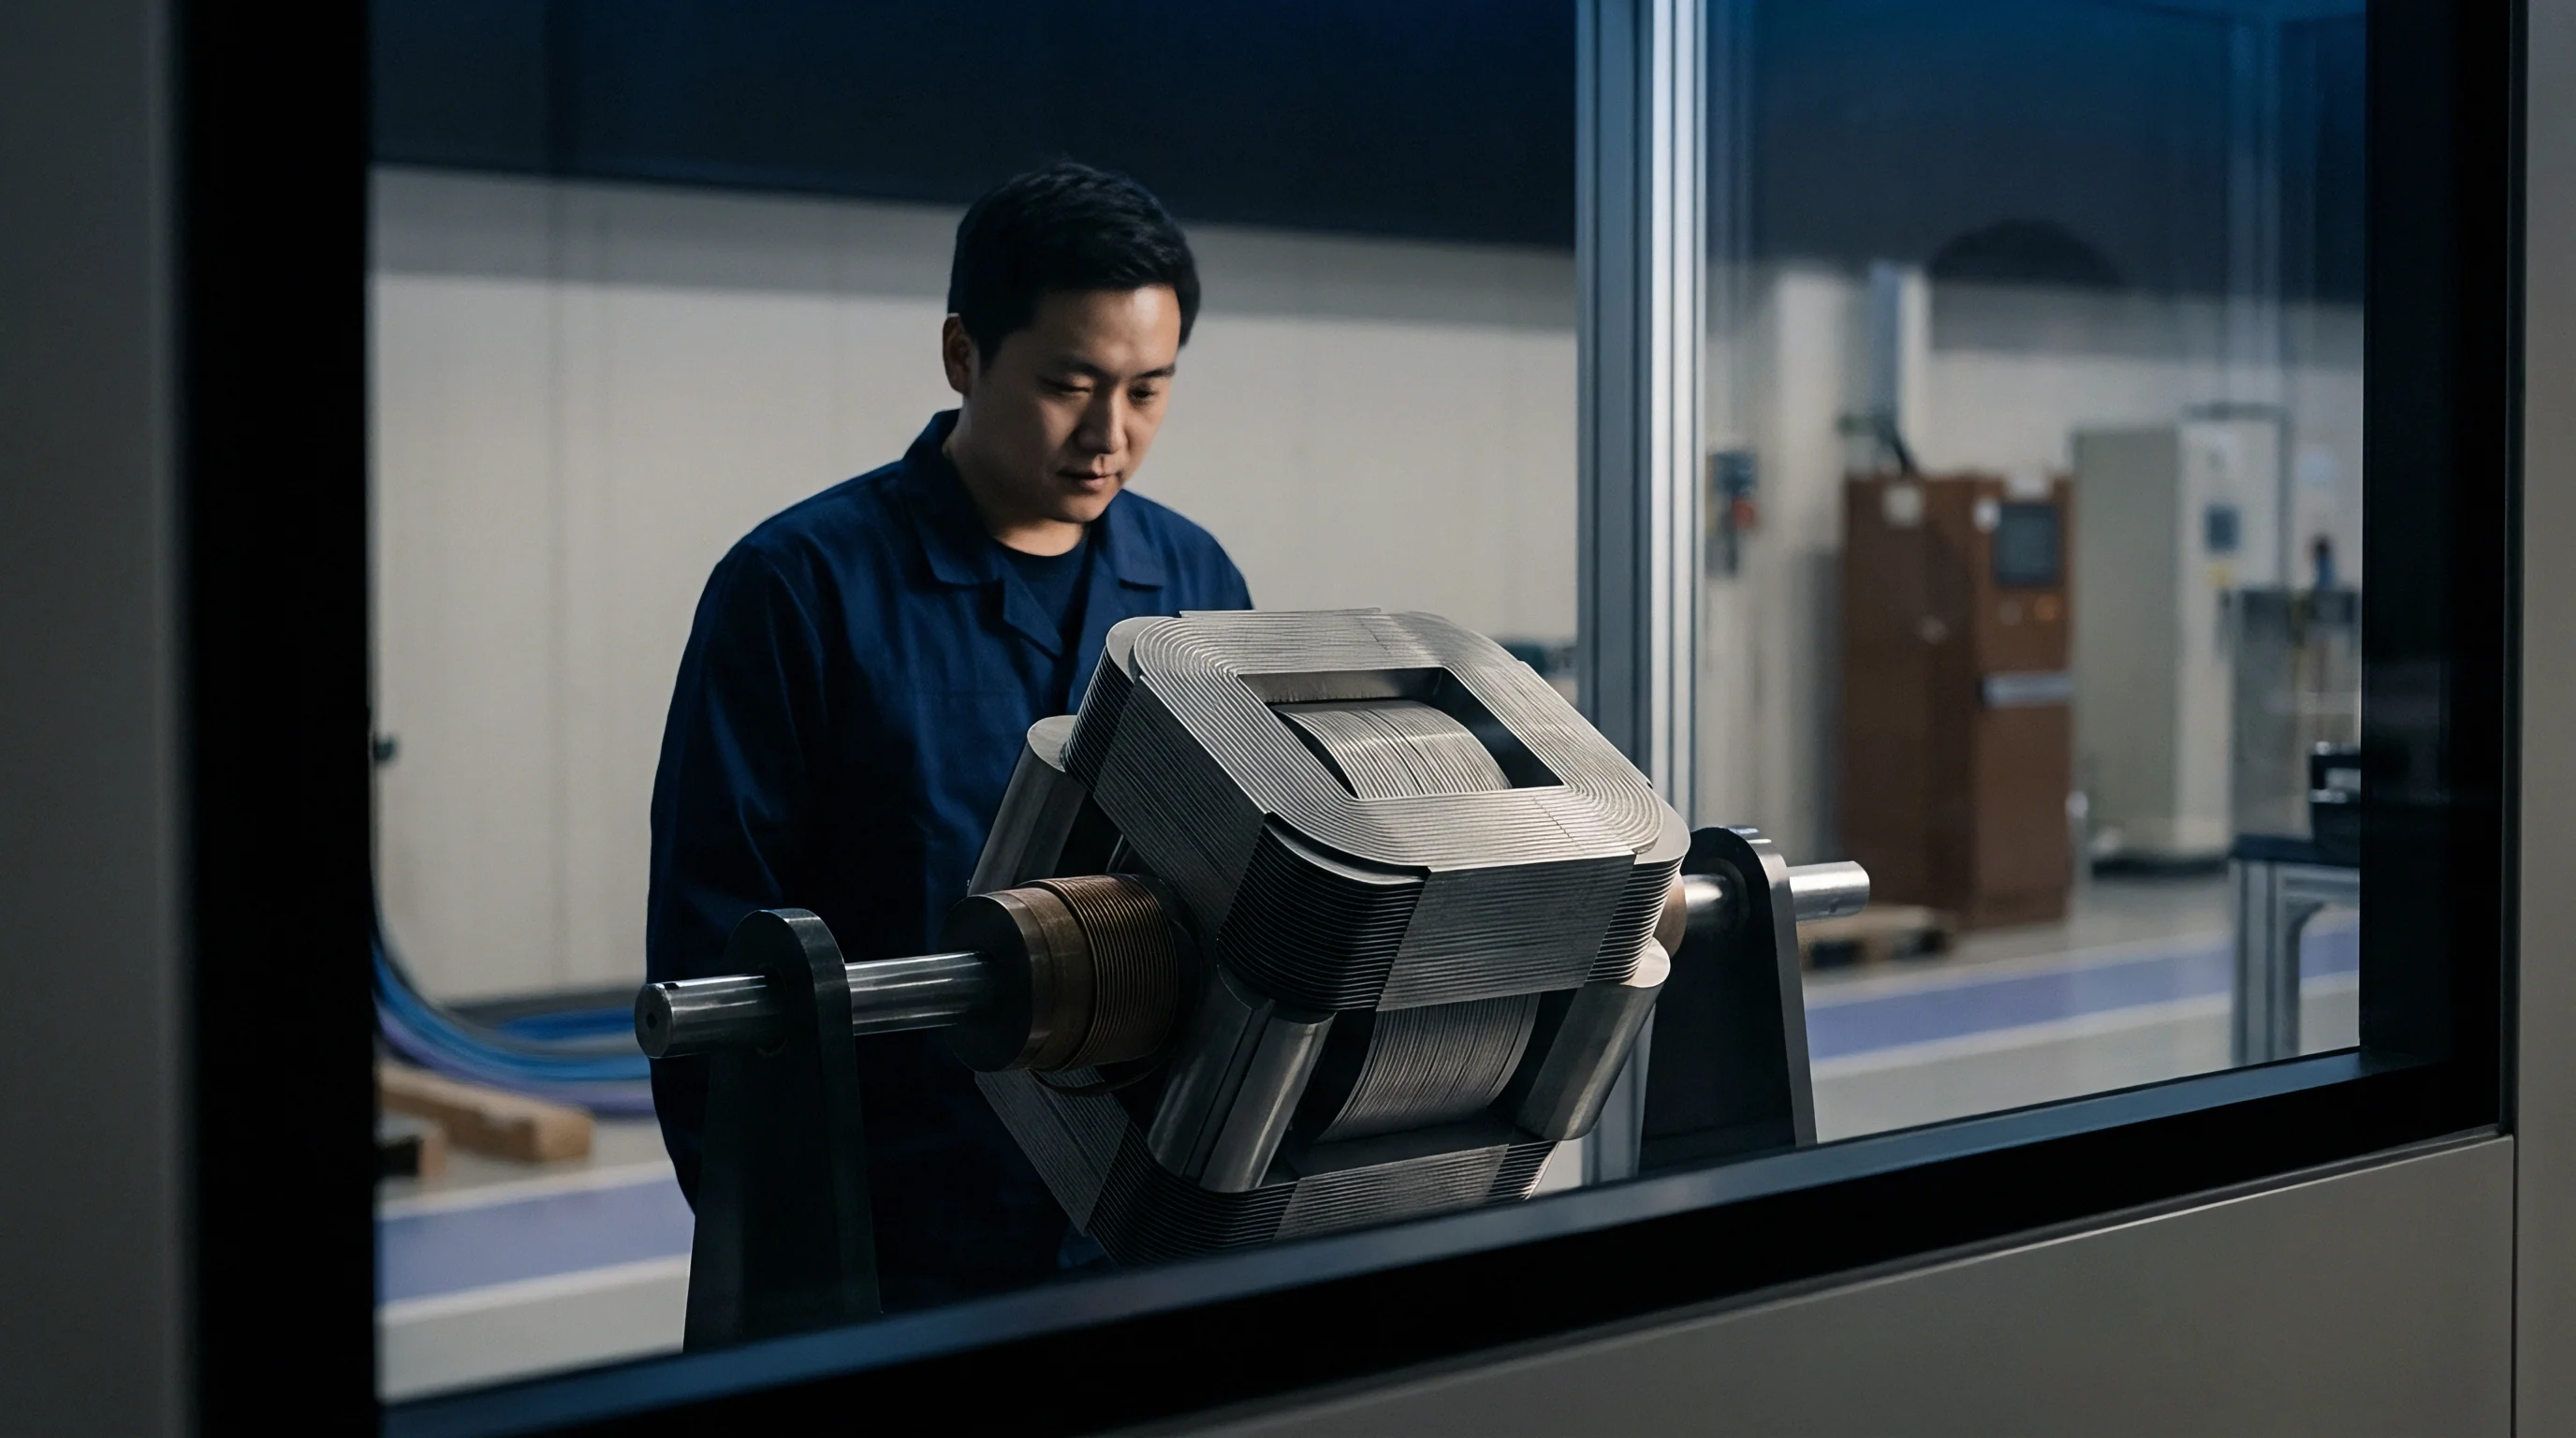
Stress
Thermal gradients induce substantial internal stress within rigid prismatic enclosures. High-energy cells rely on aluminum alloy casings to contain stack breathing, but when the core runs more than 10 K above the surface, mismatched thermal expansion creates heavy internal loads. Volume changes during regular lithiation compound this mechanical strain.
Graphite anodes swell by roughly 10 percent when fully lithiated, whereas silicon-doped blends can expand beyond 300 percent depending on silicon fraction. When lithiation swelling coincides with steep core-to-surface gradients, central compressive stress often exceeds 5 MPa while outer layers enter tension, distorting the stack geometry.
When compressive stress in the center surpasses the buckling threshold of current collectors and separators, the stack deforms. Wrinkled copper foils alter inter-electrode gaps, disrupting electrolyte distribution and concentrating local current. Severe local shear can also rupture ceramic-coated separators, initiating internal micro-shorts.
Coupled thermal and mechanical stresses hasten cathode particle fracture. Polycrystalline nickel-rich active materials display anisotropic lattice expansion along the c-axis at high states of charge. Thermal gradients exacerbate intergranular cracking, exposing unpassivated particle surfaces to the electrolyte.
These fresh facets consume solvent via oxidation, generating resistive rock-salt phases and releasing oxygen into the cell void.
Mechanical strain across cell sections can be monitored using strain gauge fixtures during qualification testing. Sidewall compressive stress increases non-linearly with both state of charge and core temperature.
The accumulation of mechanical damage and its impact on capacity fade follows an empirical damage accumulation function:
D_mech = ∑ (Δσ_i / σ_fatigue)^m
Where Δσ_i represents cyclic stress amplitude induced by thermo-mechanical gradients, σ_fatigue is the interface fatigue limit, and m is the Miner’s rule exponent. Once cumulative damage D_mech reaches unity, local active material delaminates from the foil, triggering abrupt steps in available capacity.
Pack structural design must absorb these internal expansion forces. Applying a baseline mechanical preload of 0.3 MPa to 0.5 MPa across cell faces maintains stack cohesion while accommodating operational swelling; excessive preload combined with thermal expansion can crush internal core structures.
Progressive electrolyte consumption shifts internal stress distributions further over time. High core temperatures accelerate electrolyte consumption, drying out central separator pores. Starved pores increase interfacial friction between moving layers, accelerating abrasive wear across thin polyolefin separators.
Supply agreements routinely cap permissible cell swelling between 8 percent and 10 percent of starting thickness. Unchecked core-to-surface gradients accelerate physical expansion, pushing cells past their mechanical envelopes long before they reach the 80 percent capacity retirement threshold.

Simulation
Predicting cell degradation accurately requires coupled 3D electro-thermo-chemical simulation. Standard lumped single-particle models omit the spatio-temporal dynamics that drive non-uniform aging. Reliable frameworks couple a 3D thermal transport solver with distributed pseudo-two-dimensional (P2D) electrochemical equations across a discretized domain.
Mesh design governs predictive accuracy. High cross-plane thermal resistance across thin separators demands sub-micron resolution through the thickness, whereas in-plane dimensions permit coarser meshing. Reduced-order techniques ~ such as proper orthogonal decomposition ~ bring computational overhead down enough for deployment in hardware-in-the-loop environments.
| Model Complexity Class | Spatial Resolution | Thermal Coupling Mode | Degradation Phenomena Captured | Relative Compute Time |
|---|---|---|---|---|
| Lumped Equivalent Circuit | 0D Single Point | Empirical Heat Transfer | Global SEI Growth Only | 1x |
| Single Particle Model (SPM) | 1D Radial Particle | Isothermal / Uniform | Average Lithium Loss | 5x |
| Multi-Node Electro-Thermal | 2D Cross-Sectional | Anisotropic 2D Heat Conduct | Macro Core-Surface Gradient | 120x |
| Distributed P2D Network | 3D Full Discretized Mesh | Fully Coupled 3D Anisotropic | SEI, Plating, Delamination, Gas | 4500x |
Key model inputs include state-of-charge-dependent anisotropic thermal conductivities, temperature-dependent diffusion coefficients, reaction activation energies, and interfacial resistances. Parameterization demands multi-temperature matrix testing spanning -20 degrees Celsius to 60 degrees Celsius.
Validation relies on accelerated life testing correlated with physical teardowns. Spatial degradation profiles from post-test autopsies confirm that local SEI thickness patterns closely follow simulated core-to-surface thermal profiles.
The necessity of thermal gradient modeling is evident in life projections for a 200 Ah NMC811/graphite cell. Under an assumed uniform temperature of 25 degrees Celsius, standard models predict 2,400 cycles to 80 percent capacity at 1.5C charge and discharge. Factoring in fully coupled 3D thermal gradients reveals core temperatures reaching 44.2 degrees Celsius while surface cooling holds the exterior at 26.5 degrees Celsius.
That elevated core temperature accelerates central SEI growth, while the cooler surface incurs lithium plating during fast charging. The coupled 3D model shows the cell reaching 80 percent capacity after 1,420 cycles. Omitting internal gradients overstates operational life by nearly 70 percent.
Sensitivity analyses confirm that cross-plane thermal conductivity dominates pack lifetime forecasts. Raising cross-plane conductivity from 0.8 W/m K to 1.4 W/m K reduces peak core temperature by 6.8 K under continuous 2C discharge, curbing central SEI accumulation and adding 380 equivalent cycles to the projected lifespan.
Simulations must also handle transient drive profiles. High-power acceleration bursts generate thermal spikes in the core long before surface sensors register a change. Advanced models calculate instantaneous stress and degradation under dynamic loading, giving energy management systems the lead time to throttle power before core temperatures cause damage.
Warranty arbitrations often hinge on assumed boundary conditions. Disparities between nominal coolant flow rates and real-world chiller performance invalidate baseline life models, leaving pack integrators liable for unbudgeted field replacements.
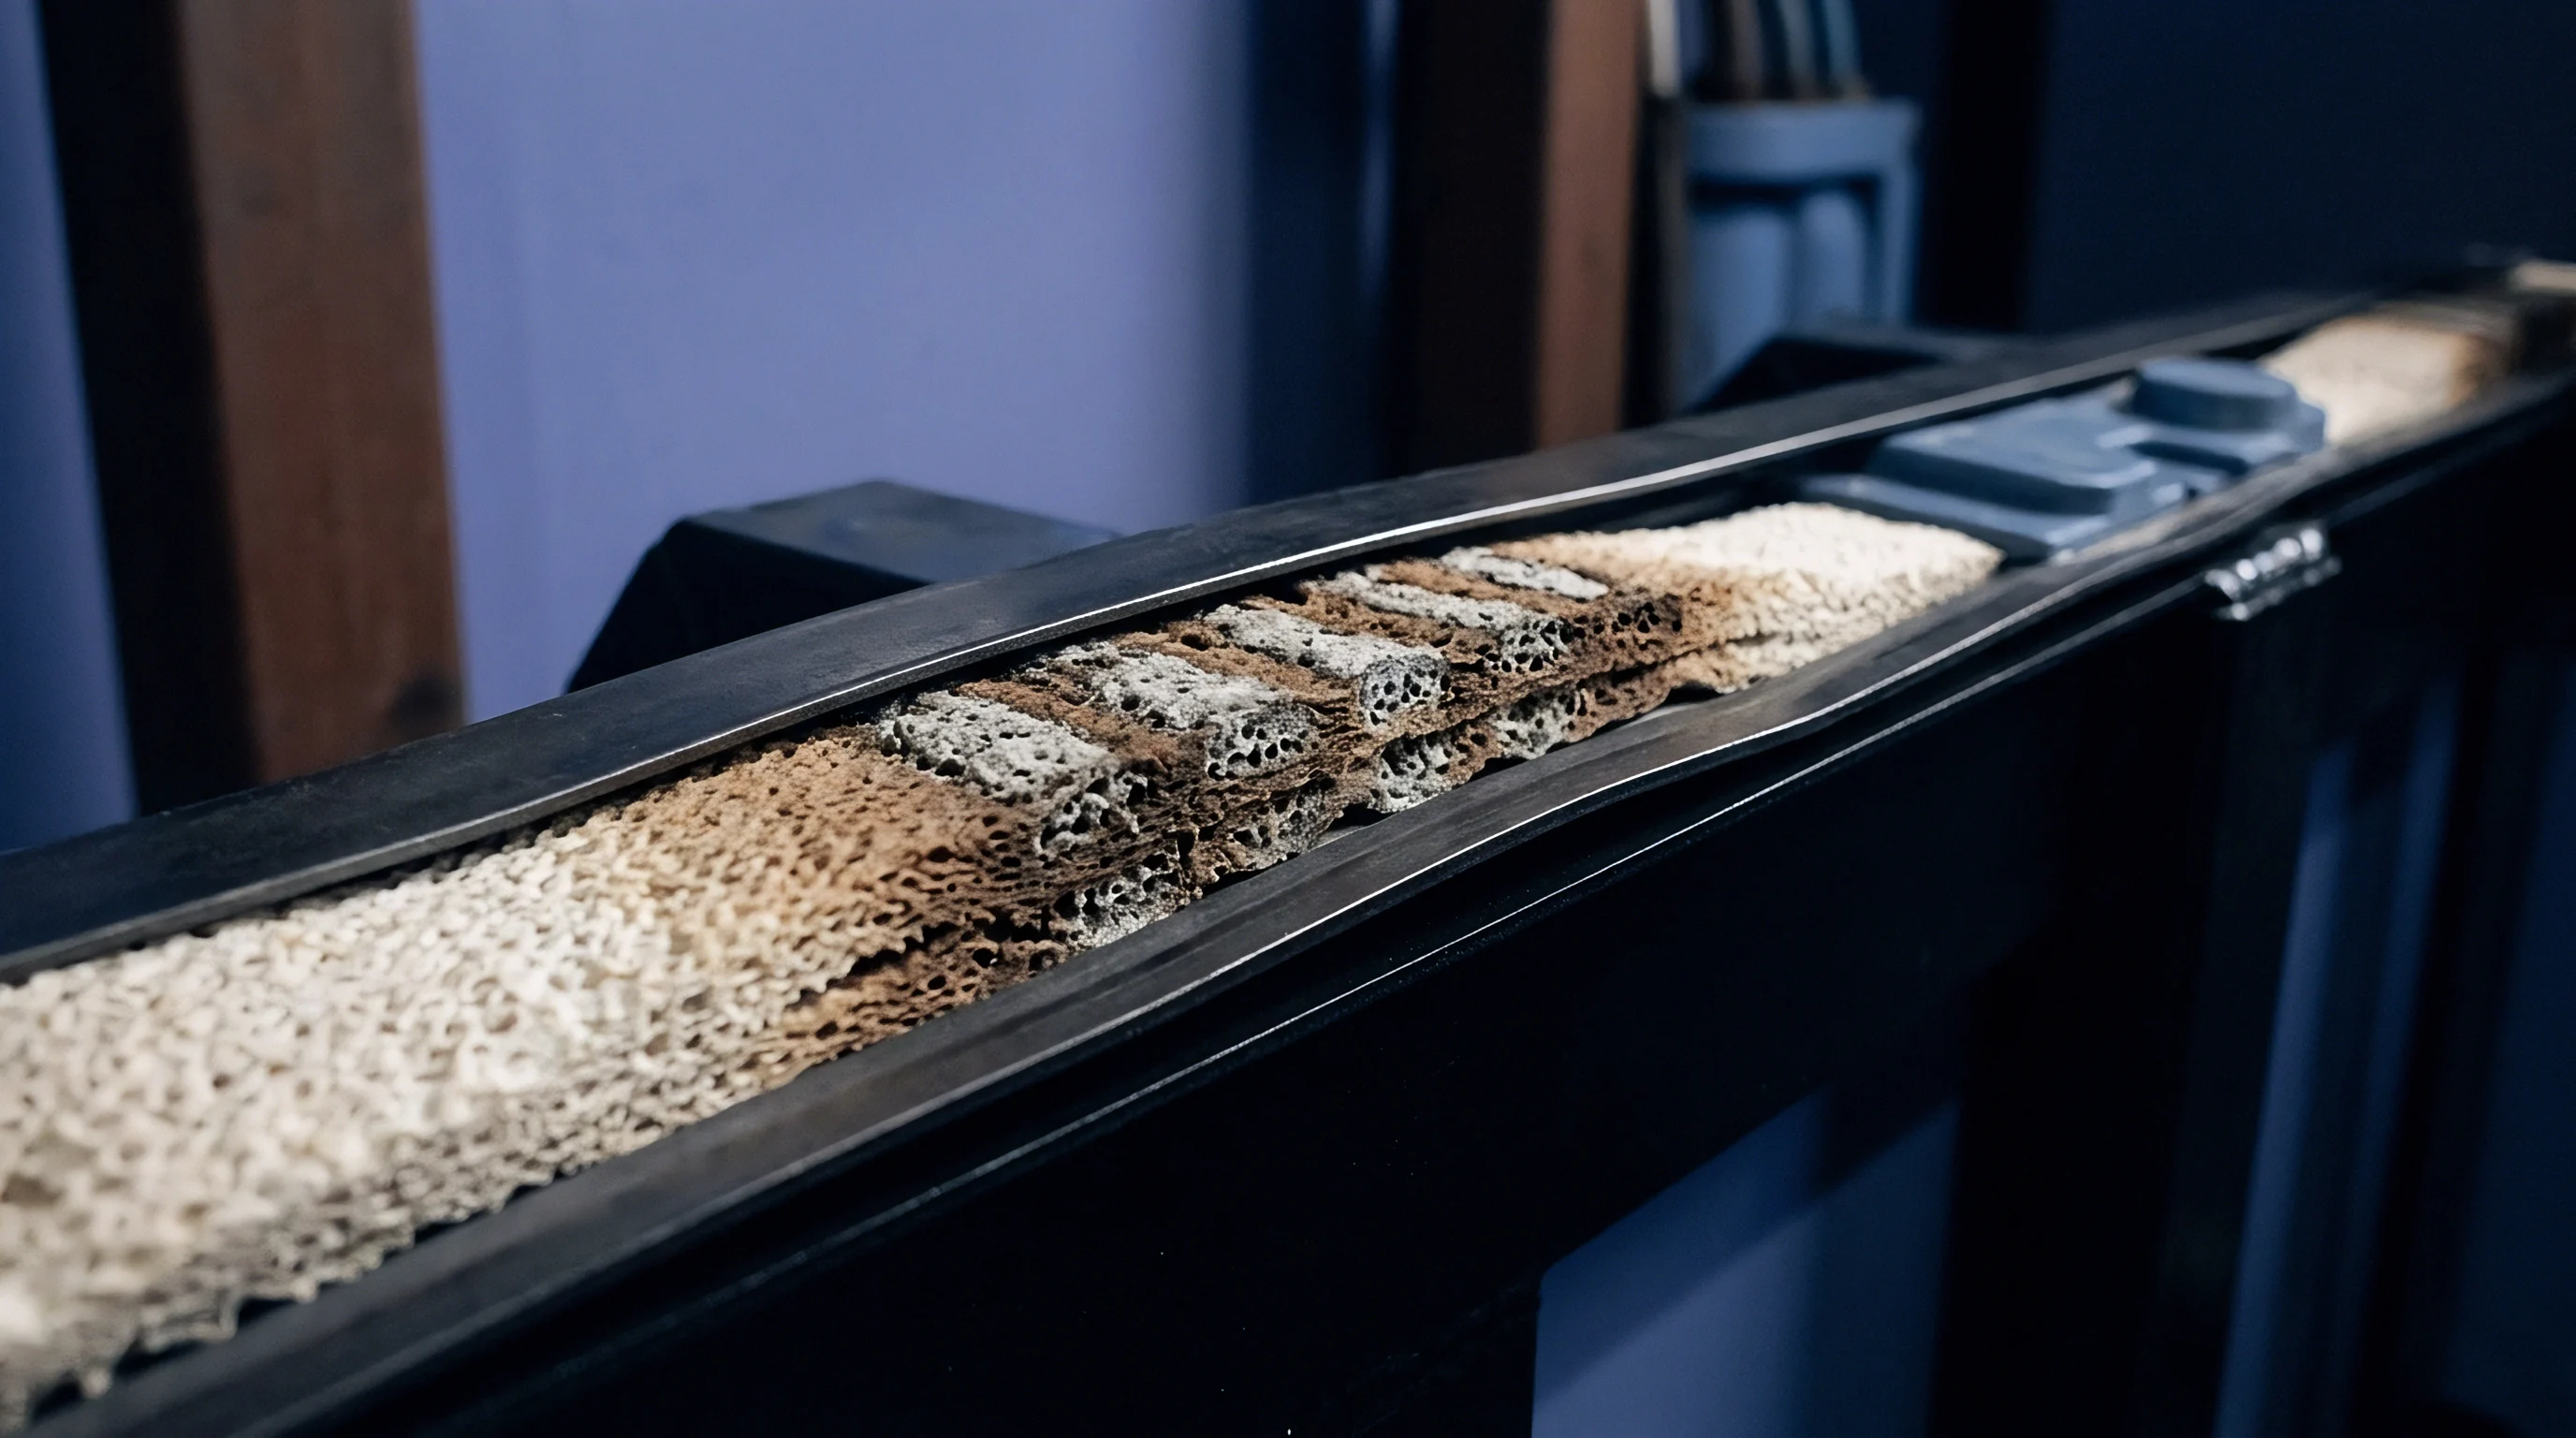
Mitigation
Reducing internal thermal gradients requires structural intervention at both module and cell levels. Bottom cold plates remove heat only across the narrow base of prismatic cells, forcing thermal energy to travel the entire height of the electrode sheets. Side-wall liquid cooling jackets reduce that path length substantially.
Combining dual-side cooling with tab cooling provides an effective route for flattening internal gradients. Because current collector foils exhibit high in-plane thermal conductivity, heat channels naturally toward the terminal tabs. Chilling positive and negative tabs directly draws heat from the core via the foils, circumventing cross-plane transport resistance.
- Tab Cooling Integration ~ Connect micro-channel cold plates directly to copper and aluminum terminal tabs to extract heat along in-plane foils, reducing core temperatures by up to 9 K during fast charging.
- Inter-Cell Phase Change Materials ~ Place phase-change composite sheets between cell side-walls to absorb heat spikes during high-rate pulses, dampening surface-to-core thermal divergence.
- Optimized Mechanical Preload ~ Apply uniform pack compression using spring-loaded endplates to minimize interfacial thermal resistance without crushing active electrode structures.
- Adaptive Fast-Charging Algorithms ~ Use model-based battery management algorithms that dynamically adjust charge currents based on estimated core temperature rather than surface readings.
Cell formulation adjustments can also balance anisotropic properties. Blending thermally conductive ceramic particles ~ such as aluminum nitride or boron nitride ~ into separator coatings raises cross-plane conductivity without compromising electrical isolation, flattening interior thermal profiles.
Stack tab layout directly alters internal heat generation patterns. Multi-tab designs distribute current injection across the electrode length, cutting localized Joule heating at tab welds and eliminating severe hot spots during high-rate charging.
Adaptive thermal management modulates coolant delivery using estimated core temperatures. While pushing coolant flow during fast charging lowers outer case temperatures, over-cooling the exterior exacerbates the internal gradient if core heat generation stays high. Control logic must balance cooling intensity to limit gradients while capping core temperature limits.
Electrolyte formulation provides a complementary chemical solution. Film-forming additives that build lower-impedance SEI layers reduce charge-transfer resistance, lowering heat generation at low temperatures and directly narrowing core-to-surface deltas.
Tab cooling requires balancing thermal performance against volumetric packaging density. Terminal cooling hardware reduces module packing efficiency by 3 percent to 5 percent, though extended pack longevity regularly offsets this loss in heavy-duty commercial cycles.
Engineering specifications should require tab-to-core thermal resistance values from cell manufacturers prior to sign-off. Without empirical internal thermal parameters, pack thermal design relies on estimates, creating risk of premature field failures.
Verification
Validating predictive degradation models requires experimental methods capable of tracking internal temperatures non-destructively. Conventional surface thermocouples fail to capture core dynamics, making embedded micro-thermocouples or fiber Bragg grating sensors inside test cells necessary for real-time validation.
Embedded fiber Bragg sensors monitor temperatures along the central axis of the stack. Silica fibers withstand organic electrolytes and remain immune to electromagnetic interference. Sensor data show that internal core temperatures routinely peak several minutes after casing temperatures reach their maximum during high-power discharge.
Electrochemical impedance spectroscopy (EIS) serves as an alternative non-invasive tool. High-frequency impedance traces bulk electrolyte resistance, which tracks volume-averaged temperature. Deconvoluting multi-frequency phase response isolates internal core thermal dynamics from surface conditions, permitting state estimation inside the BMS.
Accelerated life testing matrices must separate gradient-induced aging from baseline isothermal aging. Validation protocols compare cells cycled in isothermal chambers against identical cells mounted on single-sided cold plates. Periodic differential capacity analysis (dQ/dV) isolates phase transitions and lithium inventory loss specifically driven by gradient stress.
Post-mortem physical autopsies provide definitive verification. Electrodes harvested in dry rooms across defined spatial locations undergo SEM, XPS, and ICP-MS testing to quantify local SEI thickness, active material micro-cracking, and lithium distributions.
Teardowns reveal clear physical signatures of gradient aging. Core electrodes exhibit thick, degraded SEI layers and high transition metal deposits on the anode, whereas outer layers near cold plates show metallic lithium plating and separator clogging ~ matching coupled 3D model predictions.
Manufacturing tolerances complicate validation testing. Small inconsistencies in electrolyte wetting volume, tab alignment, and winding tension cause cell-to-cell spread in cross-plane conductivity, requiring sample sizes of at least 30 cells per matrix to achieve statistical significance.
Incoming quality control requires pulsed thermal imaging during cell acceptance. Production lots with surface thermal profiles deviating by more than 2 K from the batch mean indicate internal winding defects or dry patches, warranting immediate quarantine.
Sourcing agreements must establish explicit verification protocols, defining fast-charge profiles, coolant conditions, and capacity retention curves. Without gradient-aware qualification standards, integrators risk accepting cells that degrade prematurely in the field.