Solid Electrolyte Interphase Formation Mechanisms in Graphite Anodes
Controlled initial reductive decomposition forms a dual-layer interphase that blocks electron tunneling while enabling lithium transport and transport compliance.

Reduction

Thermodynamic Potentials and Initial Electron Transfer
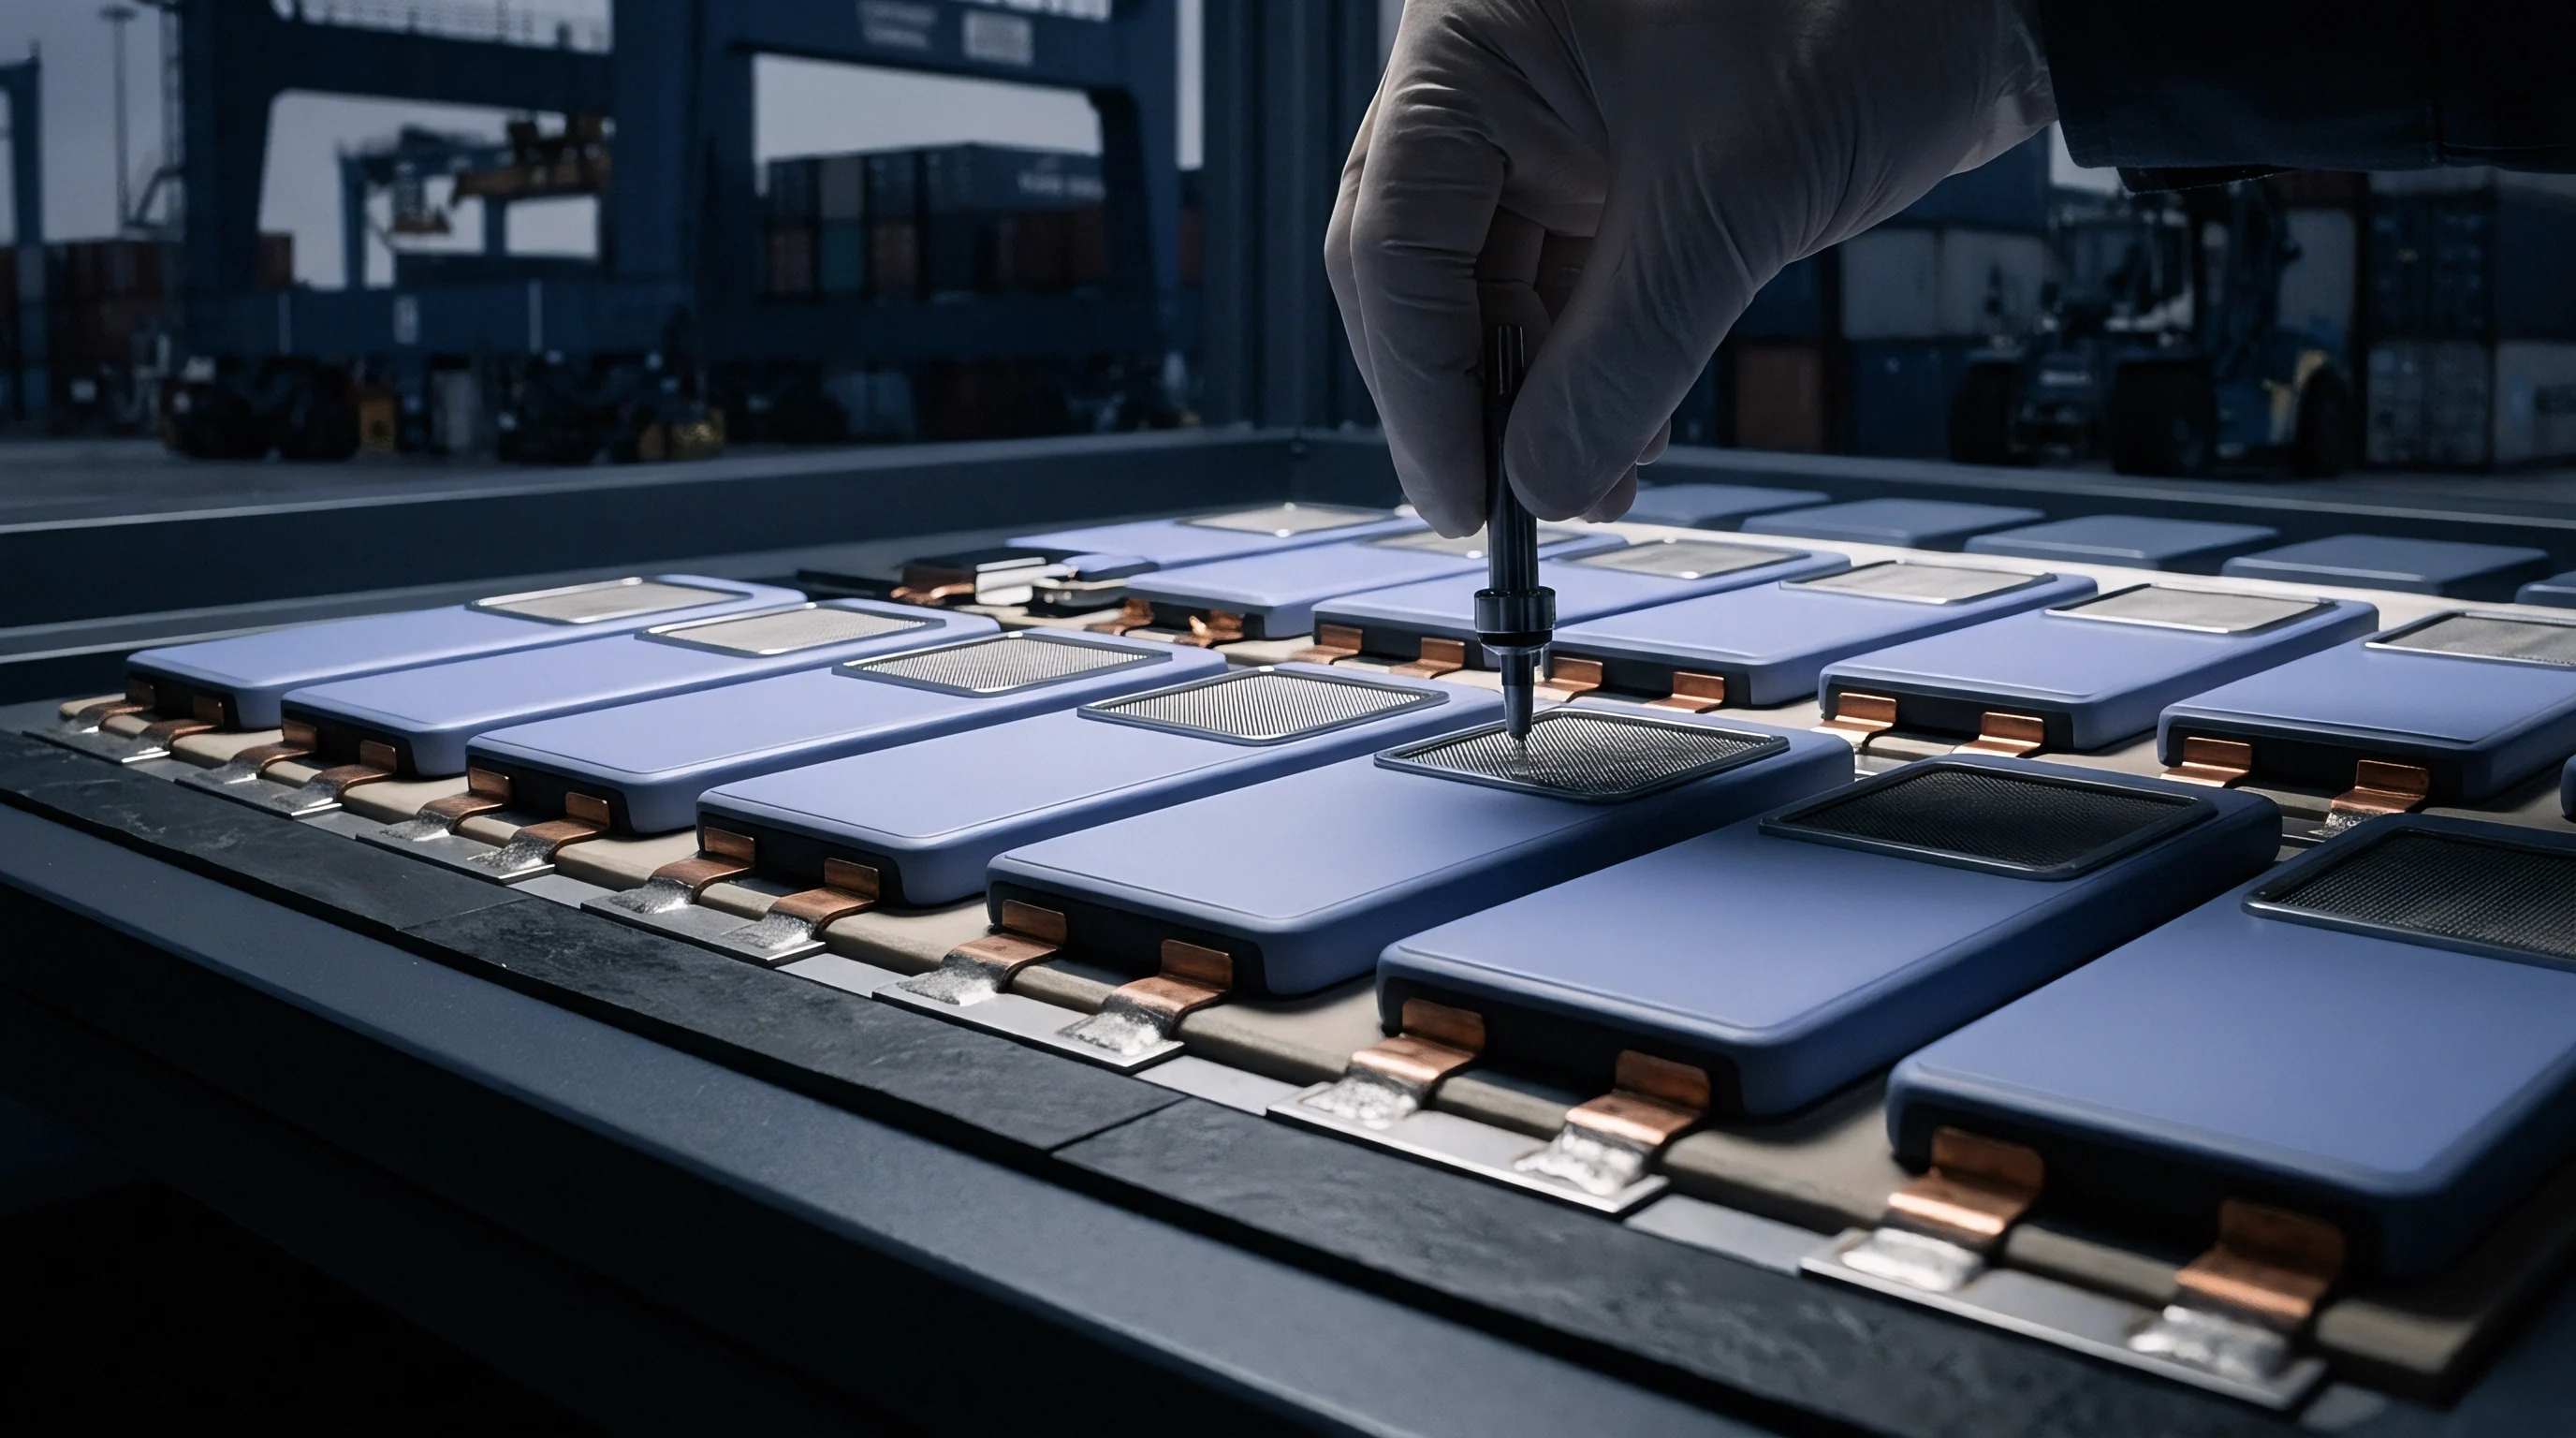
Lithium-ion intercalation into artificial or natural graphite occurs below 0.25 V versus the Li/Li+ reference electrode. Non-aqueous liquid electrolytes ~ typically alkyl carbonate solvents such as ethylene carbonate (EC) and dimethyl carbonate (DMC) paired with lithium hexafluorophosphate (LiPF6) ~ have thermodynamic reduction limits between 0.80 V and 1.30 V versus Li/Li+. Because graphite operates well outside this stability window, direct contact between the unpassivated carbon lattice and the liquid electrolyte drives spontaneous reductive decomposition during initial polarization.
The process consumes active lithium ions and solvent molecules, depositing a heterogeneous passivation layer known as the solid electrolyte interphase (SEI).
Reduction proceeds through single-electron and two-electron transfer pathways. Single-electron reduction of ethylene carbonate yields lithium ethylene dicarbonate (LEDC) and ethylene gas, while two-electron pathways produce lithium carbonate (Li2CO3), lithium oxide (Li2O), and carbon monoxide. Trace moisture above 20 ppm alters this cascade, hydrolyzing LiPF6 into hydrofluoric acid (HF) and precipitating resistive lithium fluoride (LiF) before graphite staging even begins.
Ultimately, passivation kinetics dictate whether the interface remains stable and ionically conductive or suffers ongoing solvent co-intercalation, graphite exfoliation, and early capacity failure.
Single-electron reduction of cyclic alkyl carbonates generates lithium ethylene dicarbonate and ethylene gas at 0.80 V versus Li/Li+.

Stage-Dependent Decomposition Windows
Electrolyte reduction begins before lithium staging takes place in the graphite host. Initial film deposition starts near 1.30 V versus Li/Li+ as trace impurities and active functional groups on graphite edge planes decompose. Between 0.90 V and 0.65 V, solvated lithium complexes, Li+(EC)n, migrate toward the electric double layer.
The cyclic carbonate ring breaks down rapidly in this range, releasing hydrocarbon gases into the pouch or cell casing. Operating below ambient temperature or applying excessive current during this window increases interfacial impedance, triggering localized lithium plating on unpassivated basal facets.
Graphite staging occurs in steps between 0.20 V and 0.04 V versus Li/Li+, progressing from dilute stage-1′ through stages 4, 3, and 2, and ending at fully lithiated stage-1 (LiC6). Interfacial passivation must be mechanically complete before the cell transitions from stage-2 (Li0.5C6) to stage-1 (LiC6). If the layer remains incomplete, solvated lithium complexes enter the interstitial graphite galleries, reducing inside the structure and trapping gas.
This internal gas evolution forces the graphene layers apart, causing irreversible exfoliation, active mass loss, and rapid performance decay.
Standard formation protocols cap current density at C/20 or C/10 across this reduction window to build a compact inorganic underlayer directly on the carbon matrix. Higher formation currents above C/5 push radical recombination toward porous, highly resistive organic oligomers.
Every commercial formation protocol leaves the absolute initial interfacial resistance somewhat uncertain, as dynamic impedance shifts continuously throughout the first stage transition.


Morphology
Dual-Layer Architecture
Transmission electron microscopy and X-ray photoelectron spectroscopy show that the interphase forms a bi-layer structure between 5 and 50 nanometers thick. The inner layer against the graphite surface consists of dense, insoluble inorganic species, mainly lithium fluoride (LiF), lithium oxide (Li2O), and lithium carbonate (Li2CO3). Wide electronic bandgaps in these inorganic crystals block electron tunneling from the conductive graphite into the bulk electrolyte.
This inner zone is mechanically hard and provides low-energy lithium-ion migration pathways along internal grain boundaries.
The outer layer facing the liquid electrolyte consists of partially soluble semi-carbonates, polymeric esters, and alkyl carbonate salts, primarily lithium ethylene dicarbonate (LEDC), lithium alkyl carbonates (ROCO2Li), and polyethylene oxide (PEO) oligomers. This region is porous and flexible enough to absorb localized mechanical strain. By taking up liquid solvent, the organic layer acts as a swollen gel phase that helps desolvate incoming Li+(solv) clusters before ions pass through the inorganic inner layer.
| Compound | Layer Position | Formation Potential (V vs Li/Li+) | Li+ Conductivity (S/cm at 25 C) | Shear Modulus (GPa) |
|---|---|---|---|---|
| Lithium Fluoride (LiF) | Inner Inorganic | 1.20 to 0.70 | 1.0E-12 to 1.0E-09 | 55.0 |
| Lithium Oxide (Li2O) | Inner Inorganic | 0.80 to 0.40 | 1.0E-10 to 1.0E-08 | 78.0 |
| Lithium Carbonate (Li2CO3) | Inner Inorganic | 1.10 to 0.60 | 1.0E-09 to 1.0E-07 | 33.0 |
| Lithium Ethylene Dicarbonate | Outer Organic | 0.80 to 0.50 | 1.0E-06 to 1.0E-05 | 1.2 |
| Polyethylene Oxide Oligomers | Outer Organic | 0.70 to 0.30 | 1.0E-07 to 1.0E-06 | 0.4 |

Lattice Mismatch and Mechanical Cohesion
Graphite expands by roughly ten percent along its c-axis when fully lithiated to LiC6. This expansion and contraction imposes cyclic shear stress between the rigid inorganic inner layer and the carbon substrate. Basal planes, with their low surface energy and minimal volume change, favor thin, uniform passivation films.
Edge planes, by contrast, carry dense dangling bonds and reactive functional groups that accelerate electrolyte breakdown and build thick, uneven deposits.
Maintaining mechanical integrity across the composite interphase requires durable adhesion between these distinct crystalline domains. If the flexible organic outer layer fails to cushion localized strain, repeated expansion cycles crack the brittle inorganic inner layer. Microcracks expose fresh graphite to the electrolyte, setting off secondary reduction cycles that consume active lithium, raise cell polarization, and hasten capacity loss.
Inorganic inner layers stop electronic tunneling while flexible organic outer structures absorb cyclic volume expansion strains.
Premature capacity fade under cycling often traces to unmonitored charging rates that fracture an otherwise pristine passivating interface.


Additives

Sacrificial Reduction Agents
Commercial electrolytes rely on targeted additives to adjust the decomposition sequence. Sacrificial additives have higher reduction potentials than ethylene carbonate, so they decompose before baseline solvent breakdown begins. Vinylene carbonate (VC), for example, reduces between 1.05 V and 1.40 V versus Li/Li+ through radical-initiated polymerization, forming cross-linked poly(vinylene carbonate) and compact lithium poly-dicarbonate networks.
These polymer structures give the organic layer the elasticity needed to withstand graphite expansion without rupturing.
Fluoroethylene carbonate (FEC) reduces differently, undergoing defluorination between 1.10 V and 1.30 V versus Li/Li+. The reaction embeds uniform, nanostructured lithium fluoride (LiF) domains directly into a flexible poly-FEC matrix. Adding FEC lowers interfacial resistance and prevents solvent co-intercalation during high-rate cycling, though excess concentrations cause continuous carbon dioxide (CO2) evolution that increases internal pouch pressure and complicates degassing during manufacturing.
The following sequence traces the primary chemical decomposition steps observed when standard cyclic additives undergo electrochemical reduction at the graphite interface:
- Vinylene Carbonate Inception occurs near 1.30 V when the additive accepts an electron to form a radical anion, driving rapid polymerization into poly(vinylene carbonate).
- Radical Ring Opening cleaves the cyclic ester linkage, shedding carbon dioxide and cross-linking adjacent polymer chains along graphite edge planes.
- Fluoroethylene Carbonate Reduction takes place around 1.20 V through C-F bond cleavage, depositing dense nanocrystalline lithium fluoride directly onto active carbon facets.
- Secondary Alkyl Stabilization terminates reactive radical chains by coordinating free solvent molecules, establishing a cohesive elastomeric boundary layer.

Propane Sultone and Multi-Functional Salts
Sulfur-based additives like 1,3-propane sultone (PS) and ethylene sulfate (DTD) reduce between 0.90 V and 1.10 V versus Li/Li+, depositing lithium alkyl sulfonates (R-SO3Li) and inorganic lithium sulfate (Li2SO4). These sulfur-rich species keep dissolved cathode transition metals (manganese, nickel, and cobalt ions) from reducing onto the graphite surface, where they would otherwise catalyze parasitic film growth and drive self-discharge.
Imide-based salts like lithium bis(fluorosulfonyl)imide (LiFSI) and lithium difluorophosphate (LiDFP) act as auxiliary film formers. LiDFP reduces near 1.25 V, forming robust fluorophosphates and LiF domains that feature low activation energies for desolvation. Electrolyte blends combining 1.5 wt% VC with 1.0 wt% PS and 0.5 wt% LiDFP consistently yield lower direct-current internal resistance (DCIR) after extended thermal storage than single-additive formulations.
Excess additive loading raises initial cell bill-of-materials costs and produces thick, resistive interfaces that restrict charge acceptance at low temperatures.

Transport

Desolvation Dynamics
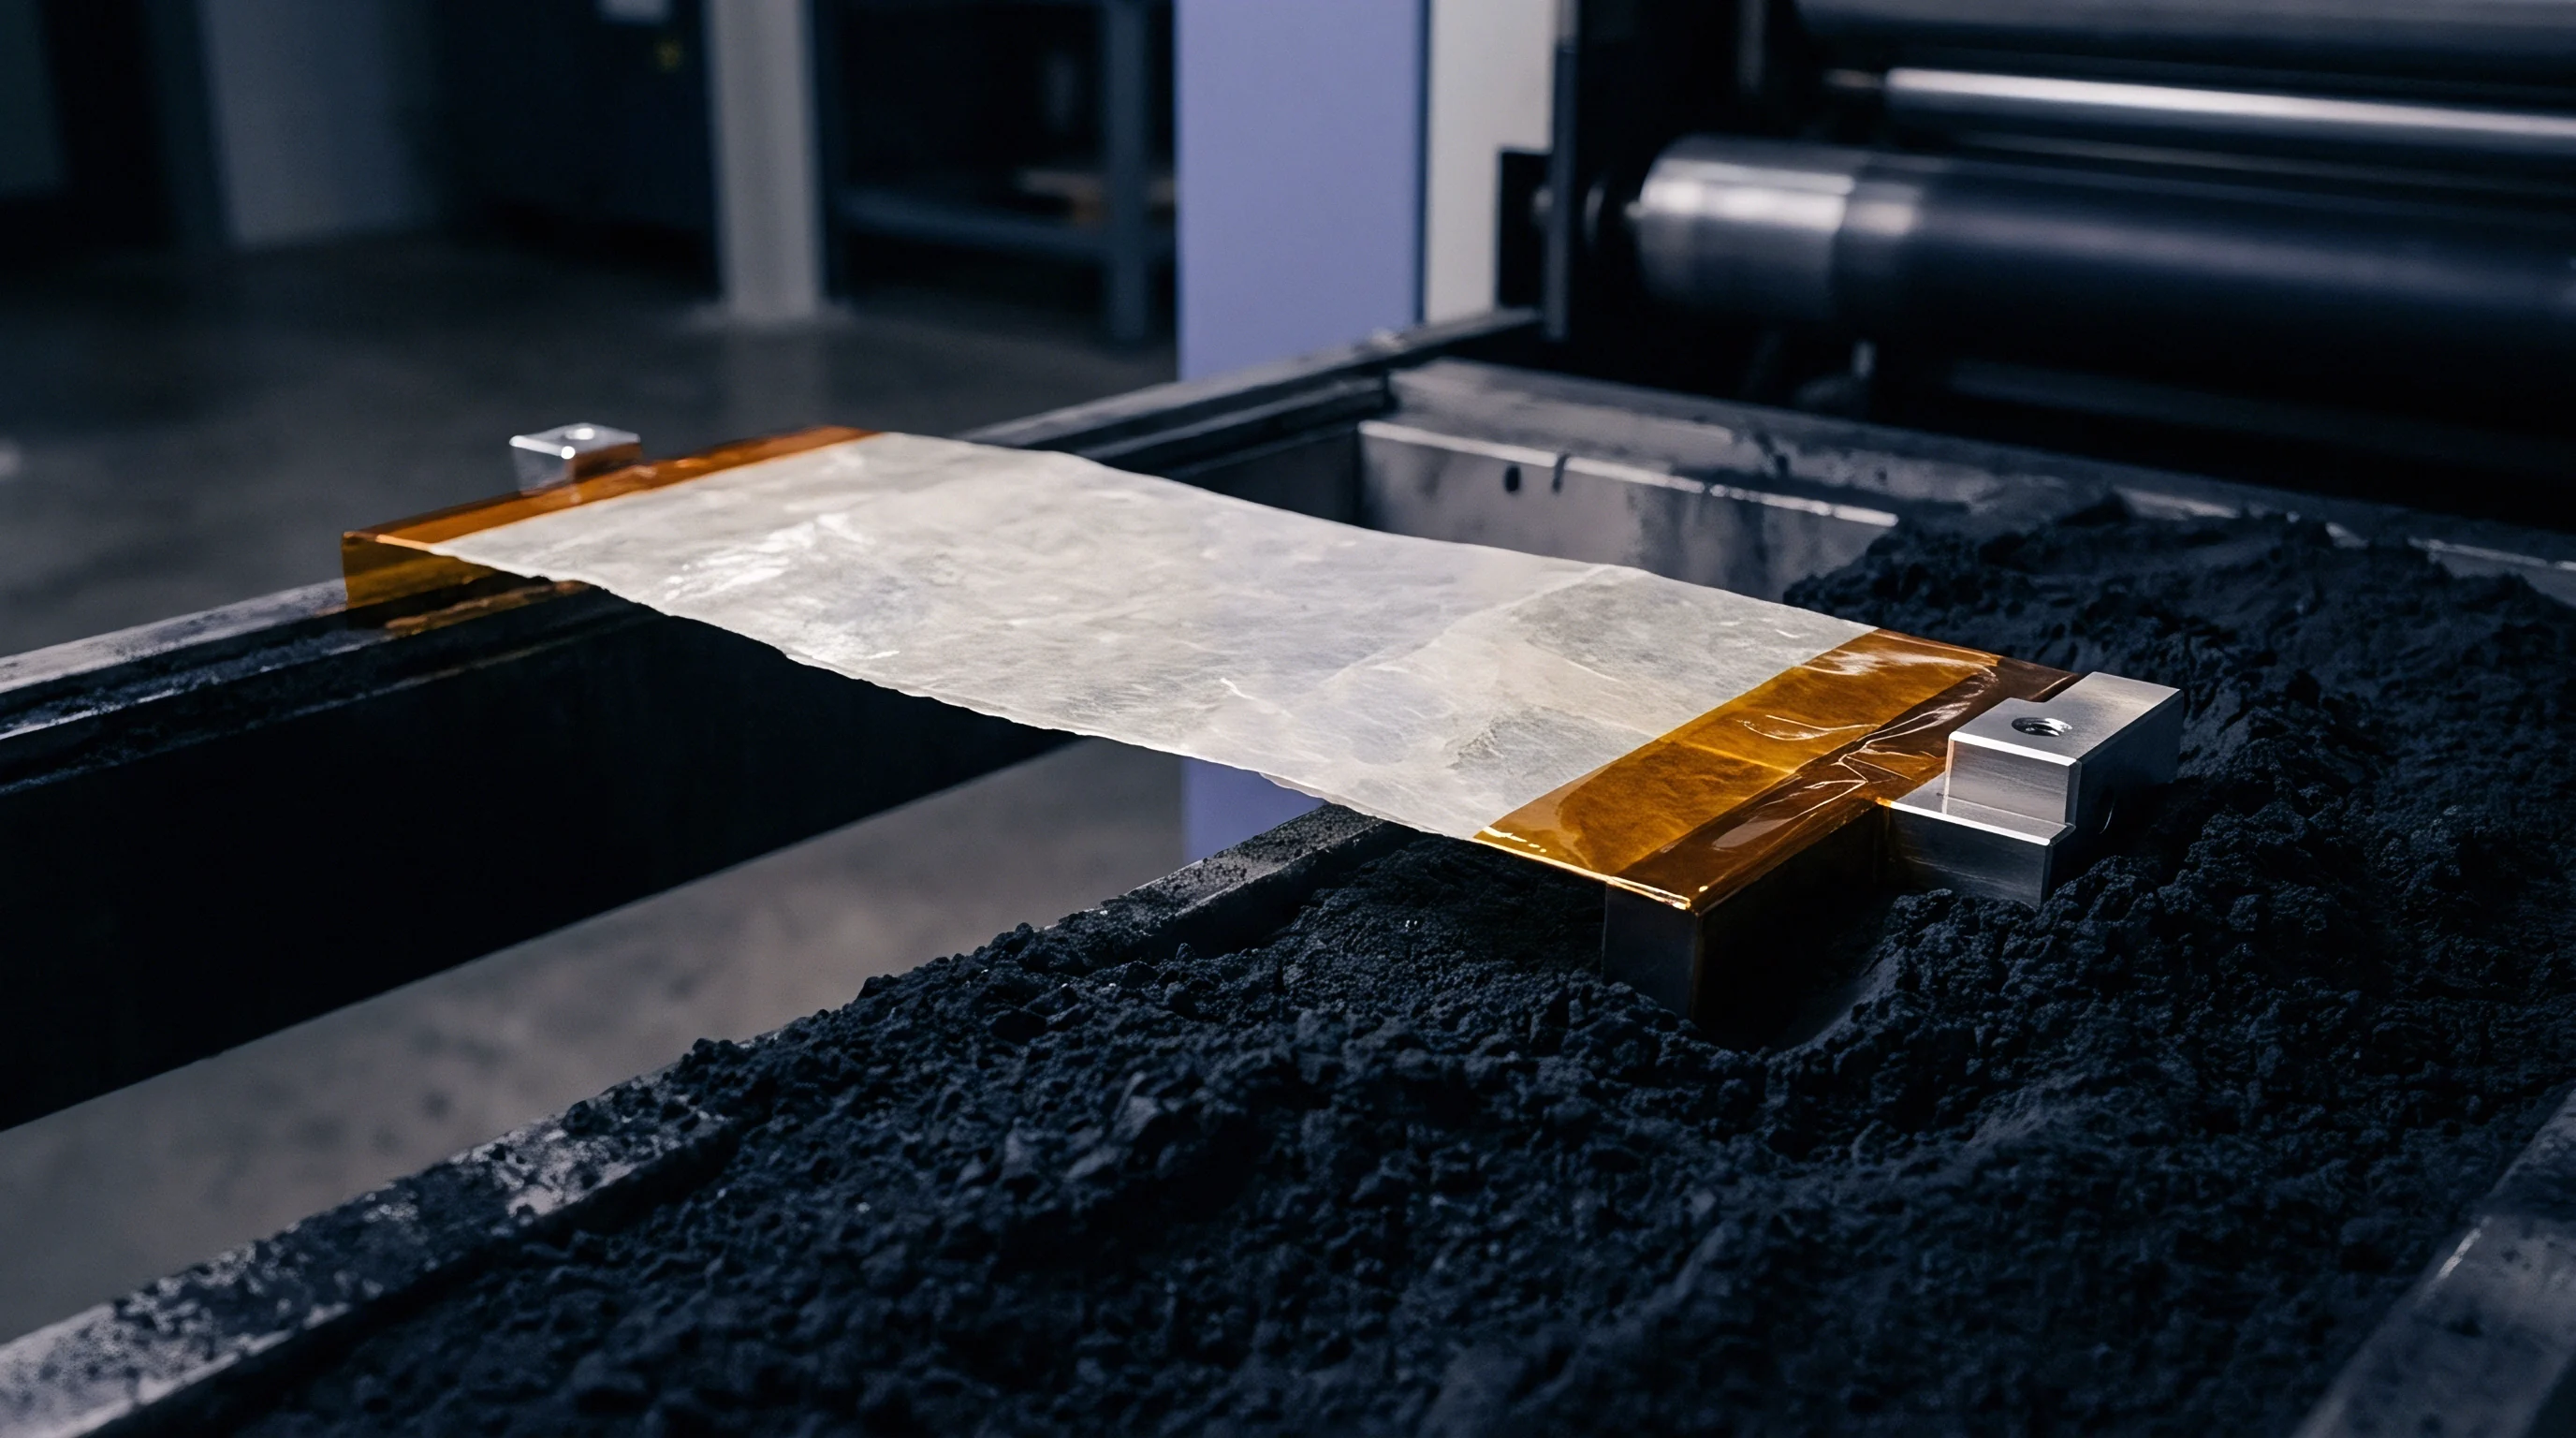
Lithium ions move through the liquid bulk wrapped in a coordination shell of four to six solvent molecules, primarily ethylene carbonate. Before entering the solid interphase, an ion must shed this solvation sheath at the outer SEI boundary. This desolvation step carries an energy barrier of 50 to 70 kJ/mol in standard alkyl carbonate blends, making it the main rate-limiting factor during low-temperature charging.
After desolvating, the bare lithium ion migrates through the porous organic outer matrix toward the dense inorganic boundary. Coordinating oxygen groups on the PEO-type chains offer low-energy hopping sites that aid interstitial transfer with minimal activation energy. Fast-charging protocols require tight control over this process; excessive overpotentials drive solvated complexes straight into the inner layer, causing solvent co-intercalation and delaminating the graphite.
| Phase Domain | Primary Charge Carrier | Migration Activation Energy (eV) | Electronic Conductivity (S/cm) | Bulk Density (g/cm3) |
|---|---|---|---|---|
| LiF Grain Boundaries | Li+ Interstitial / Vacancy | 0.30 to 0.45 | Less than 1.0E-14 | 2.64 |
| Li2O Crystalline Lattice | Li+ Frenkel Defect | 0.40 to 0.55 | Less than 1.0E-13 | 2.01 |
| Li2CO3 Polycrystalline | Li+ Vacancy Hopping | 0.50 to 0.70 | Less than 1.0E-12 | 2.11 |
| Polymeric Semi-Carbonates | Li+ Solvated Segmental | 0.20 to 0.35 | 1.0E-11 to 1.0E-09 | 1.35 |
Ionic Conduction Pathways
Ion conduction through the dense inorganic inner layer relies on grain boundaries and lattice defects rather than transport through pristine crystal bulk. Single-crystal lithium fluoride has a very low room-temperature ionic conductivity of 1.0E-12 S/cm. Nanocrystalline LiF, by contrast, contains abundant grain boundaries that provide fast interstitial hopping pathways, boosting effective conductivity to 1.0E-08 S/cm.
Tailoring these grain boundaries through controlled additive decomposition during formation significantly lowers overall interfacial impedance.
Point defects, such as Frenkel and Schottky defects in Li2O and Li2CO3 lattices, offer additional diffusion channels. The choice of graphite precursor directly affects defect density: highly crystalline natural graphite yields uniform, low-defect interfaces, whereas synthetic graphite with variable surface roughness produces tortuous grain boundary networks with higher defect concentrations.
Poor control over formation current and temperature creates disordered grain boundaries that raise the activation energy for lithium transfer and degrade high-rate performance.


Protocol
Thermal and Electrochemical Parameters
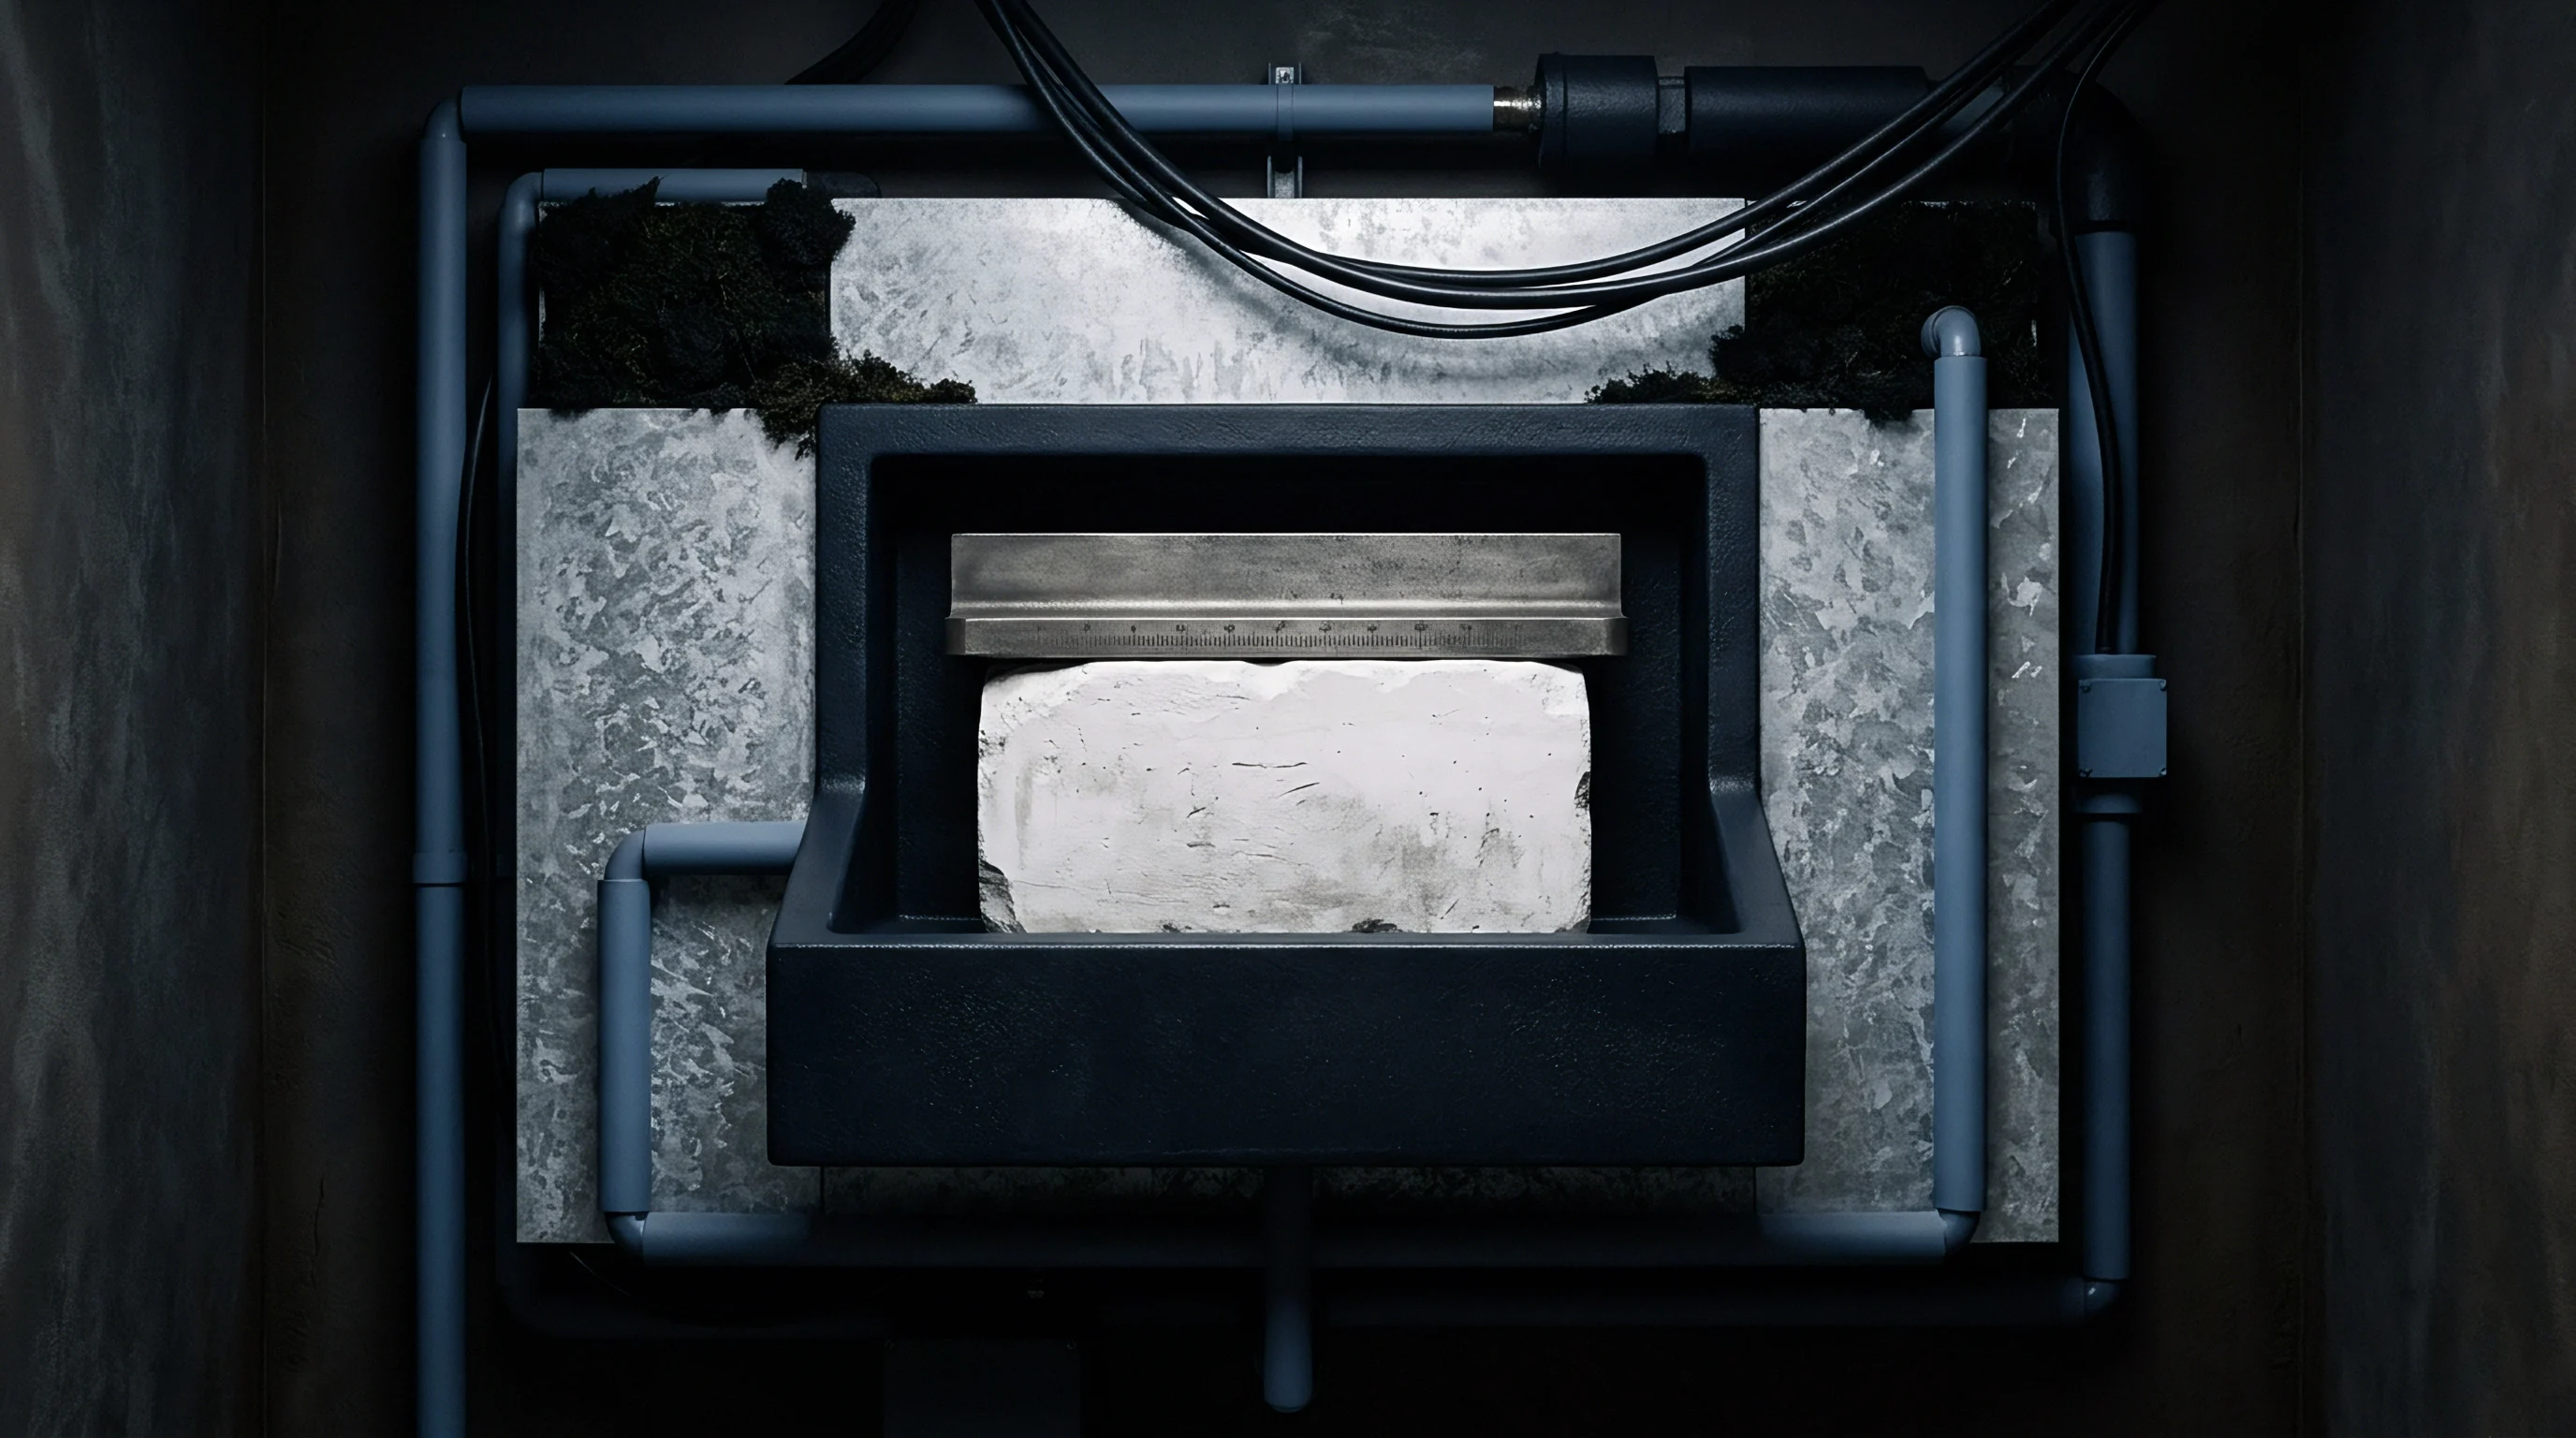
Industrial formation protocols determine the structure, uniformity, and resistance of the initial interphase. The process uses controlled-current charging steps punctuated by specific thermal dwell periods. Before current is applied, filled cells undergo a wetting soak at elevated temperatures (typically 35 C to 45 C) for 16 to 36 hours.
This ensures full electrolyte penetration into the porous graphite electrode, preventing dry spots that would cause localized current spikes and uneven passivation.
Charging starts at a low rate, usually C/25 or C/20, until cell potential reaches 3.0 V (about 0.70 V at the graphite anode). This gentle rate lets sacrificial additives like VC and FEC reduce slowly, forming an even inorganic primer without generating rapid gas pulses. Above 3.4 V, current density steps up to C/10 or C/8 until the cell reaches its upper cutoff voltage (between 3.8 V and 4.2 V, depending on cathode chemistry).
Stepped rates shorten total formation time while maintaining film density.
Formation current applied at C/20 between 2.5 V and 3.4 V prevents localized structural delamination from excessive gas evolution rates.
Degas Cycles and High-Temperature Aging
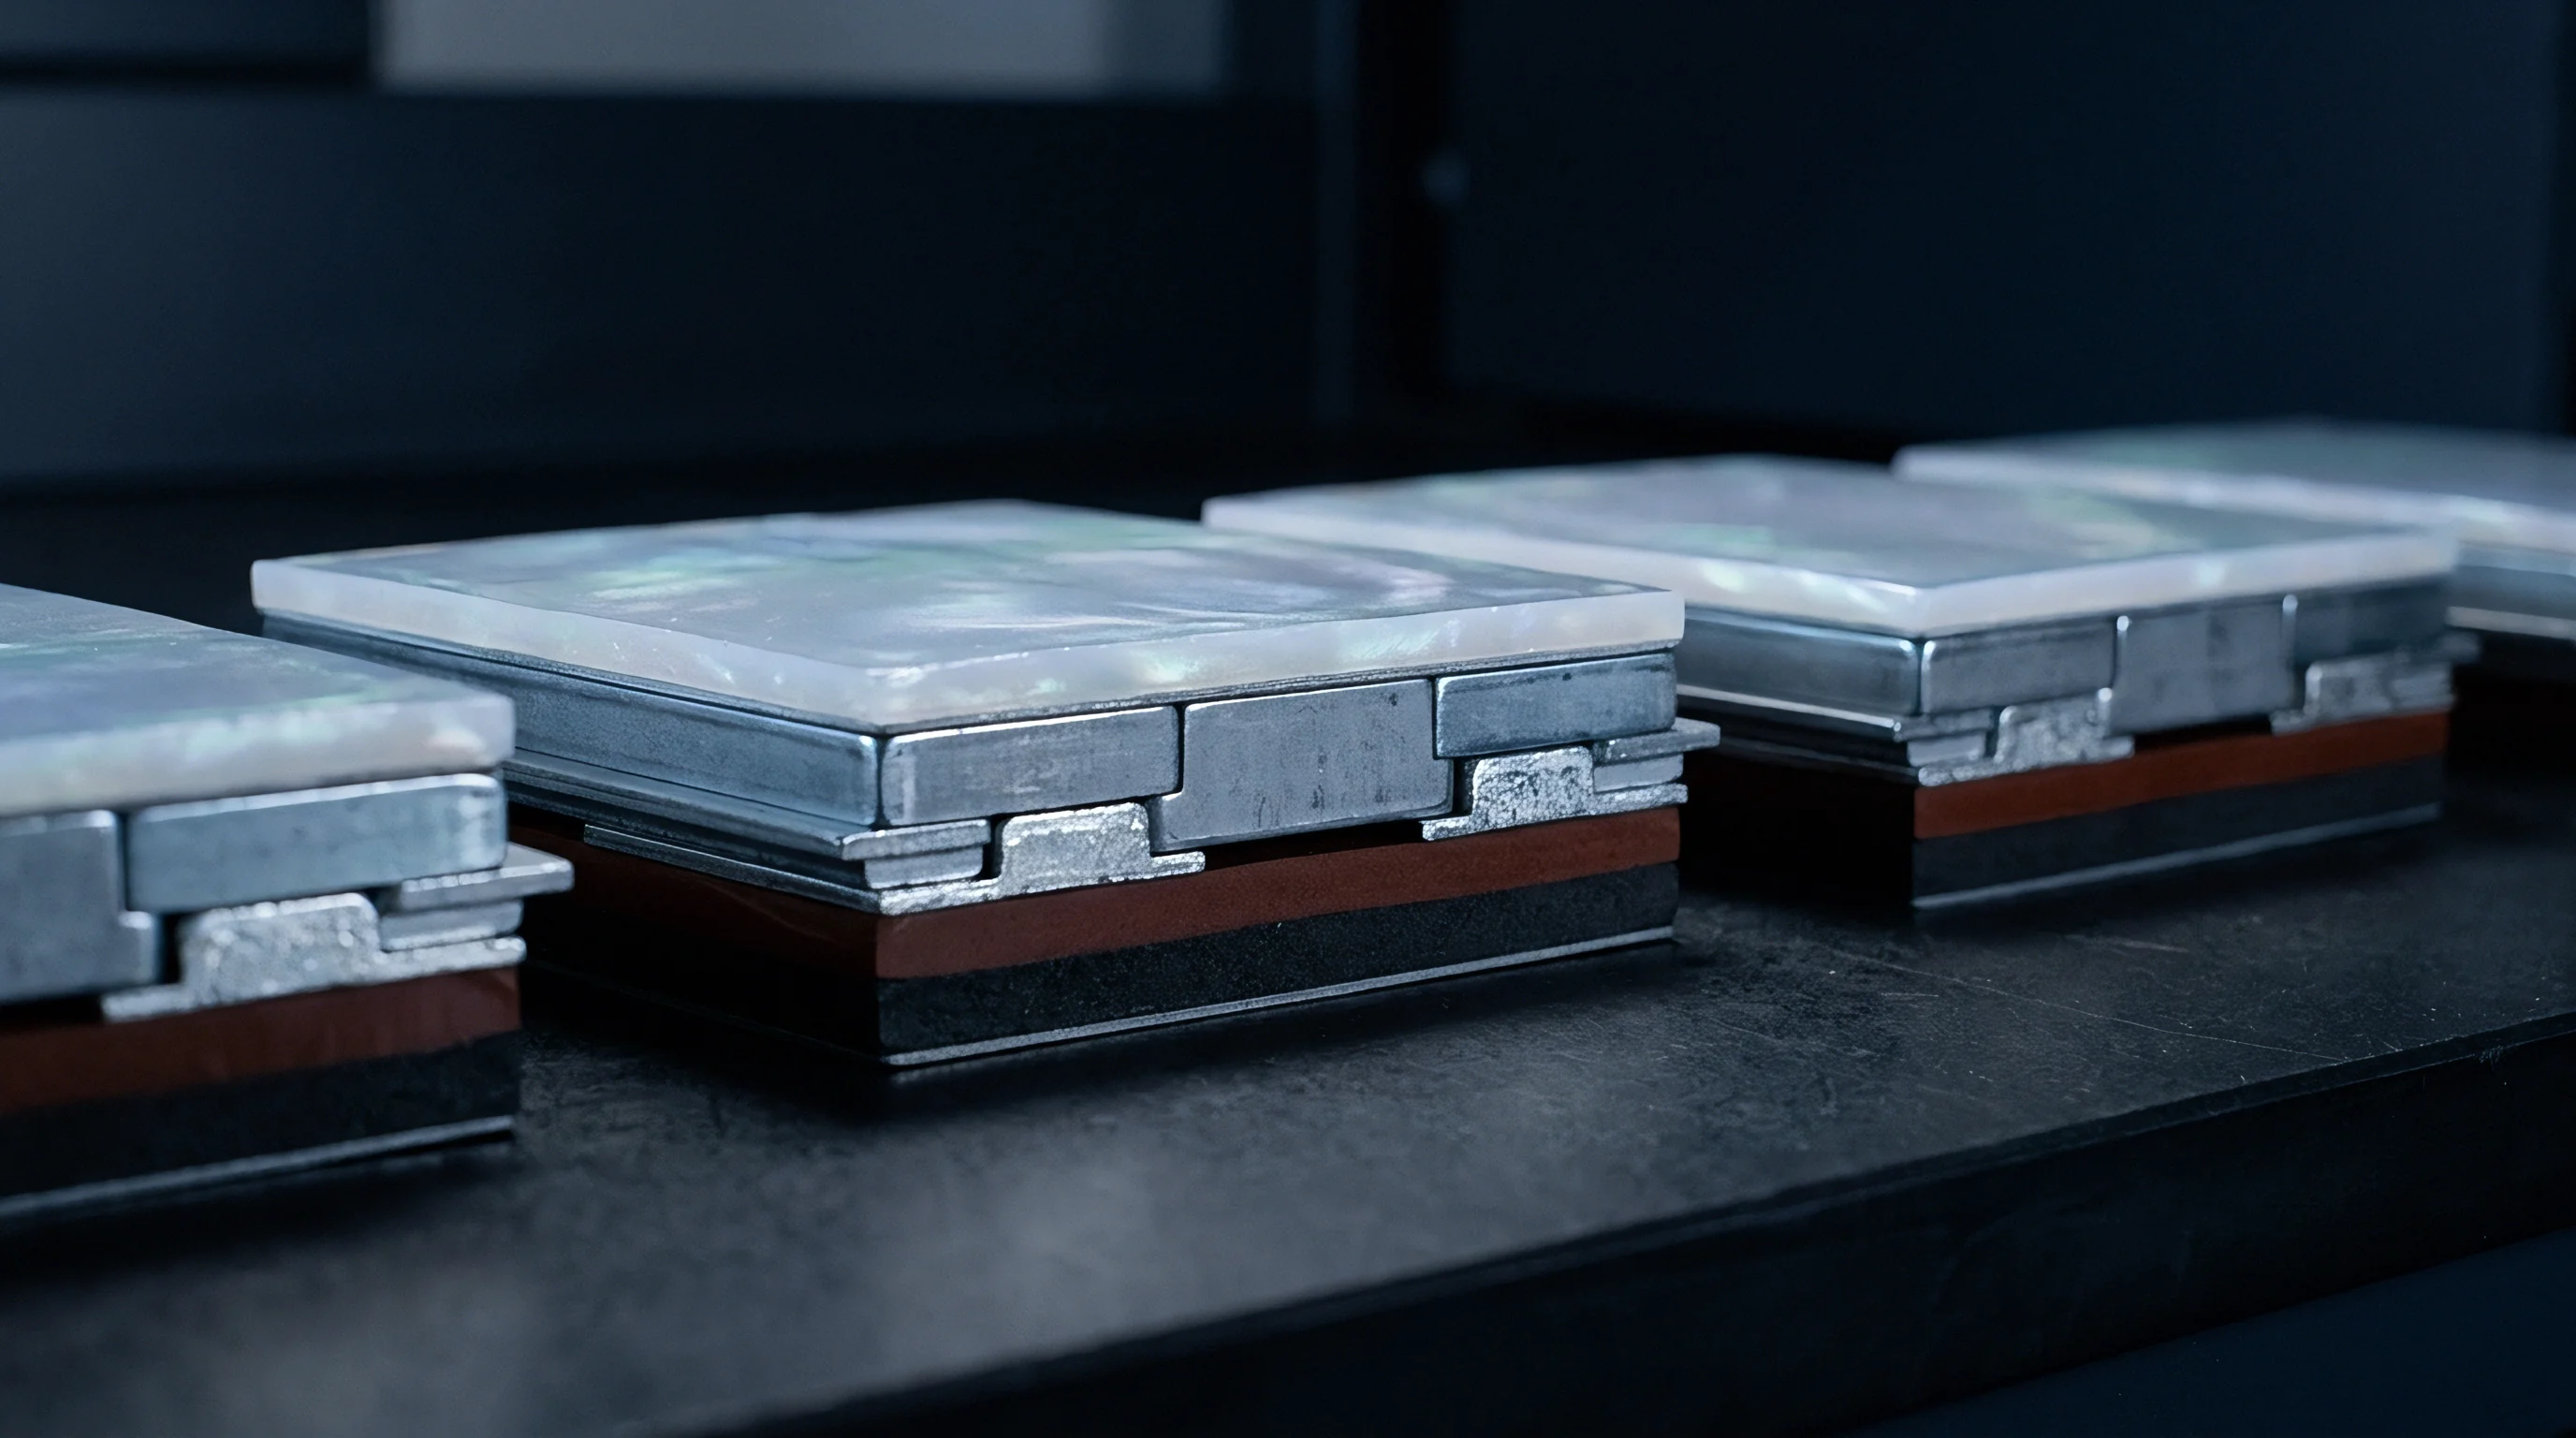
Formation reduction generates substantial gas volumes, including ethylene (C2H4), carbon monoxide (CO), carbon dioxide (CO2), and hydrogen (H2). Pouch cells use an attached gas bag to collect these gases without deforming the active cell stack. After the main formation charge, cells are punctured, evacuated to negative pressures between -90 kPa and -95 kPa, and heat-sealed during the degassing step.
Resealed cells then move to high-temperature aging chambers at 45 C ± 2 C for 3 to 7 days. Thermal aging accelerates chemical restructuring within the SEI, breaking down metastable organic radicals and forming stable inorganic carbonates and fluorides. A final room-temperature aging period of 14 to 28 days tracks open-circuit voltage drop over time (measured as K-value in mV/day) to flag micro-shorts or continuous parasitic reactions before final cell grading.
The following parameters represent standard manufacturing limits for qualification of the interfacial formation protocol:
- Initial Wetting Duration requires a minimum of 24 hours at 40 C under 50 kPa external stack pressure to ensure complete electrolyte saturation.
- Primary Formation Current operates at C/20 up to 3.2 V, followed by C/10 charging to 3.9 V.
- Chamber Degas Pressure draws down to -92 kPa during pouch puncturing and vacuum heat-sealing.
- Thermal Stabilization Aging maintains 45 C for 96 continuous hours to complete interfacial inorganic conversion.
- Voltage Drift Metric rejects cells showing an open-circuit voltage decay above 0.80 mV/day across a fourteen-day measurement baseline.
Commercial supply contracts typically leave the exact duration of room-temperature aging open to negotiation depending on production lead times.


Degradation
Which Factors Drive Continuous SEI Thickening?
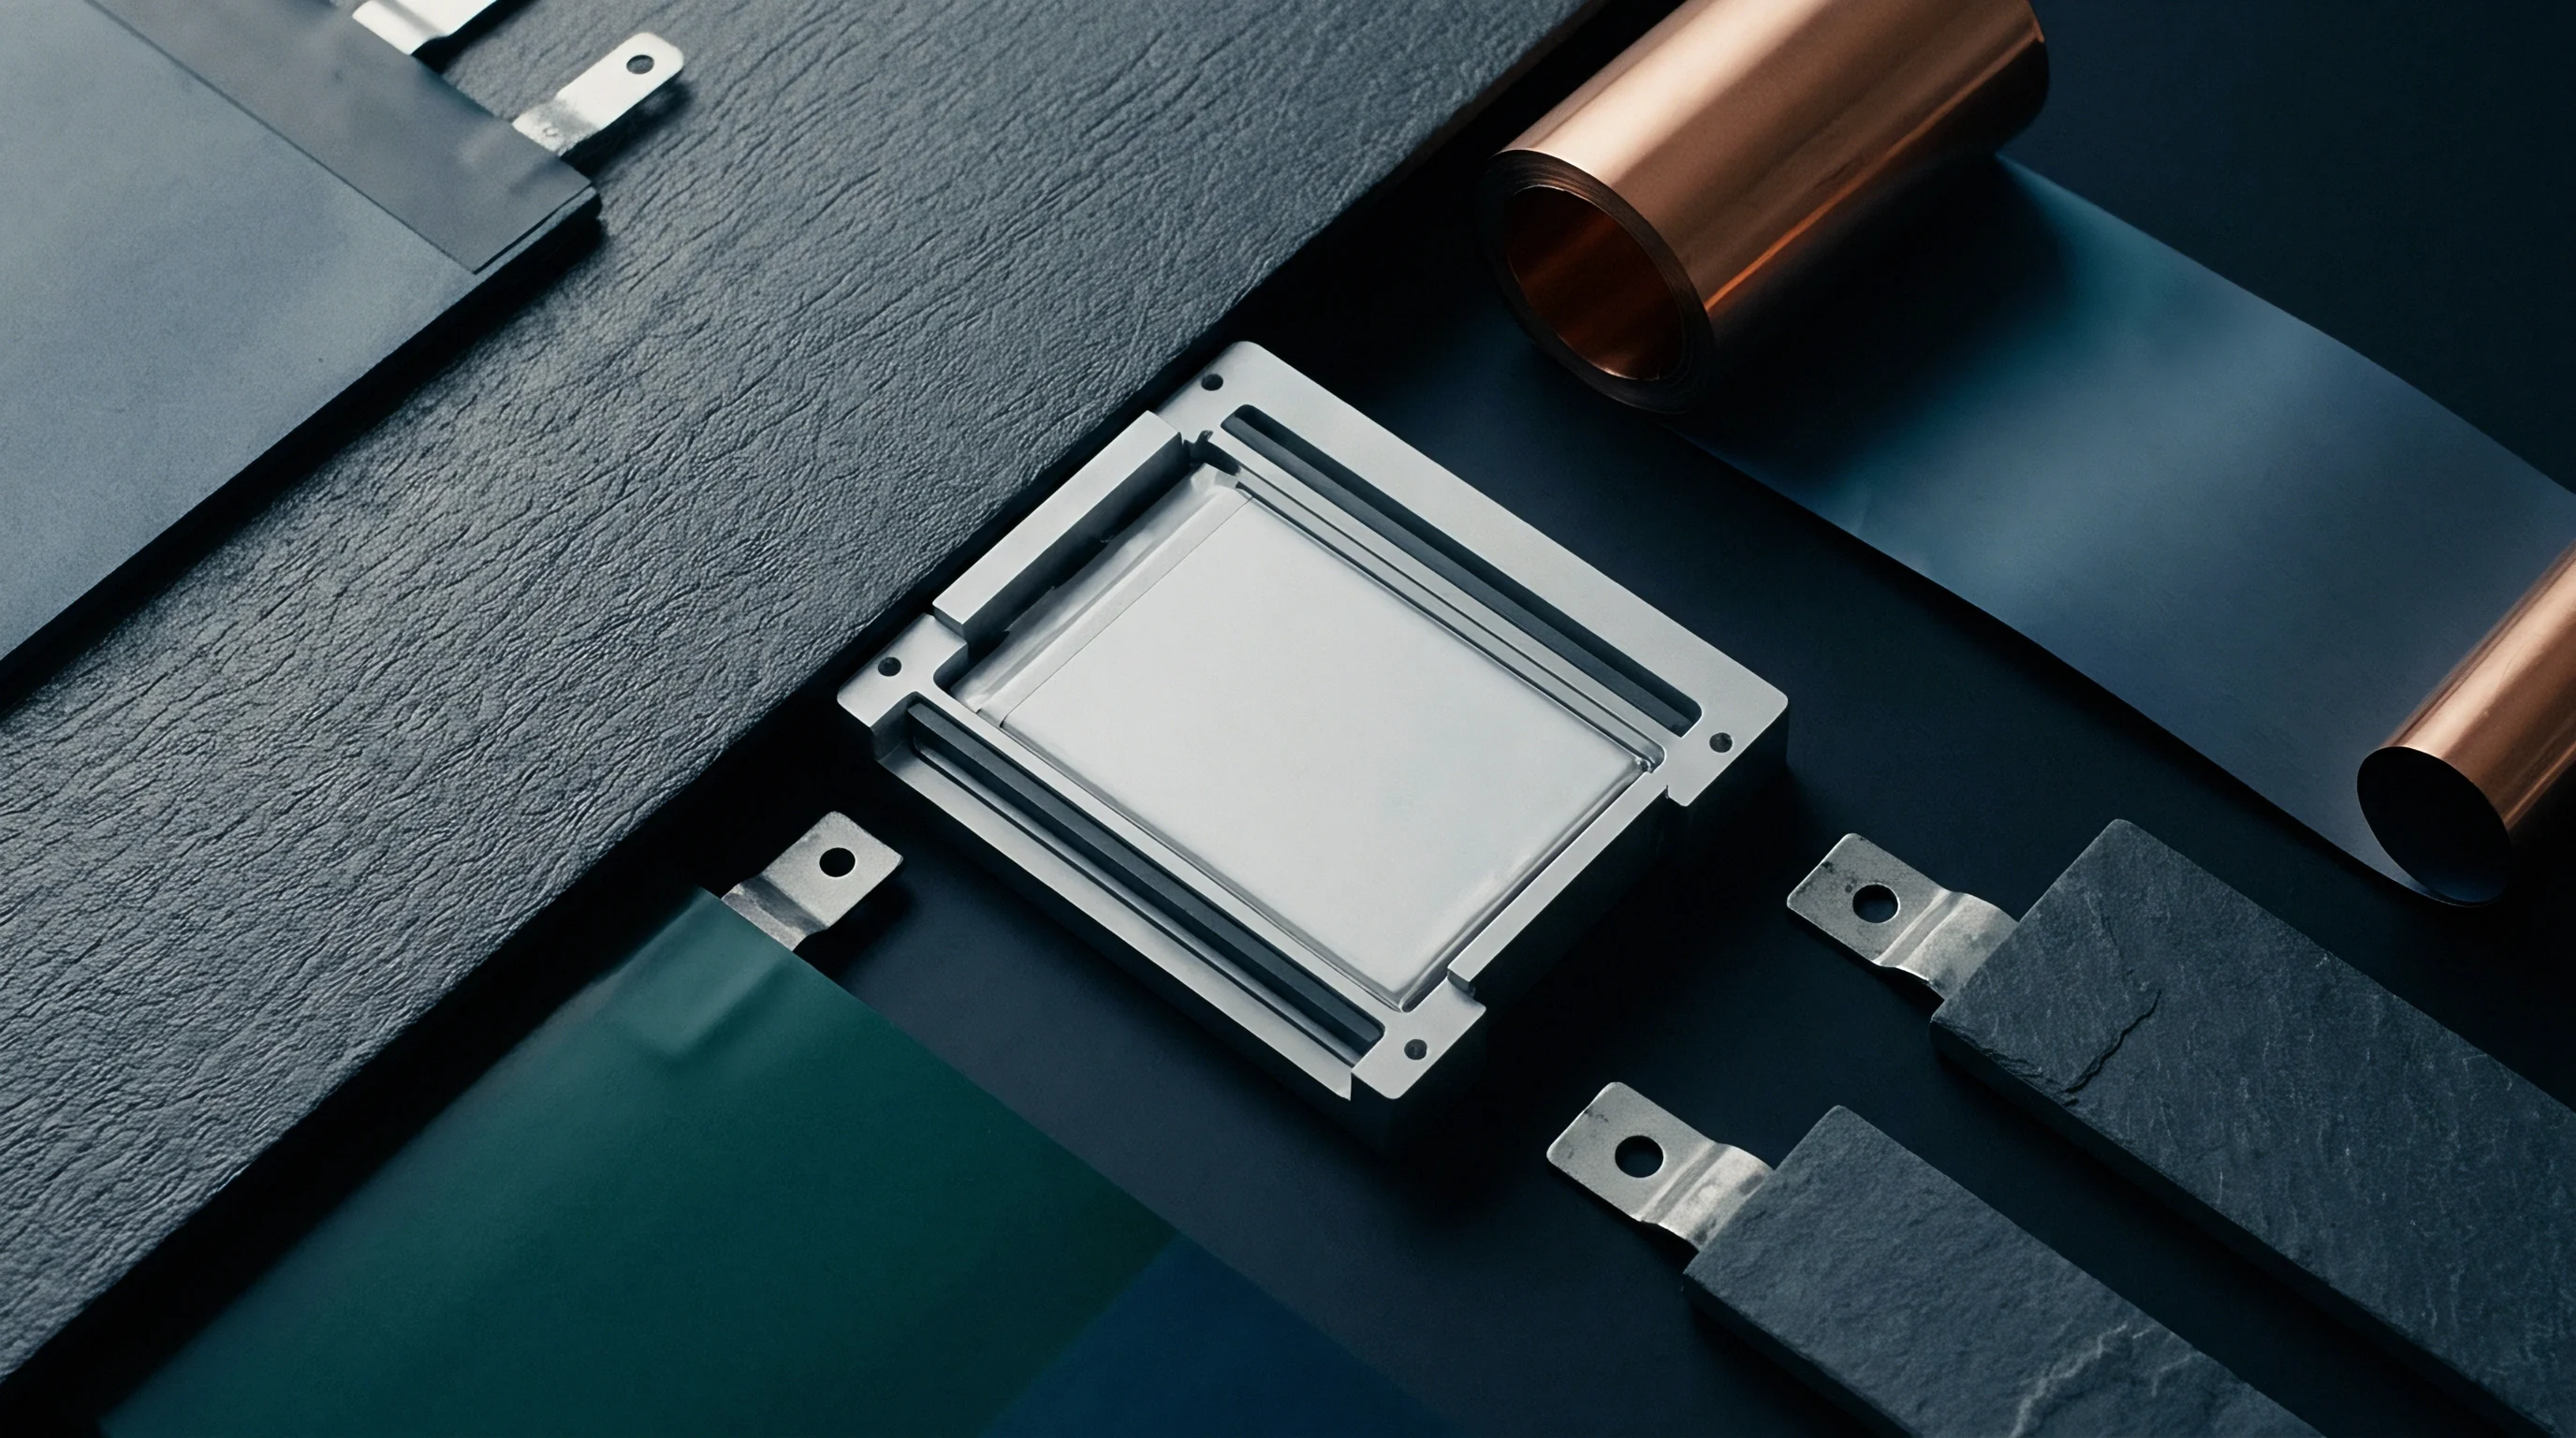
The solid electrolyte interphase is not static; it evolves continuously throughout the life of the battery. Even with wide electronic bandgaps, thin regions of the passivating film still allow slow electron tunneling and radical transport. This ongoing parasitic leakage sustains long-term electrolyte reduction at the anode, driving calendar aging.
Higher storage temperatures speed up the reaction: holding a cell at 55 C triples the rate of solvent reduction compared to 25 C storage, steadily draining cyclable lithium from the cathode and causing irreversible capacity loss.
Cycling adds mechanical stress to chemical growth. As graphite expands and contracts by ten percent, localized cracks form in the rigid LiF and Li2CO3 matrix. Freshly exposed carbon reacts immediately with liquid electrolyte, forming secondary SEI patches.
Over hundreds of cycles, this repeated cracking and healing builds up a thick, uneven layer that raises internal resistance, permanently traps cyclable lithium, and consumes electrolyte solvent.
Operating cathodes at high voltages introduces another degradation mechanism: transition metal cross-talk. Above 4.15 V versus Li/Li+, layered oxides such as NMC811 experience minor surface lattice instability, releasing trace manganese (Mn2+), nickel (Ni2+), and cobalt (Co2+) ions into the electrolyte. These cations migrate through the separator and deposit on the graphite anode, where they act as catalytic sites that decompose the passive SEI film and accelerate parasitic electrolyte consumption.
Standard quality assurance clauses in supply agreements require cell manufacturers to warrant maximum capacity fade rates within defined temperature and depth-of-discharge limits.
Qualification

Electrochemical Impedance Spectroscopy
Incoming cell batches undergo electrochemical screening to verify the structural uniformity and transport behavior of the interphase. Electrochemical impedance spectroscopy (EIS) from 100 kHz down to 10 mHz is the primary non-destructive test. In the resulting Nyquist plot, the high-frequency real-axis intercept measures pure bulk ohmic resistance (electrolyte and current collectors), while the flattened semicircle at high-to-mid frequencies corresponds to SEI film resistance (R_sei) and its constant phase capacitance.
A second semicircle in the mid-frequency band reflects charge-transfer resistance (R_ct) across the double layer. Cells from a controlled production run show tightly clustered R_sei values across sample lots. Elevated R_sei readings signal an overly thick, defective, or poorly solvated layer, typically caused by incomplete formation aging, incorrect additive ratios, or moisture contamination during assembly.
Differential Capacity Analysis
Differential capacity analysis (dQ/dV) tracks incremental capacity changes across discrete voltage steps during low-rate cycling (C/25 or C/50). The dQ/dV curves transform flat voltage plateaus into distinct peaks that mark thermodynamic staging transitions in the graphite host. Peak positions and areas yield quantitative insights into interfacial kinetics and remaining lithium inventory.
Sacrificial additive reduction produces clear peaks in the initial formation dQ/dV profile. Vinylene carbonate reduction shows up as a strong peak at 1.25 V, while baseline ethylene carbonate reduction creates a broader feature near 0.75 V. During post-formation quality control, the disappearance of the additive peak confirms that the film-forming agent has reacted completely. Peak shifts in graphite staging over diagnostic cycles quantify rising interfacial overpotential, flagging non-conforming lots before modules are assembled.
When factory formation controls drift, incoming cell lots arrive with wide resistance variance, prompting quality control teams to reject the shipment against incoming technical specifications.

Compliance
Safety File Assembly and Regulatory Baselines
A high-performance passivation layer serves little purpose if the finished cell cannot pass international regulatory tests. The physical properties of the interphase dictate how a cell behaves during mandatory transport and safety testing; incomplete or defective passivation leads to gas build-up, thermal instability, and cell failure during formal certification trials.
Every commercial battery shipment requires a comprehensive safety dossier containing valid test summaries and compliance certificates mapped directly to international transport regulations. The baseline requirements encompass three primary instruments:
- UN 38.3 Test Summary validates compliance with the UN Manual of Tests and Criteria, Section 38.3, confirming survival across eight abuse protocols including thermal shock (Test T.2) and external short-circuit (Test T.5).
- IEC 62133 Certification provides formal type-approval under international safety standards for secondary cells containing non-acid electrolytes in portable applications.
- Dangerous Goods Declaration establishes transport classification under UN 3480 (lithium-ion batteries) according to ICAO/IATA Packing Instruction 965 Section IA/IB for air transit or the IMDG Code for maritime carriage.
In UN 38.3 Test T.2 (Thermal Test), cells cycle rapidly between -40 C and +72 C. Poorly passivated anodes with unreacted semi-carbonates break down at high temperatures, creating internal pressure that ruptures cell seals. Test T.5 applies an external short circuit below 0.1 ohm at 57 C: cells with irregular or weak interphases risk localized thermal runaway as high current concentrations cause internal separator collapse.
Commercial Liability and Logistics Execution
Logistics providers and air freight carriers enforce strict compliance checks at acceptance. Forwarders turn away shipments if the model number on the UN 38.3 Test Summary differs from the label on the outer UN-rated packaging. Under IATA rules, standalone lithium-ion cells (UN 3480, PI 965) cannot exceed a 30 percent state of charge (SoC) at handover.
Higher self-discharge from a defective interphase (evidenced by an elevated K-value) complicates SoC verification and leads to rejections at the terminal.
The European Union Battery Regulation mandates lifecycle and safety documentation, including carbon footprint declarations and supply chain due diligence records. Importers of record assume direct legal and financial liability for non-compliant cells entering the EU. If a cell fails in the field because of latent interphase degradation, financial exposure can include recall costs, customs fines, and voided insurance coverage.
Rigorous anode passivation during manufacturing provides the primary defense against these liabilities.
Air forwarders reject consignments when the model designation on the UN 38.3 test summary omits even a single terminal suffix present on the physical cell jacket.