Quantifying Non Linear Capacity Knee Fade Mechanisms Driven by Solid Electrolyte Interphase Thickening in Aged Lithium Iron Phosphate Cells
Nonlinear knee fade in LFP cells occurs when SEI growth exhausts cyclable lithium inventory, triggering rapid anode overpotential escalation and plating.


Depletion
Lithium iron phosphate cells undergo a long stretch of steady, predictable degradation before hit by a sudden turn in capacity loss ~ the knee point. Over thousands of early cycles, the primary driver is lithium inventory loss from continuous solid electrolyte interphase growth on the graphite anode. Fade in this regime stays linear or sub-linear, scaling with the square root of equivalent full cycles.
As cyclable lithium ions migrate from the olivine cathode, the growing interphase consumes them, converting active inventory into insoluble species like lithium carbonate, lithium fluoride, and lithium alkyl carbonates. Usable capacity tracks this diminishing inventory directly, even while both the graphite anode and iron phosphate cathode retain spare storage capacity.

Electrochemical Balance and Inventory Exhaustion
The shift from gradual linear fade to a steep drop marks a change in what limits cell capacity. Commercial cells start with a lithium inventory matched to theoretical cathode loading, balanced against active graphite anode mass at a negative-to-positive ratio between 1.05 and 1.20. As passivating films trap mobile lithium, the negative electrode’s operating potential window shifts upward.
Consequently, the anode state of charge at full cell discharge climbs, while cathode state of charge at full cell charge drops.
Lithium inventory loss dictates capacity decline until active material utilization reaches electrode saturation limits.
Cell balance keeps operating voltages inside safe bounds until cyclable inventory drops below what is needed to reach the flat graphite intercalation plateaus. Graphite accommodates lithium through distinct staging steps: stage 4L at 0.21 volts versus lithium, stage 3L at 0.14 volts, stage 2 at 0.12 volts, and stage 1 at 0.08 volts. When mobile lithium loss hits roughly twenty percent of initial stoichiometric reserves, the negative electrode is forced to operate almost entirely in dilute phase regions.
Terminal voltage cutoffs then trigger early on both charge and discharge, causing capacity to fall sharply cycle by cycle.

Parasitic Film Growth Rates
Interphase expansion is driven by solvent reduction, sustained by electron tunneling through existing passivation films and solvent diffusion across defective grain boundaries. Alkyl carbonate solvents ~ chiefly ethylene carbonate and ethyl methyl carbonate ~ decompose at potentials below 0.8 volts versus lithium metal. The growing film adds ionic transport resistance while consuming solvent from the porous separator and electrode pores.
Higher operating temperatures accelerate these chemical reduction rates following Arrhenius kinetics, doubling film growth velocity between twenty-five and forty-five degrees Celsius.
During early life, this interphase growth consumes lithium without damaging the mechanical framework of the host materials. Keeping ambient temperatures closely regulated around twenty-five degrees Celsius extends operating life substantially.

Pore
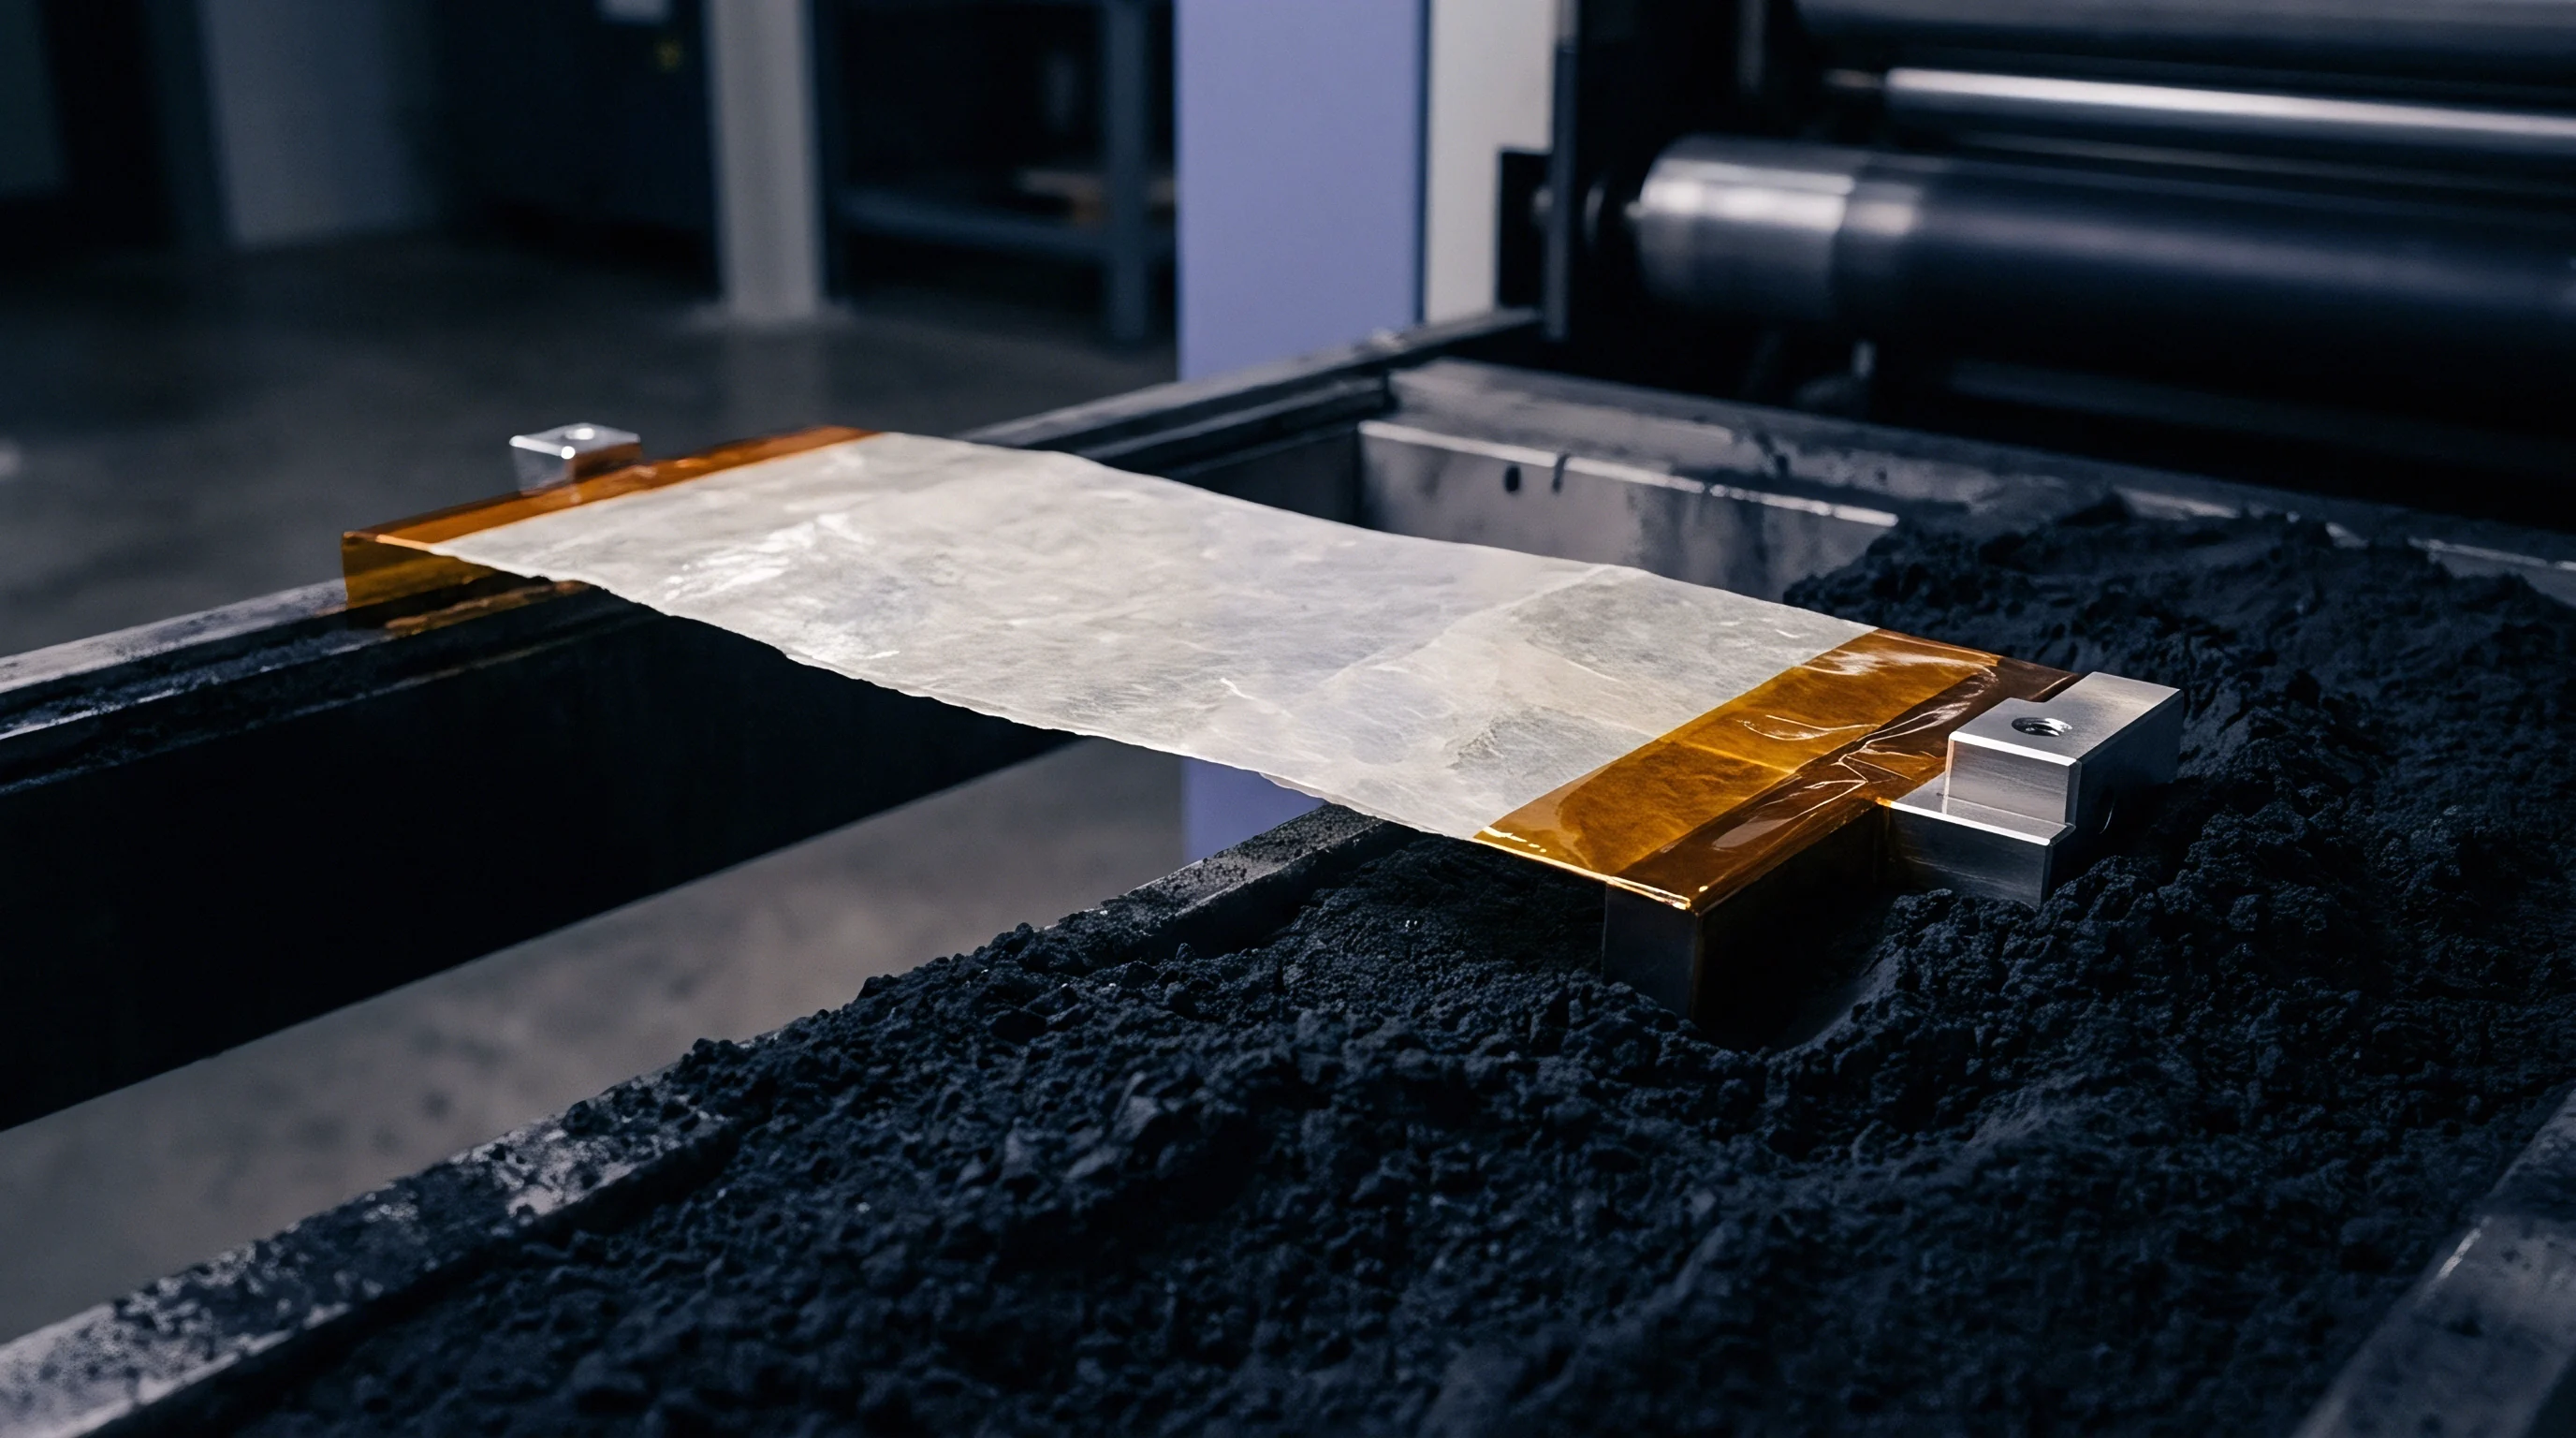
Decomposition products building up inside negative electrode voids alter the internal microstructure over time. Rather than forming an atomically flat barrier, the solid electrolyte interphase deposits as an uneven layer across graphite particle surfaces, occupying open void space throughout the electrode depth. In a fresh graphite electrode with thirty percent initial porosity, this precipitation gradually restricts volume for liquid electrolyte ingress, narrowing ionic pathways and driving up tortuosity.
Tortuosity Escalation and Mass Transport Limitation
Electrolyte transport in porous electrodes relies on effective liquid diffusivity, described by the Bruggeman relation where ionic conductivity scales with porosity raised to an exponent between 1.5 and 2.2. As solid deposits reduce local porosity from thirty percent to fifteen percent, electrolyte phase resistance triples. Transport of lithium ions through the electrolyte then becomes the rate-limiting bottleneck during high-rate operation, building steep concentration gradients across the electrode thickness.
| Aging Interval Cycles | Anode Porosity Percent | Effective Tortuosity Factor | Electrolyte Volume Loss Percent | Charge Transfer Resistance Ohms |
|---|---|---|---|---|
| Fresh Cell Zero | 31.5 | 2.10 | 0.0 | 0.012 |
| 1500 Cycles Linear | 27.2 | 2.65 | 4.8 | 0.018 |
| 3000 Cycles Pre Knee | 22.1 | 3.40 | 11.2 | 0.029 |
| 3800 Cycles Knee Point | 16.8 | 4.85 | 19.5 | 0.058 |
| 4500 Cycles Post Knee | 11.4 | 7.20 | 31.0 | 0.145 |
Constricted transport channels drive salt concentration near the current collector close to zero during rapid discharge, cutting capacity short before active materials fully deintercalate. Local overpotentials climb as a result, producing internal heat that speeds up secondary side reactions.

Electrolyte Consumption and Phase Starvation
Solvent molecules taken up by ongoing passivation reactions become permanently trapped in solid matrices. Typical commercial cells carry between 2.5 and 3.5 grams of liquid electrolyte per ampere-hour of nominal capacity. As interphase thickening drains this solvent, dry spots form inside the separator and inner electrode layers.
This electrolyte starvation raises high-frequency ohmic resistance and prevents full wetting of internal graphite particles, effectively isolating clusters from the ionic circuit.
Misjudging electrolyte consumption rates risks sudden thermal runaway during fast charging, as internal resistance can spike unexpectedly.


Trajectory
Mapping degradation mathematically requires breaking down voltage profiles to separate individual aging mechanisms. Differential voltage and incremental capacity analyses turn flat voltage plateaus into sharp, distinct peaks that track active material loss independently from inventory depletion. In fresh iron phosphate cells, incremental capacity curves show clear peaks matching concurrent two-phase transitions in both electrodes.

Differential Voltage Signature Tracking
Differential voltage curves plot dV/dQ against total discharge capacity. The distance between the cathode and anode phase transition peaks directly reflects cyclable lithium content. Through the linear aging phase, these peaks move together at 0.005 to 0.012 ampere-hours per hundred cycles under standard conditions.
Near the knee point, the anode peak disappears from the operational window altogether, signaling full depletion of cyclable inventory across lower staging regions.
- Differential capacity evaluation tracks the movement of graphite staging peaks relative to the flat cathode potential plateau.
- Electrochemical impedance spectroscopy captures high-frequency ohmic shifts together with mid-frequency charge-transfer expansion.
- Nonlinear regression modeling fits coupled kinetic and transport degradation equations to pinpoint knee point onset.
IEC 62620 requires end-of-life testing to declare nominal capacity retention before nonlinear roll-off invalidates performance guarantees.

Quantification Model Equations
Quantifying degradation accurately requires coupling kinetic inventory loss with transport limitations. Total capacity fade follows a formulation where capacity equals the smaller of remaining inventory and transport-limited storage:
Q(t) = min( Q_ini – k_sei t^(0.5) – k_par t , Q_act(1 – delta_transport(t)) )
Here Q_ini represents initial cell capacity, k_sei is the parabolic rate constant for diffusion-limited interphase growth, k_par is the linear solvent reduction rate constant, Q_act is remaining active capacity, and delta_transport is a penalty term for porosity loss and electrolyte depletion. Once inventory loss drops mobile lithium below the threshold for graphite to accept charge without severe overpotential, delta_transport shoots up exponentially, creating the steep nonlinear knee cliff.
| Operating Temperature Celsius | Parabolic Rate k sei Ah per h0.5 | Linear Rate k par Ah per h | Knee Onset Cycle Count | Post Knee Slope Ah per Cycle |
|---|---|---|---|---|
| 15 | 0.0018 | 0.00002 | 5200 | 0.0042 |
| 25 | 0.0026 | 0.00005 | 4100 | 0.0068 |
| 35 | 0.0041 | 0.00012 | 2800 | 0.0115 |
| 45 | 0.0075 | 0.00029 | 1650 | 0.0240 |
| Values calculated for 100 Ah prismatic cells under 0.5C charge and 1.0C discharge continuous cycling. | ||||
Cycle life contracts routinely specify testing under standardized IEC 62660-1 conditions so warranty thresholds trigger before nonlinear knee onset occurs.


Plating
Metallic lithium deposition becomes the main secondary failure mode once interphase growth pushes anode overpotential past thermodynamic limits. On charge, local graphite potential drops below zero volts versus lithium metal whenever charge transfer and solid-state diffusion resistance eat up the remaining overpotential margin. This happens mostly at high states of charge near the separator-anode boundary, where local current density peaks.
Does Overhang Lithium Exchange Mask Active Inventory Loss?
Graphite anodes extend 0.5 to 2.0 millimeters past cathode edges to prevent edge plating from alignment tolerances during assembly. This overhang acts as a passive lithium reservoir. Under extended storage or slow cycling, lithium slowly diffuses into the inactive overhang graphite, mimicking irreversible capacity loss.
During fast cycling, that stored lithium migrates back into the active electrode, temporarily buffering inventory loss and pushing knee point detection artificially later in qualification testing.
- Metallic dendrite formation starts at local spots where high current density pushes anode potential below zero volts.
- Dead lithium generation occurs when stripping electrically detaches metallic deposits from the conductive graphite matrix.
- Electrolyte reaction acceleration rapidly drains solvent through direct contact with newly exposed, high-surface-area metal.
- Porosity choke closure clogs separator pores as dead lithium and decomposition products agglomerate.
A fifty millivolt negative excursion at the anode interface initiates metallic deposition within five charge cycles.
Plated metallic lithium reacts exothermically with liquid organic carbonates, forming a secondary porous film that drains even more cyclable lithium. Once this self-reinforcing loop takes hold, capacity retention can drop by five to ten percent in fewer than two hundred cycles.
Accelerated capacity fade at high cycle numbers is frequently attributed to operation outside approved thermal windows.


Amortization
Depreciation schedules for commercial energy storage depend heavily on when nonlinear knee fade sets in. If project models assume steady linear loss over fifteen years, an unexpected knee at year seven can double actual lifecycle asset costs. Financial modeling relies on precise tracking of this degradation curvature to calculate the true levelized cost of storage.
Worked Financial Impact Analysis
Take a utility-scale installation with 100 megawatt-hours of iron phosphate storage, bought at 110 dollars per kilowatt-hour for a total capital cost of 11,000,000 dollars. Assuming a ten-year design life at one full cycle daily (3,650 cycles), a steady linear fade of 0.0055 percent per cycle leaves eighty percent nominal capacity at cycle 3,636 ~ aligning cleanly with debt repayment schedules.
If average operating temperature climbs to thirty-eight degrees Celsius, interphase growth speeds up. Accelerated inventory loss and porosity drop bring the knee point forward to cycle 2,400 at seventy-eight percent retention. From there, capacity drops at 0.045 percent per cycle, hitting sixty-five percent by cycle 2,690.
Augmentation comes three years earlier than planned. Between procurement, transport, labor, and downtime, early cell replacement adds 4,850,000 dollars in unbudgeted expense.
Embedding electrochemical knee prediction models into battery management firmware enables operators to adjust charge rates dynamically before anode overpotentials reach critical thresholds, protecting book value over the full planned asset life.