Bio-Derived Hard Carbon Anodes for Sodium-Ion Batteries
Bio-derived hard carbon performance depends on biopolymer ratio selection, acid demineralization, controlled carbonization temperatures, and surface passivation to maximize low-potential plateau capacity while maintaining high initial Coulombic efficiency.
Feedstock
The biomass precursor chosen for sodium-ion hard carbon anodes largely dictates the material’s crystallographic lattice and final pore morphology. That selection sets the baseline ratio of cellulose, hemicellulose, and lignin in the raw feed. Linear beta-1,4-glucan chains in cellulose break down rapidly between 300 °C and 400 °C, releasing volatile oxygenates and light tars.
Hemicellulose ~ composed of branched xylose, arabinose, and galactose heteropolymers ~ devolatilizes earlier, between 200 °C and 350 °C. Lignin, however, forms a dense 3D aromatic network from p-coumaryl, coniferyl, and sinapyl alcohol units. Its phenolic structure resists complete thermal breakdown up to 900 °C, leaving a carbonaceous residue rich in disordered turbostratic domains. Differences in these biopolymer ratios across coconut shells, hardwood residues, nutshells, and agricultural wastes like sugarcane bagasse or apple pomace directly shape carbon yield and structural ordering after firing.
Lignin-dense biomass yields more solid carbon and limits the alignment of parallel graphene sheets during high-temperature carbonization. Coconut shell typically contains 30 wt% to 40 wt% lignin alongside roughly 35 wt% cellulose. Pyrolyzing this blend produces a non-graphitizing hard carbon characterized by cross-linked sp3 networks and randomly oriented sp2 domains.
Refined carbohydrates such as sucrose, starch, and glucose produce exceptionally pure carbons, but their per-kilogram cost runs far higher than agricultural or forestry residues. Precursor chemistry across regional coconut shell sources directly shapes electrochemical capacity. Ultimately, precursor composition defines the baseline boundary for both reversible sodium storage capacity and initial Coulombic efficiency.
Naturally occurring heteroatoms in biomass serve as in-situ dopants during thermal treatment. Nitrogen, oxygen, sulfur, and phosphorus bound within cell walls alter the electronic structure of the carbon matrix. Native nitrogen levels between 0.5 wt% and 2.0 wt% enhance electrical conductivity by contributing electron density to the pi-conjugated network, while generating defect sites that accept sodium ions along the sloping portion of the discharge curve.
Matrix oxygen forms ether, carbonyl, and hydroxyl groups, though excessive residual oxygen raises irreversible capacity loss through parasitic electrolyte reactions during solid electrolyte interphase formation. Phosphorus self-doping widens the interlayer spacing between turbostratic sheets, lowering the kinetic barrier for sodium diffusion into the bulk.
Inorganic impurities present in raw biomass complicate cell electrochemistry. Plants pull silica, potassium, calcium, sodium, magnesium, and iron directly from soil. Agricultural residues like rice husk frequently carry silica contents above 15 wt% of total dry mass, whereas coconut shells usually stay below 1.5 wt% total ash.
Without aggressive acid demineralization, these minerals remain embedded in the carbon matrix. Alkali metals lower the thermal decomposition threshold of the biopolymers, causing uncontrolled pore collapse during early devolatilization. Trace iron acts as a localized graphitization catalyst at elevated temperatures, forming micro-crystalline graphitic pockets that suppress sodium storage capacity.
Coconut shell precursors yielding hard carbon with 1.4 wt% native nitrogen reach 330 mAh/g reversible capacity at C/10, provided initial oxygen content remains above 12 wt% before carbonization.
Procuring biomass for battery-grade hard carbon requires strict controls on source origin and harvest timing. Soil composition, local weather, fertilization, and harvest schedules introduce chemical variance between lots. Single-species wood chips from forestry operations provide reliable lignin-to-cellulose ratios, whereas municipal green waste fluctuates too much across batches.
Incoming moisture directly affects transport freight and thermal efficiency; moisture above 15 wt% demands a dedicated drying stage prior to pre-carbonization. Uniform particle sizing before primary heating is equally necessary to prevent core-to-surface thermal gradients during bulk firing.
| Biomass Precursor | Lignin (wt%) | Cellulose (wt%) | Ash Content (wt%) | Silica Content (wt%) | Native Heteroatoms |
|---|---|---|---|---|---|
| Coconut Shell | 32 – 38 | 34 – 38 | 0.8 – 1.5 | 0.1 – 0.3 | N, O |
| Sugarcane Bagasse | 18 – 24 | 42 – 50 | 2.5 – 4.5 | 1.2 – 2.2 | O, P |
| Pine Wood Flour | 26 – 32 | 40 – 45 | 0.3 – 0.8 | 0.05 – 0.15 | O |
| Rice Husk | 16 – 22 | 28 – 36 | 14.0 – 20.0 | 12.0 – 17.5 | N, O, S |
| Walnut Shell | 30 – 36 | 25 – 30 | 1.0 – 1.8 | 0.2 – 0.5 | N, O |
Precursor selection sets the boundary for final structural ordering.
Converting biomass into battery-grade hard carbon requires balancing raw material pricing against downstream purification costs. Low-cost agricultural wastes often carry heavy mineral loads that require intensive acid washing, offsetting initial savings on feedstock. High-purity forestry residues and coconut shell charcoal command higher purchase prices, but their lower impurity levels streamline subsequent chemical and thermal processing.
Typical procurement specifications enforce strict limits on ash and moisture alongside verified biopolymer ranges prior to dispatch. Supply audits prioritize seasonal batch consistency and covered storage to prevent fungal breakdown of cellulose before kiln loading.
Elevated ash levels often stem from seasonal soil contamination in the harvesting zone rather than insufficient acid washing during primary processing.
Pyrolysis
Thermal conversion of biopolymers into disordered hard carbon generally follows a two-stage heating schedule. The initial phase, pre-carbonization, runs between 200 °C and 400 °C under an inert gas sweep or oxygen-restricted conditions. Light volatiles ~ free and bound moisture, acetic acid, methanol, and furfural derivatives ~ evaporate during this step.
Concurrently, cross-linking reactions occur along the polymer backbone, stabilizing the aromatic network against excessive melting or swelling. Bleeding controlled air into this window introduces oxygen cross-links as ether bridges between adjacent phenolic rings, improving solid carbon yield and mitigating localized graphitization during subsequent high-temperature treatment.
High-temperature carbonization takes place between 1000 °C and 1400 °C under continuous argon or nitrogen flow. During this stage, residual non-carbon species like hydrogen, oxygen, and nitrogen evolve as water, carbon monoxide, carbon dioxide, methane, and hydrogen. The remaining carbon reorganizes into small, short-range graphene domains roughly 1 to 3 nanometers across.
Cross-linked sp3 bonds prevent these domains from aligning into graphite sheets, preserving a turbostratic structure with expanded interlayer spacing and enclosed internal micropores.
How Does Pretreatment Alter Ash Composition?
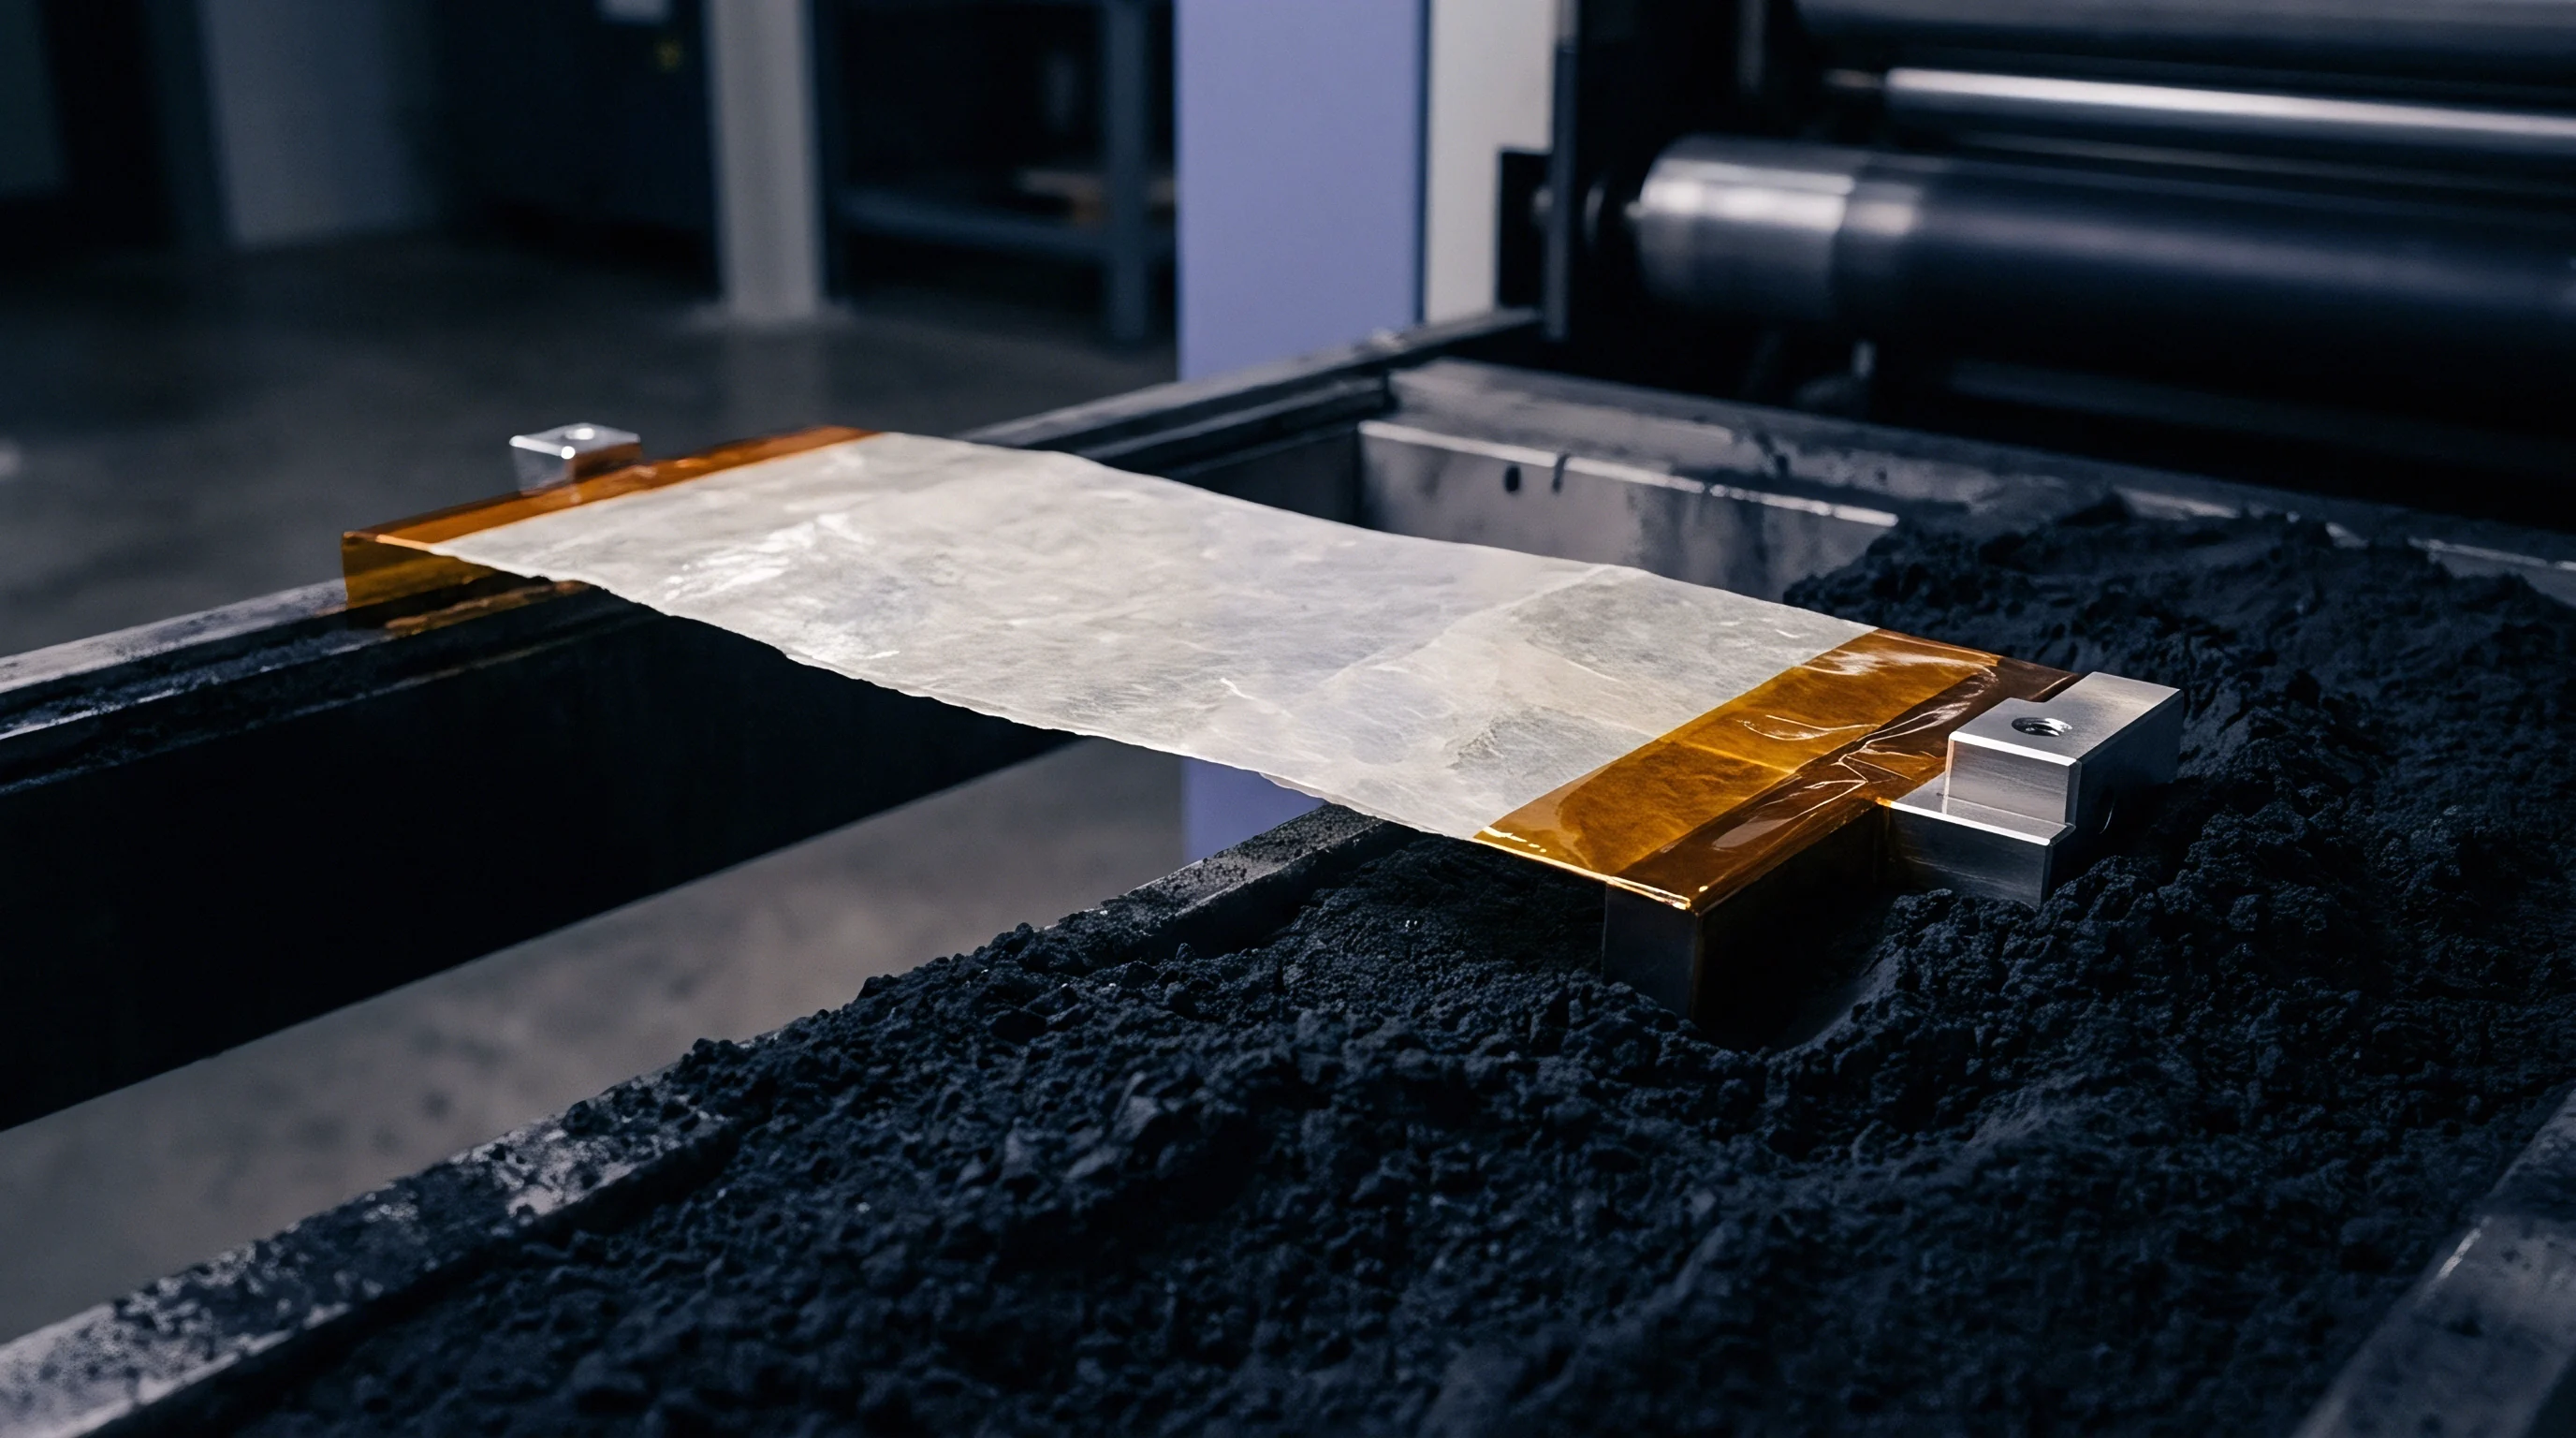
Chemical pretreatment prior to final firing influences both structural evolution and mineral retention. Washing raw biomass in mild acid or ammonium salt solutions leaches alkali metals that would otherwise catalyze graphitization or promote pore collapse at peak temperatures. Reagents such as phosphoric acid or zinc chloride function as dehydrating catalysts during pre-carbonization, encouraging lower-temperature aromatic condensation while developing microporosity.
Because sodium-ion hard carbons rely on closed internal pores, aggressive chemical activation compromises target packing densities. Demineralization routes that strip impurities without expanding open surface area produce materials with substantially higher initial Coulombic efficiency.
Peak carbonization temperature controls the tradeoff between d-spacing and closed pore volume. Pyrolysis at 1000 °C leaves high densities of lattice defects, edge sites, and surface oxygen groups, resulting in elevated sloping capacity but pulling initial Coulombic efficiency below 75%. Raising the peak to 1300 °C anneals defects, expels remaining oxygenates, and closes surface pores, lifting initial Coulombic efficiency above 88%.
Exceeding 1400 °C induces localized graphitization, compressing graphene interlayer spacing below 0.36 nanometers and collapsing internal micropores, which reduces overall storage capacity.
- Over-graphitization occurs when localized peak temperatures exceed 1400 °C, collapsing turbostratic domains into parallel graphite-like sheets that impede sodium intercalation.
- Runaway microporosity results from aggressive steam or chemical activation, generating high open surface area that consumes electrolyte and depresses initial Coulombic efficiency.
- Residual functionalization remains when peak carbonization stays below 900 °C, leaving surface oxygen groups that react irreversibly with sodium ions during initial formation cycles.
- Surface domain alignment develops under insufficient gas flow rates during thermal decomposition, allowing heavy volatile tars to redeposit on particle surfaces as dense, non-porous graphitic skins.
- Thermal gradient cracking takes place when heating ramp rates exceed 10 °C per minute, causing rapid volatile outgassing that shatters precursor granules into non-uniform fragments.
Controlling furnace atmosphere inside rotary or pusher kilns directly governs batch consistency. Gas sweep velocities must remove volatile byproducts fast enough to prevent tar condensation on carbon surfaces. Recondensed tars form low-porosity, partially graphitized shells that block sodium access to internal micropores.
Continuous tumbling in rotary kilns provides uniform thermal contact throughout the powder bed and eliminates localized hot spots. Ramp rates through the outgassing zone are typically held between 2 °C and 5 °C per minute to prevent internal gas pressure from shattering precursor particles.
Cooling rates following the peak hold govern stress relaxation in the carbon lattice. Rapid quenching generates thermal strain and microcracks that connect closed internal pores to the exterior surface. This increases nitrogen-accessible surface area and elevates first-cycle capacity loss upon electrolyte contact.
Regulated cooling under inert gas to below 150 °C protects internal pore architecture and prevents spontaneous surface oxidation upon air exposure.
Higher carbonization temperatures trade low-potential plateau capacity for better first-cycle Coulombic efficiency.

Mechanisms
Sodium storage in bio-derived hard carbons proceeds through a multi-stage process evident in galvanostatic charge-discharge curves. The voltage profile separates into two distinct segments: a sloping region from open-circuit potential down to approximately 0.1 V versus Na/Na+, and a flat plateau extending from 0.1 V down to 0.001 V versus Na/Na+. Reversible capacities generally range from 280 mAh/g to 360 mAh/g, depending on precursor source, thermal history, and surface texture.
The proportion of surface defects, d-spacing, and closed pore volume determines the distribution of capacity between the slope and the plateau.
Sodium insertion is constrained by crystallographic dimensions and pore architecture. Wide-Angle X-ray Diffraction (WAXD) profiles display broad (002) and (100) reflections characteristic of turbostratic carbon. Calculated via Bragg’s Law from the (002) peak, interlayer spacing in functional bio-derived carbons falls between 0.37 and 0.40 nanometers.
This expanded d-spacing relative to graphite’s 0.335 nanometers accommodates the larger sodium ion radius (0.102 nm versus 0.076 nm for lithium). Spacings below 0.36 nanometers restrict intercalation due to steric hindrance and mechanical strain across graphene layers.
The sloping voltage region corresponds to sodium adsorption at surface defects, edge sites, heteroatoms, and disordered surface regions. These defect sites serve as electron acceptors, binding sodium ions via localized electrostatic interactions. While elevated defect density boosts slope capacity, it introduces voltage hysteresis between charge and discharge.
Adsorption follows fast kinetics, supporting good rate performance during high C-rate cycling. High defect concentrations, however, increase irreversible sodium consumption during solid electrolyte interphase (SEI) growth.
The low-voltage plateau reflects sodium intercalation between graphene layers combined with sodium pore-filling inside closed micropores. Small-Angle X-ray Scattering (SAXS) indicates these internal cavities span 0.5 to 2.0 nanometers across. They act as micro-cavities that host sodium in quasi-metallic clusters without prompting bulk sodium plating on particle surfaces.
Storage along this plateau occurs near the sodium deposition potential, providing high cell-level energy density but requiring tight voltage control during fast charging to suppress dendrite formation.
Electrochemical titration data illustrates this plateau capacity behavior.
Galvanostatic Intermittent Titration Technique (GITT) measurements reveal distinct kinetic regimes across the discharge cycle. Solid-state diffusion coefficients along the sloping region span 10^-9 to 10^-10 cm2/s, indicating rapid surface adsorption across exposed defect sites. Once potential enters the plateau, apparent diffusion coefficients drop to between 10^-11 and 10^-12 cm2/s.
This decrease reflects narrow pore bottlenecks leading into closed internal cavities and steric resistance within turbostratic interlayer channels.
| Carbonization Temp (°C) | Interlayer Spacing d002 (nm) | Closed Pore Volume (cm3/g) | Sloping Capacity (mAh/g) | Plateau Capacity (mAh/g) | Initial Coulombic Efficiency (%) |
|---|---|---|---|---|---|
| 1000 | 0.395 | 0.012 | 185 | 80 | 72.4 |
| 1100 | 0.388 | 0.028 | 150 | 135 | 81.2 |
| 1200 | 0.381 | 0.045 | 120 | 195 | 87.6 |
| 1300 | 0.374 | 0.052 | 95 | 225 | 91.3 |
| 1400 | 0.365 | 0.031 | 70 | 180 | 89.1 |
Raman spectroscopy tracks defect levels via the intensity ratio of the D-band (~1350 cm-1, disordered carbon) to the G-band (~1580 cm-1, in-plane sp2 vibrations). Hard carbons with ID/IG ratios between 1.0 and 1.3 contain high defect concentrations, corresponding to larger sloping capacities. Higher carbonization temperatures reduce the ID/IG ratio as defects anneal and sp2 domains expand.
This structural ordering curtails sloping capacity while lengthening the low-potential plateau, provided closed micropores have not collapsed.
Turbostratic domains with wider interlayer spacing favor low-potential sodium insertion without inducing lattice strain.
First-cycle SEI formation consumes a portion of the active sodium inventory. Organic carbonate electrolytes ~ such as ethylene carbonate/dimethyl carbonate or propylene carbonate with NaPF6 or NaFSI salts ~ decompose below 1.2 V versus Na/Na+. The resulting passivation layer contains sodium carbonate (Na2CO3), sodium oxide (Na2O), sodium fluoride (NaF), and organic alkyl carbonates.
Formulations containing NaFSI additives promote a thin, inorganic-rich SEI that suppresses ongoing electrolyte consumption and maintains capacity over extended cycling.
Whether quasi-metallic sodium clustering inside ultramicropores triggers localized dendrite nucleation under long-term sub-zero cycling remains unresolved across current post-mortem characterizations.
Impurity
Residual minerals in bio-derived carbons degrade cell stability and accelerate capacity fade. Species such as silica, alumina, iron oxides, calcium oxide, and potassium salts originate from soil uptake during plant growth. Silica locked inside particle walls acts as electrochemically inert mass, reducing specific capacity.
Dissolved calcium and potassium disrupt the electric double-layer structure in carbonate electrolytes and accelerate solvent decomposition. Free iron oxides reduce during initial formation charging into metallic iron micro-particles that can migrate across the separator, causing internal soft shorts and elevated self-discharge.
Demineralization relies on chemical leaching to extract inorganics prior to high-temperature firing. Washing biomass or pre-carbonized charcoal in hot hydrochloric acid (HCl) dissolves metal oxides and carbonates, while hydrofluoric acid (HF) converts insoluble silica (SiO2) into soluble hexafluorosilicic acid (H2SiF6). Removing acid residues requires multi-stage deionized water rinsing cascades to bring powder pH to neutral, generating acidic wastewater that requires neutralization before disposal.
Demineralization performance depends directly on thorough post-leach washing.
Acid washing introduces notable process complexity and cost. Raw biomass with 5 wt% ash can require up to three mass equivalents of concentrated acid per kilogram of dry carbon to drive residual ash below 0.1 wt%. Acid consumption, corrosion-resistant equipment maintenance, acid recovery, and effluent neutralization all add to operating costs.
Skipping chemical purification lowers capital requirements but produces carbon with initial Coulombic efficiencies under 70% and rapid capacity fade during high-temperature storage.
- Slurry digestion of raw charcoal in 10 wt% hydrochloric acid solution at 80 °C for two hours under continuous mechanical agitation to dissolve transit metals and alkali species.
- Primary vacuum filtration separating acid-leached carbon solids from metal-laden filtrate, followed by a secondary wash using 5 wt% hydrofluoric acid at room temperature to extract residual silica matrices.
- Multi-stage counter-current rinsing using deionized water until filtrate electrical conductivity drops below 10 microsiemens per centimeter and pH neutralizes between 6.5 and 7.5.
- Convective air drying of damp carbon cake at 110 °C for twelve hours to lower free water content below 1.0 wt% prior to high-temperature carbonization.
- Inductively Coupled Plasma Mass Spectrometry (ICP-MS) elemental analysis verifying total residual ash content remains below 500 parts per million with iron species below 20 parts per million.
Analytical testing verifies minimal impurity retention following the wash cycle.
Trace element screening on incoming carbon lots prevents manufacturing contamination. ICP-MS and XRF spectroscopy detect residual minerals at parts-per-million thresholds. Cell-grade specifications typically cap total ash under 0.05 wt%, iron under 20 ppm, silica under 100 ppm, and total alkali metals (Na + K + Ca) under 150 ppm.
Batches exceeding these limits induce pouch cell gassing through catalytic electrolyte decomposition during 60 °C storage tests.
Precursor batches exceeding 500 ppm iron contamination trigger automatic lot rejection under IEC 62660-2 incoming material standards to prevent micro-shorting risks.
Unchecked iron contamination leads directly to micro-shorts.
Processing unwashed bagasse carbon that degraded cycle life by thirty percent resulted in forty thousand dollars of unrecoverable cell teardown testing.

Scale
Coating bio-derived hard carbon powders onto current collectors requires controlling particle morphology, tap density, and surface chemistry. Hard carbons exhibit low tap densities ~ typically 0.3 to 0.6 g/cm3 compared to over 1.1 g/cm3 for synthetic graphite. This low packing density stems from internal closed pores and irregular shapes produced during milling.
Low-density powders occupy large volumes in slurry tanks, consume higher solvent ratios during mixing, and yield low-density coatings that constrain cell-level volumetric energy density.
A narrow particle size distribution reduces void space within the coated electrode layer. Jet milling paired with air classification provides controlled sizing, targeting a median diameter (D50) between 5 and 10 micrometers, with D10 kept above 1.5 micrometers and D90 under 22 micrometers. Fines below 1 micrometer inflate BET surface area, accelerating electrolyte consumption and lowering initial Coulombic efficiency.
Particles above 25 micrometers create surface defects during calendering that can puncture thin separators and cause short circuits.
Internal pore structure determines overall charge storage capacity.
Surface modification reduces open surface area while preserving internal closed cavities. Chemical Vapor Deposition (CVD) using methane, acetylene, or toluene between 800 °C and 1000 °C applies a smooth, amorphous carbon layer over the particle surface. Alternatively, pitch coating blends hard carbon with petroleum or coal tar pitch prior to secondary firing under inert gas.
Both routes seal surface-accessible micropores, lowering BET surface area from over 30 m2/g to under 5 m2/g, which significantly limits first-cycle SEI losses.
Slurry formulation requires binder systems suited to hard carbon surface chemistry. Aqueous binders using sodium carboxymethyl cellulose (CMC) and styrene-butadiene rubber (SBR) provide strong adhesion to non-polar carbon while eliminating N-Methyl-2-pyrrolidone (NMP) solvent handling. Hydrophilic carboxyl groups on CMC interact with surface oxygen on carbon particles, creating a stable suspension that resists settling during coating runs.
Target active mass loadings range from 5 to 12 mg/cm2, requiring tight slot-die control to keep coating thickness within plus or minus 1.5 percent across wide copper substrates.
| Coating Method | Final BET Surface Area (m2/g) | Tap Density (g/cm3) | Slurry Solid Content (wt%) | Active Mass Loading (mg/cm2) | Initial Coulombic Efficiency (%) |
|---|---|---|---|---|---|
| Uncoated Raw Powder | 35.2 | 0.38 | 32 | 6.5 | 74.2 |
| Liquid Pitch Coating (5 wt%) | 8.4 | 0.58 | 42 | 8.2 | 84.6 |
| Liquid Pitch Coating (10 wt%) | 3.1 | 0.72 | 48 | 9.8 | 89.4 |
| Acetylene CVD (850 °C) | 2.1 | 0.68 | 46 | 9.5 | 91.2 |
| Toluene CVD (950 °C) | 1.5 | 0.75 | 50 | 10.5 | 92.8 |
Electrode calendering requires precise roll pressures to avoid crushing particle structures. Excessive compression fractures closed internal pores, degrading low-voltage plateau capacity and exposing unpassivated carbon surfaces. Target coating densities for hard carbon anodes sit near 0.9 to 1.2 g/cm3, compared to 1.5 to 1.7 g/cm3 for lithium-ion graphite electrodes.
Calender rolls heated to between 60 °C and 90 °C soften the binder matrix, improving particle cohesion and foil adhesion without excessive mechanical load.
Slurry viscosity sets practical limits on electrode mass loading.
On-site audits of rotary kiln temperature profiles confirm thermal processing stability across twenty-ton production runs.
- Precursor Moisture Allowance caps total allowable free water at 8.0 wt% upon arrival at primary thermal processing plants to limit pre-carbonization energy penalties.
- Particle Size Monodispersity mandates D50 particle size retention within a tight 7.5 to 8.5 micrometer window with D90 strictly limited under 20.0 micrometers.
- Specific Surface Area Upper Ceiling restricts BET gas adsorption values below 3.0 m2/g following pitch or CVD surface passivating treatments.
- Slurry Rheology Tolerance sets Brookfield viscosity limits between 3000 and 5000 millipascal-seconds at a shear rate of 20 reciprocal seconds to ensure coating stability.
- Residual Volatiles Threshold dictates that total mass loss during thermal exposure up to 600 °C under nitrogen remains below 0.5 wt%.
Clause 14.2 of the procurement master agreement specifies that any variance in particle D50 exceeding plus or minus eight percent grants the buyer full right of return without restocking fees.

Freight
Precursor conversion yield dictates manufacturing economics. Raw biomass loses substantial mass during thermal treatment through moisture loss and devolatilization. Hard carbon yields from coconut shell charcoal generally range from 25 wt% to 35 wt% of dry precursor mass.
Sugarcane bagasse and pine wood flour yield lower solid recoveries, typically between 15 wt% and 22 wt%. Producing one metric ton of finished hard carbon powder requires processing three to six metric tons of raw agricultural feedstock, driving up freight and bulk handling overhead.
Landed material costs combine precursor procurement, ocean transport, chemical leaching inputs, kiln power consumption, and surface treatment gases. Battery-grade bio-derived hard carbon trades between $3,500 and $7,000 per metric ton delivered, compared to $4,500 to $8,000 per metric ton for synthetic graphite. Operating rotary kilns continuously at 1200 °C represents roughly 30 percent of total conversion costs, making local electricity or natural gas pricing central to regional plant economics.
The financial balance reflects these processing and energy inputs.
Overall material yield determines delivered powder economics.
Anode cost and cell energy density together determine delivered storage economics. Sodium-ion cells using bio-derived hard carbon anodes and transition metal oxide cathodes achieve 140 to 170 Wh/kg, compared to 160 to 210 Wh/kg for LFP cells. Lower gravimetric density translates to higher active material, foil, separator, and packaging mass per kilowatt-hour of delivered capacity.
Evaluating delivered cost per kilowatt-hour for a 50 MWh utility storage contract illustrates the chemistry tradeoffs. Bio-derived carbon with 330 mAh/g reversible capacity and 88% initial Coulombic efficiency was compared against a synthetic pitch hard carbon delivering 290 mAh/g capacity at 92% initial Coulombic efficiency. The bio-derived material landed at $4,200 per metric ton versus $6,800 per metric ton for synthetic, cutting anode material cost per cell by 28 percent.
Although the lower initial Coulombic efficiency required a 4 percent cathode mass compensation penalty during cell balancing, overall bill-of-materials cost fell by $6.40 per delivered kilowatt-hour using the bio-derived anode.
Hard carbon material costs represent twenty-two percent of total Na-ion cell bill-of-materials expense when precursor conversion yields drop below twenty percent.
Freight regulations dictate shipping classifications for bulk hard carbon powders and finished sodium-ion cells. Raw hard carbon powders with high surface areas present self-heating hazards under UN Class 4.2 rules, requiring hazardous goods packaging, desiccant packs, and temperature logging during transit. Passivated carbons with BET surface areas below 5 m2/g satisfy self-heating safety criteria, shipping via standard freight containers as non-hazardous cargo.
Completed sodium-ion cells must clear UN 38.3 transport testing ~ encompassing thermal exposure, altitude, vibration, impact, and forced discharge ~ before receiving commercial air or ocean transport clearance.
Supply agreements for hard carbon anodes routinely incorporate price indexing tied to biomass commodity indexes and local power tariffs. Dual-sourcing strategies ~ pairing domestic forestry sources with overseas agricultural processors ~ mitigate single-origin supply disruptions. Qualification terms generally enforce audited sustainability metrics, including land-use history, supply chain carbon intensity, and acid wastewater management.
Ultimately, procurement balances raw material cost savings against cell performance, cycle life, and regulatory compliance.