Calcination Energy Tariffs and Synthetic Graphite Price Compression Mechanics
Industrial electricity tariffs dictate over fifty percent of synthetic graphite production costs, driving price compression down toward natural graphite parity.
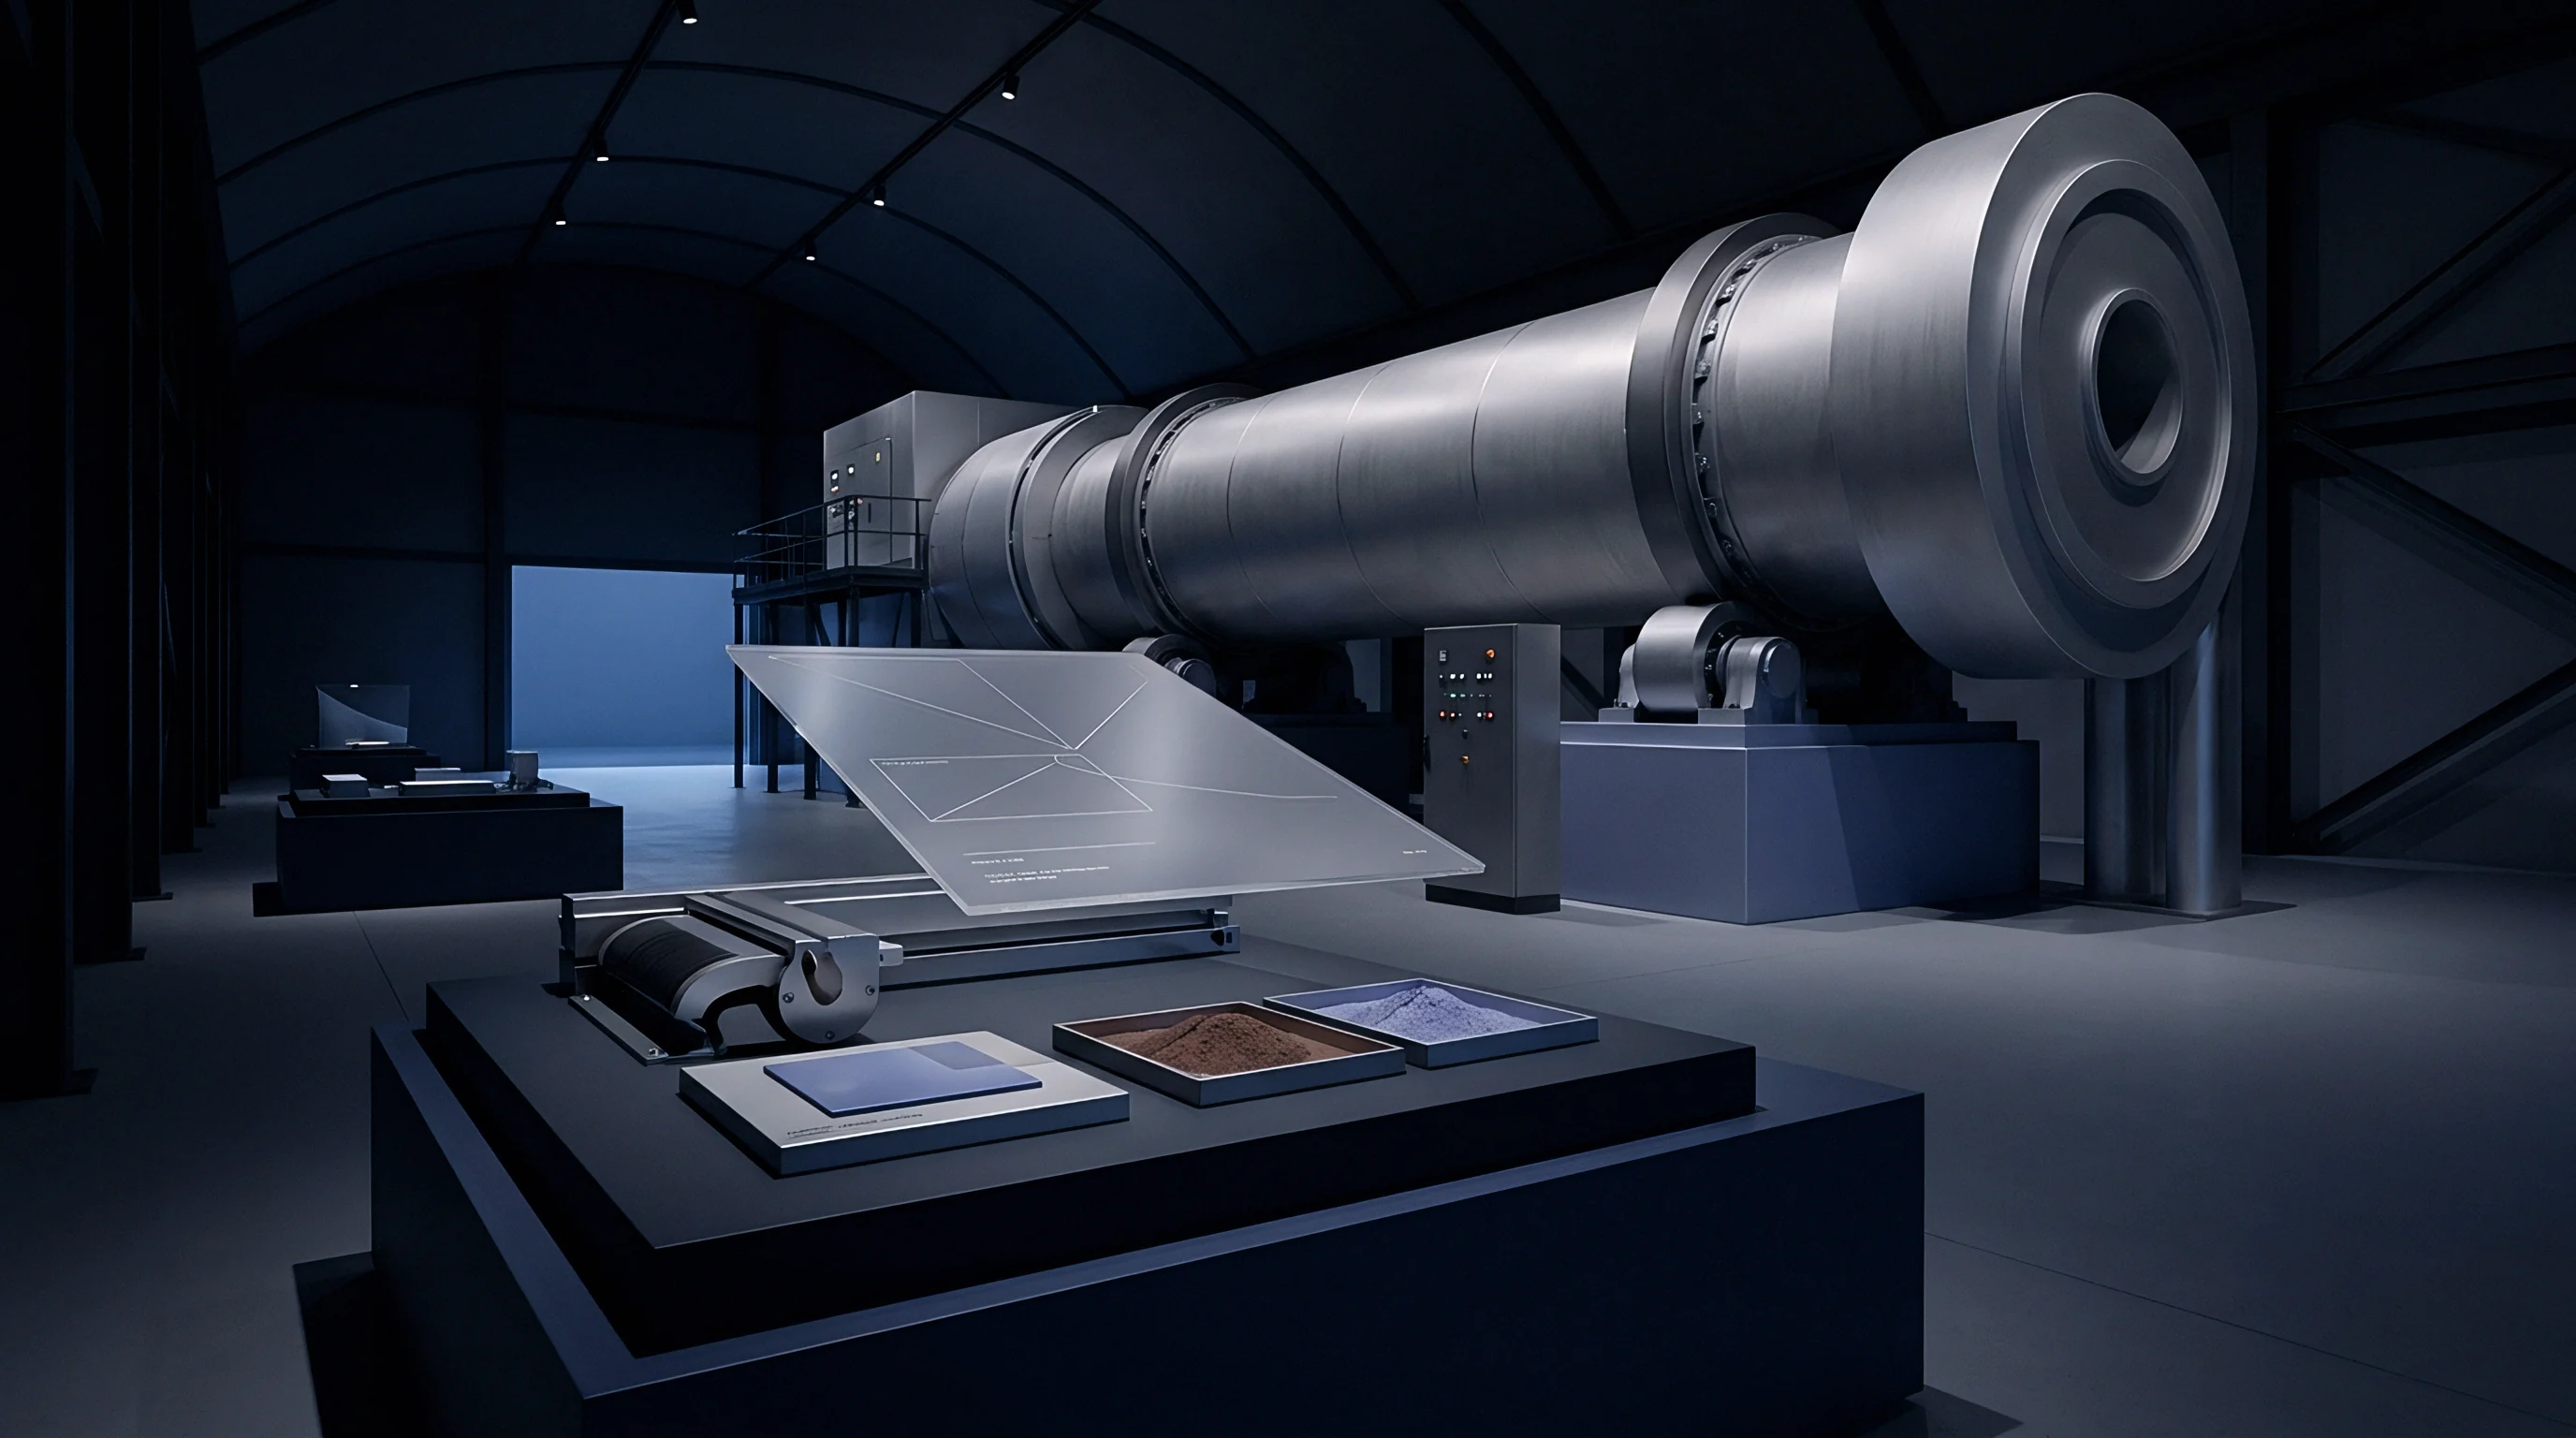
Kiln
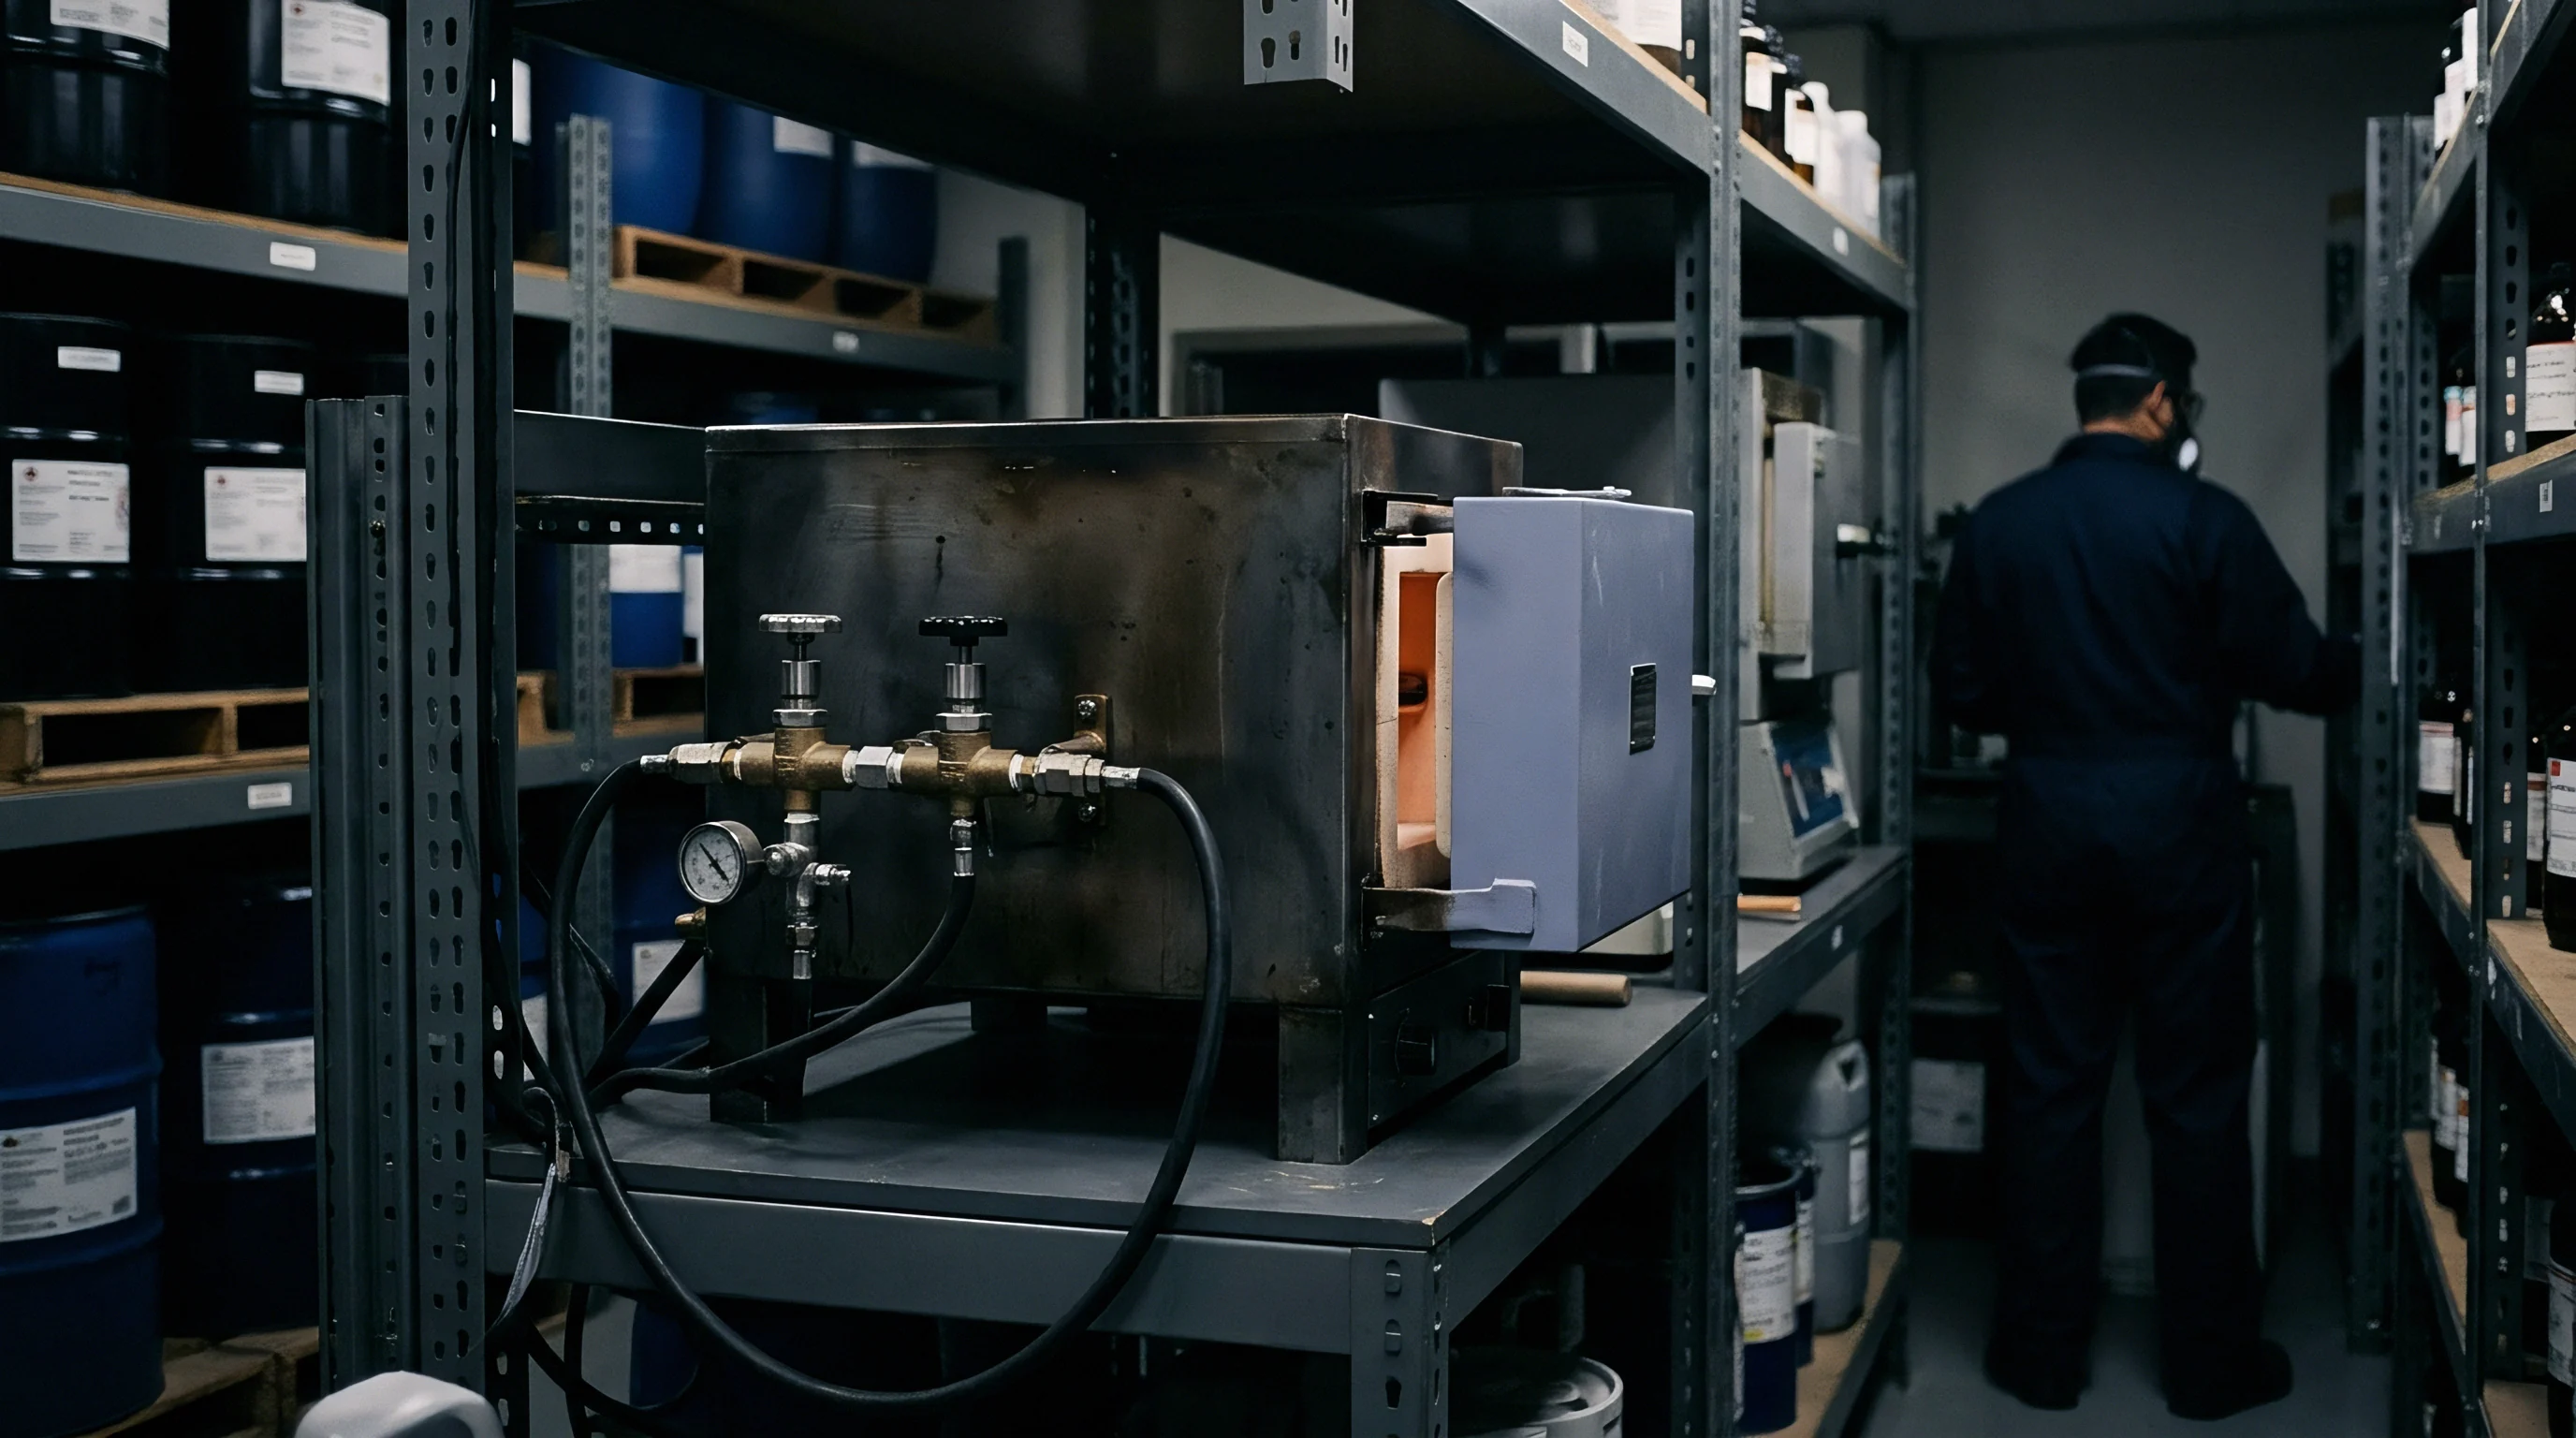
Calcining raw petroleum coke in rotary kilns between 1200°C and 1400°C removes volatile organic compounds and moisture, cutting mass by 15% to 22% while raising real density from 1.30 g/cm³ to roughly 2.08 g/cm³. The resulting calcined petroleum coke is the primary precursor for synthetic graphite anodes. Converting this carbon into three-dimensionally ordered crystalline graphite takes a second, far more energy-intensive thermal treatment: graphitization at 2800°C to 3000°C. At these extreme temperatures, amorphous carbon hexagonal sheets align into ordered AB-stacked graphene layers, pulling the interlayer spacing down toward the theoretical 0.3354 nm ideal.
Thermal Budgets in Anode Material Conversion
Converting raw feedstocks into battery-ready anode active material requires heavy energy inputs at every thermal stage, with graphitization accounting for most of the overall power budget. Traditional Acheson batch furnaces pass electrical current directly through a resistive bed of carbon material and packing media, consuming between 10,000 kWh and 13,000 kWh per metric tonne of finished graphitized material. Longitudinal graphitization (LWG) systems connect carbon rods end-to-end so the load acts as its own heating element, optimizing current distribution and lowering specific power consumption to 7,500 kWh to 9,000 kWh per tonne.
Continuous graphitization systems trim thermal cycling losses even further, dropping energy use below 6,000 kWh per tonne, though usually by reducing residence time at peak temperature.
Because graphitization’s specific power demand sets the operational cost floor, energy consumption remains the single largest variable cost in synthetic graphite production. When calcination thermal efficiency falls off, residual volatile matter stays trapped inside the coke matrix, creating structural voids and lowering tap density in the finished anode product.
| Process Stage | Furnace Configuration | Operating Temperature (°C) | Specific Energy Use (kWh/t) | Yield Retention (%) |
|---|---|---|---|---|
| Petroleum Coke Calcination | Rotary Kiln | 1200 – 1400 | 800 – 1,200 | 78 – 85 |
| Batch Graphitization | Acheson Resistance | 2800 – 3000 | 10,000 – 13,000 | 85 – 90 |
| Longitudinal Graphitization | LWG System | 2800 – 3000 | 7,500 – 9,000 | 88 – 93 |
| Continuous Graphitization | Vertical Reactor | 2600 – 2800 | 5,000 – 6,500 | 92 – 96 |
Thermal inputs during calcination and graphitization shape the resulting crystal structure, directly affecting electrochemical performance. Standard pitch needle coke demands higher peak graphitization temperatures to achieve structural order than isotropic needle coke, shifting the power budget per batch. Insufficient heating leaves incomplete carbon alignment, resulting in a residual d002 lattice spacing above 0.3365 nm.
That structural distortion lowers initial coulombic efficiency during the first lithiation cycle, as disordered edge sites consume active lithium ions to build an excessively thick solid electrolyte interphase layer.
Optimizing the thermal budget requires balancing power draw against structural ordering depth. Holding carbon at peak temperature beyond the point of full crystalline saturation wastes electricity without adding reversible capacity, raising landed material costs without yielding electrochemical benefit.
Grid
Industrial power rates account for more than fifty percent of the total transformation cost for synthetic battery-grade carbon. Regional energy policies and power generation mixes drive substantial variance in utility tariffs across manufacturing hubs. Coal-heavy grids historically offered flat baseline rates, whereas hydro-dependent grids enforce seasonal tariff structures where summer wet seasons cut power costs by up to forty percent relative to winter dry periods.
These dynamic utility cost profiles induce cyclical shifts in synthetic graphite output and tolling charges.
Utility Tariffs and Tolling Price Dynamics
Power tariffs for heavy industrial consumers rely on multi-tiered pricing frameworks. Base capacity charges favor high capacity factors, while time-of-use tariffs penalize electrical consumption during peak grid demand windows. Because Acheson and LWG graphitization systems run continuously over multi-day firing cycles, facilities cannot trim power during peak tariff periods without risking severe thermal shock damage to furnace linings and target materials.
LWG graphitization at 8,500 kWh per tonne under a 0.055 USD per kWh tariff establishes a net electrical energy cost floor of 467.50 USD per metric tonne of processing output.
Government mandates targeting carbon intensity and industrial power quotas directly alter facility operations. Dual-control energy rules impose strict caps on total megawatt-hour consumption per plant, forcing producers in high-tariff jurisdictions to cut output or shift production toward regions with surplus renewable energy capacity. Grid stability is just as critical: high-voltage supply interruptions disrupt thermal profiles, causing uneven heat distribution across the furnace core that yields mixed batch crystallinities and out-of-spec material.
Industrial tariff structures directly dictate regional graphitization fees through specific mechanisms:
- Tiered Industrial Tariffs impose escalating unit costs when monthly megawatt-hour consumption thresholds are exceeded, capping maximum economical throughput per furnace line.
- Time-of-Use Off-Peak Rates allow flexible processing units to schedule initial pre-heating phases during overnight low-demand hours to reduce total billing.
- Hydroelectric Seasonal Surcharges increase unit electricity costs during dry winter months, raising graphitization tolling fees by 100 USD to 200 USD per metric tonne.
- Carbon Emission Tariffs apply direct penalties to direct coal-fired power inputs, favoring facilities connected directly to low-carbon generation assets.
Failing to account for regional energy tariff fluctuations when negotiating multi-year supply contracts leaves battery manufacturers exposed to sudden tolling surcharge pass-throughs. When regional utilities adjust industrial power rates or revoke energy subsidies, graphitization operators immediately shift these cost increases onto off-takers via contractual energy indexation clauses. Uncapped exposure to regional power grids turns a predictable anode supply line into a volatile cost liability.

Compression
Synthetic anode prices fell from historical highs above ten thousand dollars per metric tonne down toward three thousand dollars per tonne as regional processing fees dropped. A surge in continuous graphitization capacity, alongside reduced industrial electricity tariffs in major manufacturing provinces, collapsed graphitization tolling fees from over 2,800 USD per tonne to under 1,100 USD per tonne. This collapse compressed the traditional price premium of synthetic graphite over natural graphite, altering the economics of battery chemistry selection across automotive energy storage applications.
Worked Cost Sensitivity in Anode Tolling Operations
To analyze price compression dynamics, consider a standard batch of 40 metric tonnes of precursor needle coke subjected to longitudinal graphitization. Assume raw needle coke pricing sits at 900 USD per tonne delivered. Process mass loss during graphitization, purges, and screening totals 10%, requiring 1.11 tonnes of precursor per tonne of finished synthetic graphite.
At an energy consumption rate of 8,200 kWh per tonne of output, the local industrial electricity tariff directly dictates the baseline conversion cost. Sticking to a standard base tariff of 0.08 USD per kWh yields an electricity cost of 656 USD per tonne. Adding auxiliary processing costs, including labor, furnace packing media consumption, equipment depreciation, and nitrogen purging gases at 450 USD per tonne, sets the baseline operational production cost at 2,104.90 USD per tonne before facility margin.
Shifting the industrial electricity tariff down to a subsidized rate of 0.04 USD per kWh alters the cost equation. The electricity component drops from 656 USD to 328 USD per tonne, driving the total production cost down to 1,776.90 USD per tonne. Tolling contracts shift energy risk.
When regional energy oversupply forces power tariffs down, tolling service providers lower their fees to retain unit volumes, pushing spot market synthetic graphite pricing directly toward physical production cost floors.
| Anode Active Material Grade | Raw Precursor Cost (USD/t) | Processing Energy Cost (USD/t) | Total Production Cost (USD/t) | Historical Market Price (USD/t) | Compressed Market Price (USD/t) |
|---|---|---|---|---|---|
| High-Capacity Synthetic (Needle Coke) | 1,100 – 1,400 | 600 – 850 | 2,450 – 3,100 | 8,500 – 12,000 | 3,600 – 4,200 |
| Standard Commercial Synthetic (Pitch Coke) | 750 – 950 | 400 – 600 | 1,650 – 2,100 | 5,500 – 7,500 | 2,400 – 2,900 |
| Spherical Natural Graphite (Coated) | 800 – 1,100 | 150 – 300 | 1,400 – 1,800 | 4,000 – 5,500 | 2,100 – 2,600 |
| Uncoated Flake Natural Concentrate | 450 – 650 | 50 – 100 | 650 – 850 | 1,200 – 1,800 | 700 – 950 |
Natural graphite processing relies primarily on chemical or thermal purification, particle shaping, and pitch surface coating, consuming significantly less energy per tonne than synthetic graphitization. However, as synthetic graphitization fees decline, the landed cost gap between coated natural graphite and standard synthetic graphite narrows to less than 300 USD per metric tonne. Because synthetic graphite offers superior fast-charging capability, lower volumetric expansion during lithiation, and longer operational cycle life, cell manufacturers systematically replace natural graphite blends with 100% synthetic anode formulations when price compression brings the materials close to parity.
Supply contracts must lock graphitization tolling rates directly to public regional power indexes to prevent suppliers from pocketing utility cost reductions.
Lower graphitization fees are often treated as temporary fluctuations driven by seasonal grid curtailments, while long-term contract pricing is held near historical averages to cover capital expenditures for environmental compliance.


Grading
Electrochemical performance depends directly on the interlayer spacing and degree of graphitization achieved during heat treatment. Standard battery-grade synthetic graphite demands a degree of graphitization above 93%, corresponding to an interlayer d002 spacing of 0.3360 nm or less. When graphitization energy inputs are reduced to save costs, carbon structural ordering drops, yielding material with higher d002 lattice parameters, lower tap density, and compromised cycle life.
Does Continuous Graphitization Sacrifice Anode Cycle Life?
Continuous graphitization systems push carbon particles rapidly through high-temperature zones to maximize throughput and minimize specific kilowatt-hour consumption per tonne. Shortened thermal exposure limits the time available for amorphous carbon crystallites to grow and align into macro-ordered domain structures. While material processed this way meets basic reversible capacity targets of 350 mAh/g to 355 mAh/g, its lower structural homogeneity accelerates particle degradation during long-term electrochemical cycling.
Fast-processed synthetic graphite often exhibits irregular surface energetics and higher specific surface area (BET), which increases active lithium consumption during the first cycle. Under high-rate charging protocols, uneven crystalline orientation promotes localized lithium plating, accelerating capacity loss over extended cycling in pouch and prismatic cells.
- Verify raw material batch origin, securing certificates of analysis for uncalcined raw petroleum coke volatile content and sulfur concentration.
- Measure real density via helium pycnometry, confirming values exceed 2.23 g/cm³ to ensure adequate graphitization depth.
- Determine interlayer spacing d002 and crystallite size Lc using X-ray diffraction analysis under IEC 62805 standards.
- Evaluate Brunauer-Emmett-Teller specific surface area using multi-point nitrogen adsorption, ensuring values remain between 1.1 m²/g and 2.0 m²/g.
- Perform tap density testing according to ASTM B527, confirming particle packing density reaches at least 1.05 g/cm³ for high-density electrode formulations.
- Execute coin cell half-cell testing at 0.1C rate to establish first-cycle coulombic efficiency thresholds above 94.5%.
Integrating 5 wt% to 10 wt% silicon-based additives into compressed synthetic graphite structures mitigates capacity trade-offs but increases requirements for mechanical particle stability. Poorly graphitized synthetic matrix materials fail to accommodate silicon expansion stresses, causing electrode pulverization, rapid SEI layer breakdown, and premature cell end-of-life.
Anode materials processed with an interlayer spacing exceeding 0.3365 nm suffer rapid capacity degradation due to structural exfoliation during high-rate lithium intercalation.
Whether continuous graphitization can deliver the long-term lattice stability required for commercial automotive warranties exceeding eight years remains an open empirical question.
Receipt
Commercial agreements for anode materials increasingly incorporate floating electricity adjustment mechanisms to align purchase costs with regional utility billing. Purchasing contracts that fail to decouple raw material costs from energy transformation costs leave buyers paying fixed historical prices while graphitization providers capture windfall margins from declining power tariffs. Structural price compression mechanics mandate that cell procurement teams audit supplier utility bills, furnace energy consumption certificates, and power purchase agreements.
Commercial Verification and Contract Structuring
Anode supply agreements rely on multi-part pricing formulas that isolate precursor needle coke market costs, graphitization power costs, and supplier conversion margins. Contractual energy indexing formulas define exact specific energy conversion factors—such as specifying 8,000 kWh per metric tonne of graphitized output—multiplied against a transparent, publicly reported regional industrial electricity index. When regional power rates drop by 0.02 USD per kWh, the contract automatically reduces the landed anode material price by 160 USD per metric tonne.
Effective procurement protocols mandate incoming batch verification protocols alongside financial audits. Cell manufacturing plants receiving incoming synthetic graphite shipments conduct rigorous lot acceptance testing before releasing material to slurry preparation lines. Discrepancies between certified datasheet parameters and delivered material properties—such as lowered real density or elevated BET surface area—indicate that the graphitizer reduced peak furnace temperatures or shortened residence times to save energy.
Auditing graphitization facilities requires inspecting utility receipts and grid interconnect meter logs to verify that the energy consumed matches the tonnage of battery-grade material delivered. Discrepancies between total plant electrical draw and reported production volumes often reveal unannounced sub-contracting of graphitization to lower-tier batch kilns operating without adequate quality controls. Power cost reductions must pass through to the buyer while quality metrics remain strictly locked.
Graphitization energy indexation clauses protect procurement budgets when utility tariffs fluctuate, keeping synthetic graphite prices aligned with actual physical transformation costs.