Thermal Gap Filler Viscosity Shear Mechanics under Volume Dispensing
Shear-thinning gap filler viscosity drops under high dispense shear rates, requiring dynamic force control during module squeeze to prevent voids and structural cell damage.


Rheology
Highly filled non-Newtonian polymer systems thin aggressively under volumetric displacement. In electric vehicle battery packs, thermal gap fillers bridge microscopic air gaps between lithium-ion cell housings and liquid-cooled aluminum heat sinks. These compounds suspend dense ceramic particles in silicone, polyurethane, or acrylic matrix resins.
Fillers like aluminum oxide, aluminum trihydroxide, and boron nitride make up sixty to eighty-five percent of the total mixture mass, yielding bulk thermal conductivities between one point five and four point five Watts per meter-Kelvin. That heavy solids loading takes the fluid behavior well past simple linear viscous flow into complex non-Newtonian regimes dominated by yield stress, thixotropy, particle migration, and sharp drops in shear viscosity.
During dispensing, automated double-acting piston pumps push uncured filler through metering manifolds, flow meters, static mixing tubes, and narrow nozzles onto cold plates. Shear strain rates across standard dispensing equipment span from under one inverse second in large supply hoses to over ten thousand inverse seconds at the tightest nozzle restriction. The local shear rate and its resulting viscosity govern volumetric dosing accuracy, line pressure limits, bead stability, and the mechanical forces pushed onto cell casings during compression.

Shear Thinning Mechanics and Power Law Parameters
Under pressure, highly loaded thermal compounds drop from high zero-shear viscosity to much lower dynamic viscosity. At rest, the dense ceramic particles form a continuous network bound by weak Van der Waals forces and entangling polymer chains. This network resists deformation until driving pressure applies shear strain, breaking up the physical structure as filler particles align with flow streamlines and polymer chains uncoil.
Dynamic viscosity drops sharply with increasing shear rate, allowing heavy compounds to move through narrow lines without excessive pump pressure.
Across working strain rates, fluid shear response fits the Ostwald-de Waele power-law model, where shear stress equals the consistency index multiplied by shear strain rate raised to the power of the flow behavior index. For these pseudoplastic materials, the flow behavior index falls between zero point two and zero point five ~ lower numbers indicating sharper shear-thinning at high velocities. Incoming quality inspections measure shear viscosity across five orders of magnitude in strain rate to establish baseline power-law coefficients for process simulations.
Mapping the consistency index and flow behavior index from fifteen to forty-five degrees Celsius provides the core rheological data needed to size and control automated dispensing systems.
Thermal compound viscosity drops by up to two orders of magnitude as shear strain rate increases from ten to five thousand inverse seconds at twenty-five degrees Celsius.
Factory floor temperature shifts alter the consistency index while leaving the flow behavior index largely unchanged. Warmer material lowers matrix polymer viscosity, dropping the baseline pressure required to move material through supply lines. Colder ambient temperatures increase fluid resistance, pushing line pressures closer to pump relief limits.
Keeping volumetric metering units and supply barrels thermally controlled avoids these pressure swings during continuous production.

Yield Stress and Wall Slip Phenomenon
Filled elastomers act like solids until applied shear forces cross a critical threshold ~ the material’s yield stress, typically fifty to eight hundred Pascals depending on ceramic density and polymer formulation. Below this threshold, the compound deforms elastically without flowing. Once wall shear stress clears the yield stress, internal networks collapse and fluid flow begins.
This yield stress is what keeps dispensed filler beads from sagging or slumping on vertical cold plates prior to cell placement.
High solids loading causes wall slip against internal metal pipe surfaces during high-velocity extrusion. Instead of sticking cleanly to the wall as classical no-slip boundary models assume, a thin layer of un-filled polymer matrix forms at the pipe boundary. This low-viscosity film acts as a lubricant, allowing the dense core of filler material to slide through as a solid plug.
Wall slip alters theoretical velocity profiles, cutting expected total shear rates and noticeably lowering pressure drop through delivery hoses.
Measuring wall slip requires comparative testing with smooth and serrated parallel-plate geometries. Serrated plates grip the filled suspension to prevent boundary lubrication, capturing true bulk shear viscosity, while smooth plates measure apparent viscosity affected by slip. Automated dispensing algorithms built strictly on zero-slip fluid models underestimate actual flow rates by fifteen to thirty percent, causing pumps to over-pressurize lines while chasing uncorrected velocity targets.

Thixotropic Recovery and Viscoelastic Time Scales
Once dispensing stops at the nozzle tip, structural rebuilding determines material behavior inside the module cavity. The network of ceramic particles and uncoiled polymer chains does not instantly snap back to its rest state. Rebuilding takes time, governed by a thixotropic recovery time constant.
During this window, viscosity climbs gradually from its low dynamic value back toward the high zero-shear baseline.
These recovery kinetics set the allowable cycle window between bead deposition and cell compression. If modules press into the bead before structural rebuild completes, low dynamic viscosity lets the material spread quickly under low force. Waiting too long allows recovery to progress, driving up bulk viscosity and requiring far higher mechanical compression force to reach target bond line thickness.
Excess squeeze force can deform thin prismatic housings or damage pouch cell seals.
Small-amplitude oscillatory shear testing yields storage and loss moduli across frequency sweeps. Their ratio ~ the loss factor ~ shows whether viscous dissipation or elastic energy storage dominates during deformation. A dominant loss factor means stress relaxes quickly under strain, keeping residual mechanical forces from pressing back against battery modules once assembly clamping is locked.
| Base Matrix Chemistry | Filler Type | Thermal Conductivity (W/m·K) | Density (g/cm³) | Yield Stress (Pa) | Power-Law Index n | Zero-Shear Viscosity (Pa·s) |
|---|---|---|---|---|---|---|
| 1-Part Silicone | Alumina / ATH | 2.0 ± 0.2 | 2.6 ± 0.1 | 180 ± 25 | 0.32 ± 0.03 | 1200 ± 150 |
| 2-Part Silicone | Aluminum Oxide | 3.5 ± 0.3 | 3.1 ± 0.1 | 350 ± 40 | 0.26 ± 0.02 | 2800 ± 300 |
| 2-Part Polyurethane | Aluminum Oxide | 2.8 ± 0.2 | 2.8 ± 0.1 | 420 ± 50 | 0.28 ± 0.03 | 3100 ± 350 |
| 1-Part Acrylic | Boron Nitride / ATH | 1.8 ± 0.15 | 2.2 ± 0.1 | 120 ± 15 | 0.38 ± 0.04 | 850 ± 90 |
Balancing shear-thinning behavior against rest recovery is critical for stable production lines. Line takt times and pump pressure limits must be balanced by matching formulation chemistry directly to the dosing profile. Exactly how much micro-scale particle orientation during high-speed extrusion affects bulk thermal conductivity remains an open question in industrial development.


Nozzle
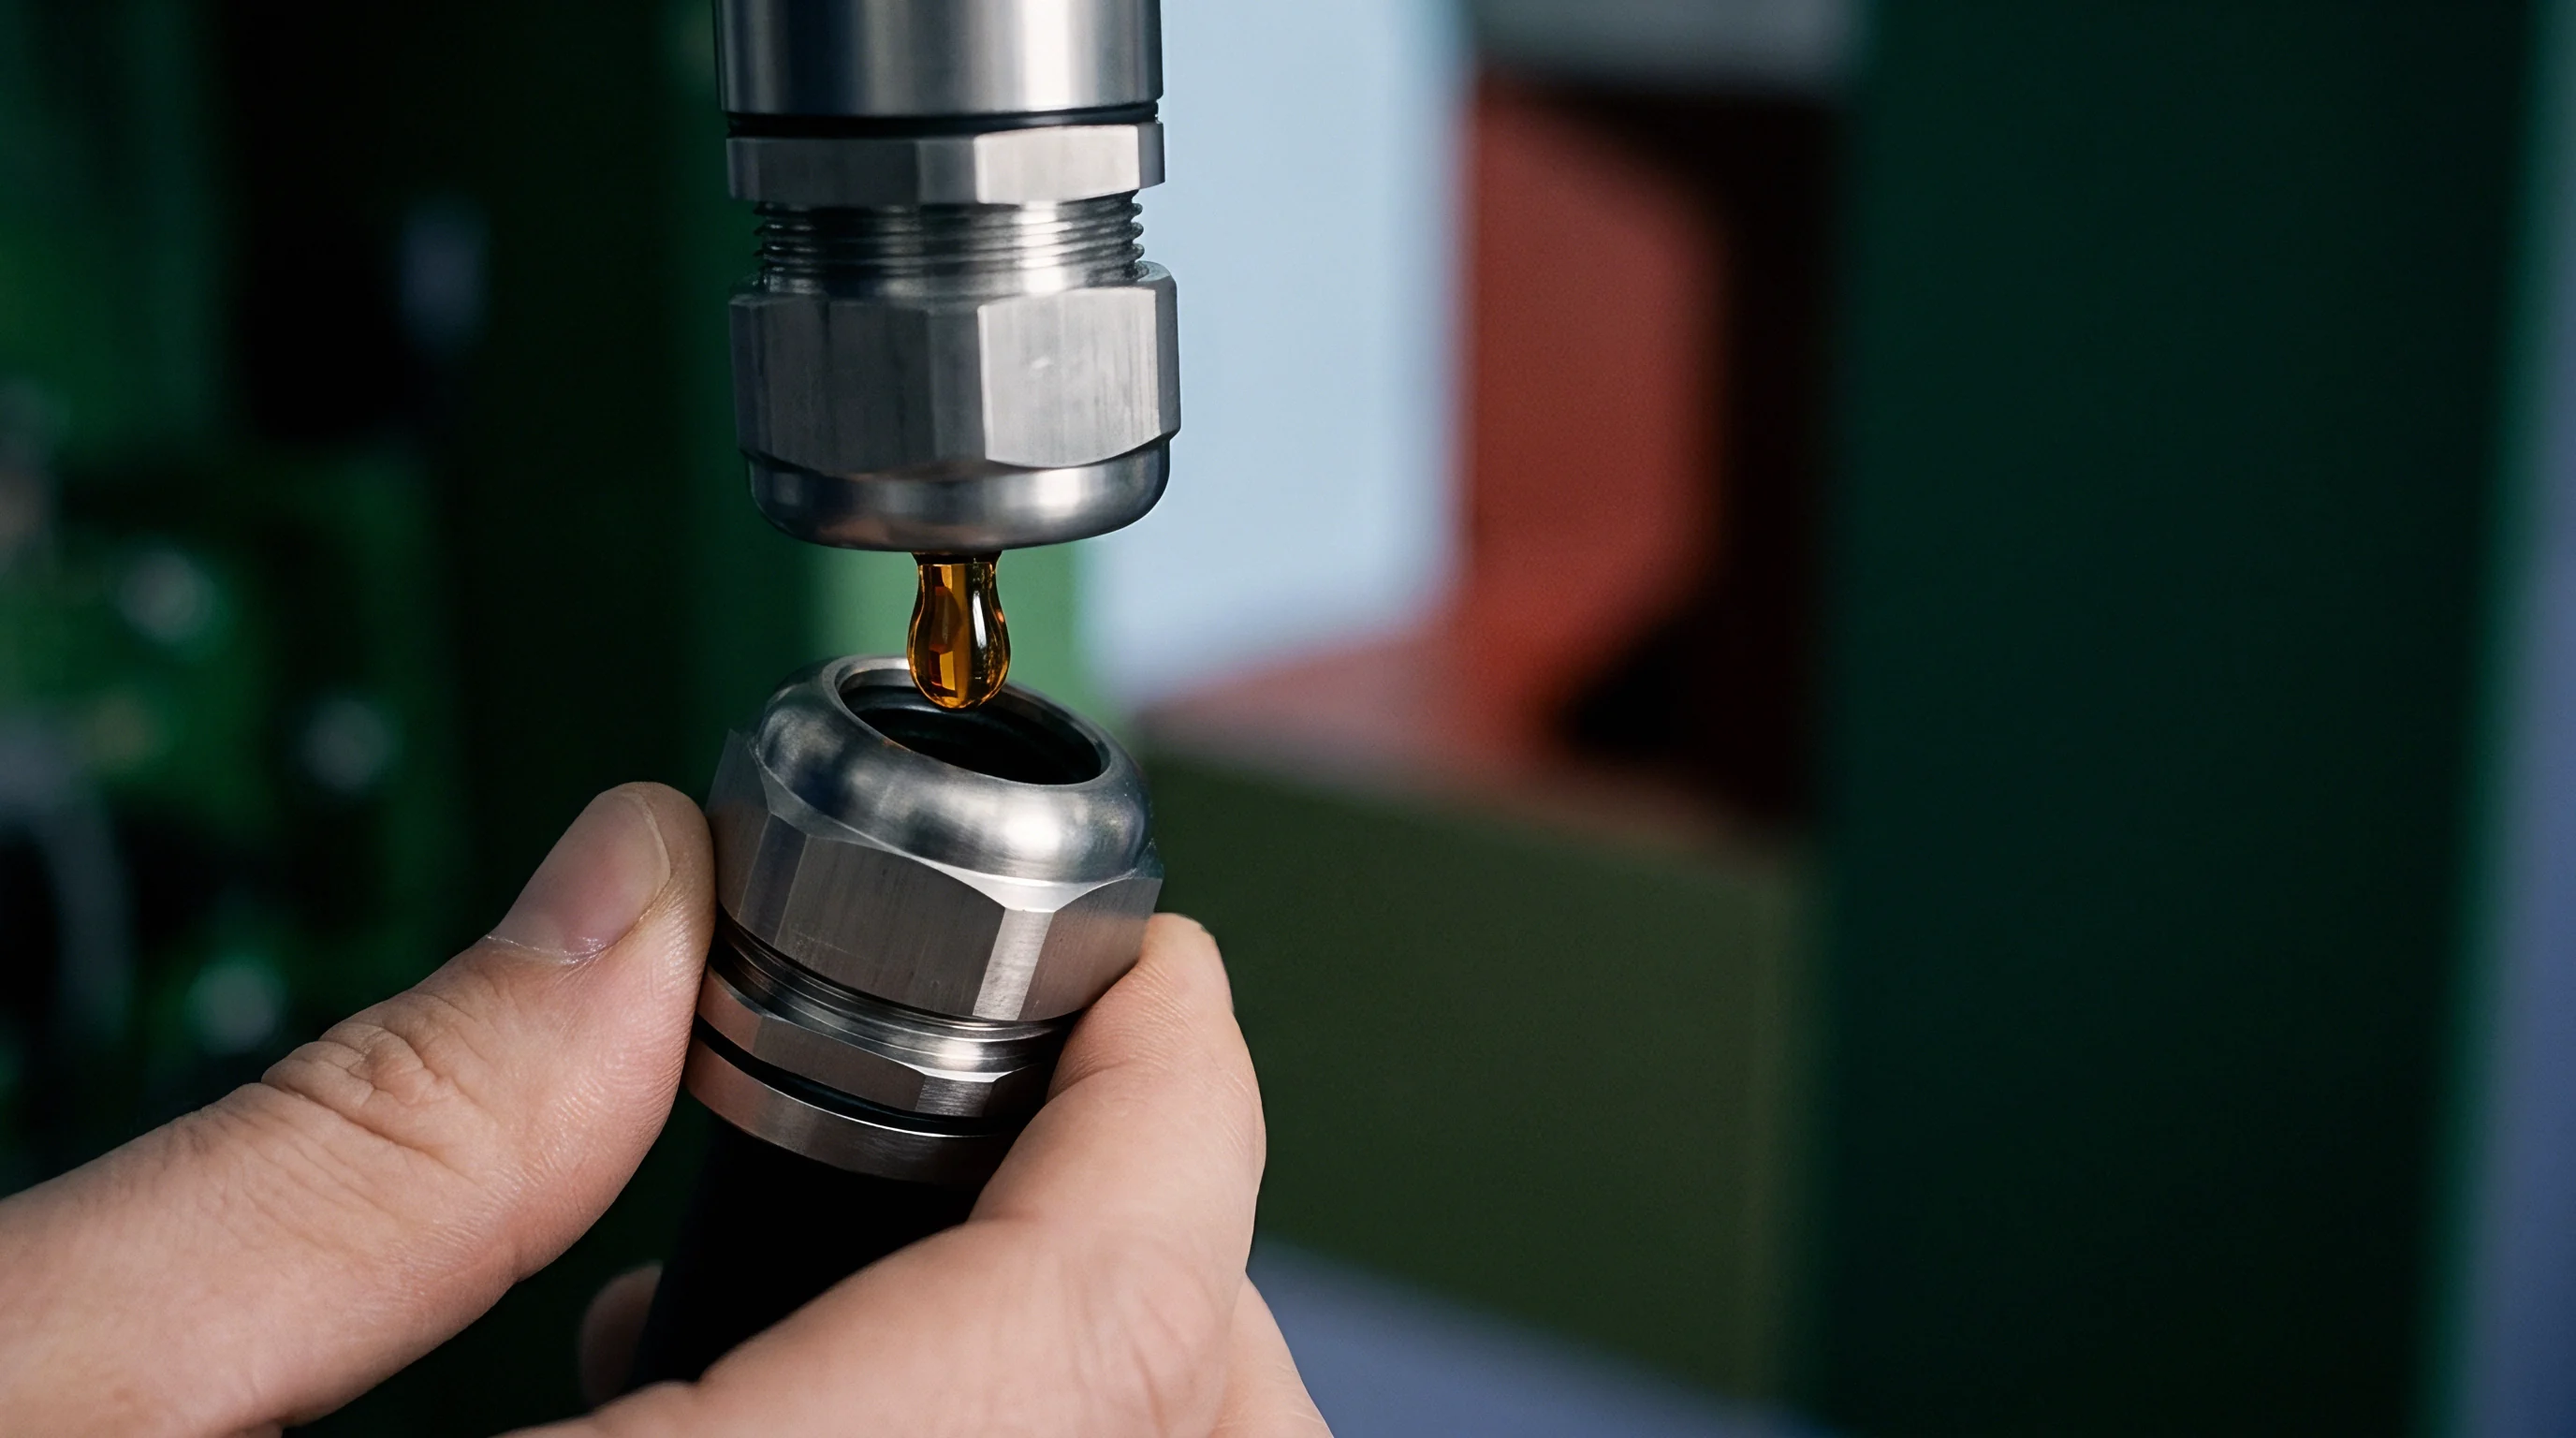
Dispensing tip geometry dictates fluid velocity profiles and local shear strain rates. High-volume battery lines require dispensing rates from five to sixty cubic centimeters per second per channel. Achieving these flow rates within tight volumetric tolerances requires optimizing internal channels through dispensing tips, static mixers, and shut-off valves.
Abrupt transitions in cross-sectional area cause sharp pressure drops and local shear spikes that can break down filler dispersion stability.
Internal channels fall into three basic designs: straight capillaries, stepped orifices, and smooth conical tapered nozzles. Pressure losses in cylindrical capillaries come from entrance losses, wall friction, and exit expansion. Stepped orifices introduce sharp right-angle corners that create recirculation zones, where heavy thermal fillers can settle, pack together, and clog channels over long runs.

Why Does Tapered Tip Geometry Reduce Shear-Induced Fill Separation?
Conical passages accelerate filled resin smoothly from barrel to exit. Contoured walls prevent recirculation zones, keeping material moving uniformly across the entire channel cross-section. This steady acceleration reduces localized shear stress gradients, preventing high-density ceramic particles from separating from the lower-viscosity polymer matrix.
Compared to straight capillary nozzles of equal length, tapered tips cut hydraulic pressure drop through the nozzle by up to forty-five percent.
Lower resistance reduces operating pressures back at the metering pumps, extending dynamic seal life and lowering hose rupture risks. Suppressing phase separation keeps the ratio of ceramic filler to polymer carrier consistent throughout the dispense stroke, ensuring cured thermal conductivity meets datasheet specs across the full length of the bead.
Engineering drawings specify maximum dispensing pressures to safeguard valve seals and maintain repeatability across multi-head setups. With two-part chemistries, tapered tips deliver stable velocity profiles into downstream static mixers, improving mix ratios without generating excessive frictional heat.

Pressure Drop and Velocity Profiles
Flow resistance inside circular channels scales sharply with diameter reductions. For power-law fluids, volumetric flow rate ties directly to pressure gradient, pipe radius, consistency index, and flow behavior index via modified Hagen-Poiseuille relations. Reducing tip inner diameter from three millimeters down to one point five millimeters increases required pump pressure by eight to twelve times at the same volumetric flow rate.
The highest wall shear rates occur right at the internal nozzle surface. Theoretical maximum wall shear rate in a circular pipe equals four times volumetric flow rate divided by pi times nozzle radius cubed, adjusted by the Rabinowitsch correction for non-Newtonian behavior. At twenty cubic centimeters per second through a two-millimeter nozzle, wall shear rates exceed six thousand inverse seconds ~ dropping apparent dynamic viscosity below five percent of its zero-shear value.
Power-law fluid velocity profiles form a flattened central plug bordered by a thin, high-shear boundary layer near the wall. As the flow behavior index drops, this velocity profile flattens further. While plug flow moves material uniformly across eighty percent of the nozzle cross-section, it concentrates shear energy into narrow regions against the metal walls.
| Tip Geometry Type | Inlet Diameter (mm) | Exit Diameter (mm) | Length (mm) | Pressure Drop (MPa) | Max Wall Shear Rate (s⁻¹) | Temperature Rise (°C) |
|---|---|---|---|---|---|---|
| Straight Capillary | 4.0 | 2.0 | 30.0 | 4.2 ± 0.3 | 7950 ± 200 | 4.8 ± 0.5 |
| Stepped Orifice | 4.0 | 2.0 | 10.0 | 5.8 ± 0.4 | 11200 ± 400 | 6.2 ± 0.7 |
| Smooth Conical Taper | 4.0 | 2.0 | 30.0 | 2.4 ± 0.2 | 4600 ± 150 | 2.1 ± 0.3 |
| Dual-Asymmetric Static Mixer | 6.0 | 3.0 | 150.0 | 6.5 ± 0.5 | 8800 ± 300 | 8.5 ± 1.0 |

Orifice Wear and Filler Particle Erosion
Ceramic particles like aluminum oxide and boron nitride scour nozzle interior walls during high-volume runs. Angular aluminum oxide particles have a Mohs hardness of nine, acting like microscopic cutting tools against stainless steel or aluminum fittings. Continuous extrusion wears down exit orifices over time, opening inner diameters, rounding exit lips, and distorting bead profiles.
As orifices widen, local fluid velocity drops and wall shear rates decrease for a given pump output. Lower shear rates raise effective viscosity at the tip, pushing dispense pressures up over successive shifts. Enlarged nozzles also distort bead shape ~ producing wider, flatter profiles that change how material spreads during cell assembly.
Swapping 316L stainless steel tips for hardened tungsten carbide or sapphire extends nozzle life more than twenty-fold.
High shear stresses inside static mixing tubes convert mechanical energy to heat as fluid passes through internal helical elements. Temperature rises of five to twelve degrees Celsius temporarily drop viscosity but accelerate cross-linking reactions in two-part materials. Shortened pot life inside the mixer raises the risk of gel formation and tip clogging during line pauses.
Dispensing fluid dynamic failure modes follow predictable physical mechanisms across high-speed packaging lines:
- Phase Separation occurs when strong shear gradients force liquid resin away from dense ceramic particles, creating inconsistent thermal conductivity along the bead.
- Nozzle Drooling stems from low yield stress combined with trapped air, letting residual pressure push material past needle seats after valve closure.
- Filler Particle Packing occurs in sharp right-angle transitions where stagnation zones catch dry ceramic agglomerates, narrowing internal passages.
- Viscous Frictional Heating triggers premature curing inside static mixers during line pauses, raising viscosity and pushing pump pressures past working limits.
Selecting nozzle geometry comes down to balancing allowable line pressure drops against required dispense rates. Routine tip cleaning and automated optical bead inspection keep partial clogs from disrupting production. Conical nozzle shapes cut internal friction and reduce filler segregation across normal operating conditions.
Squeeze
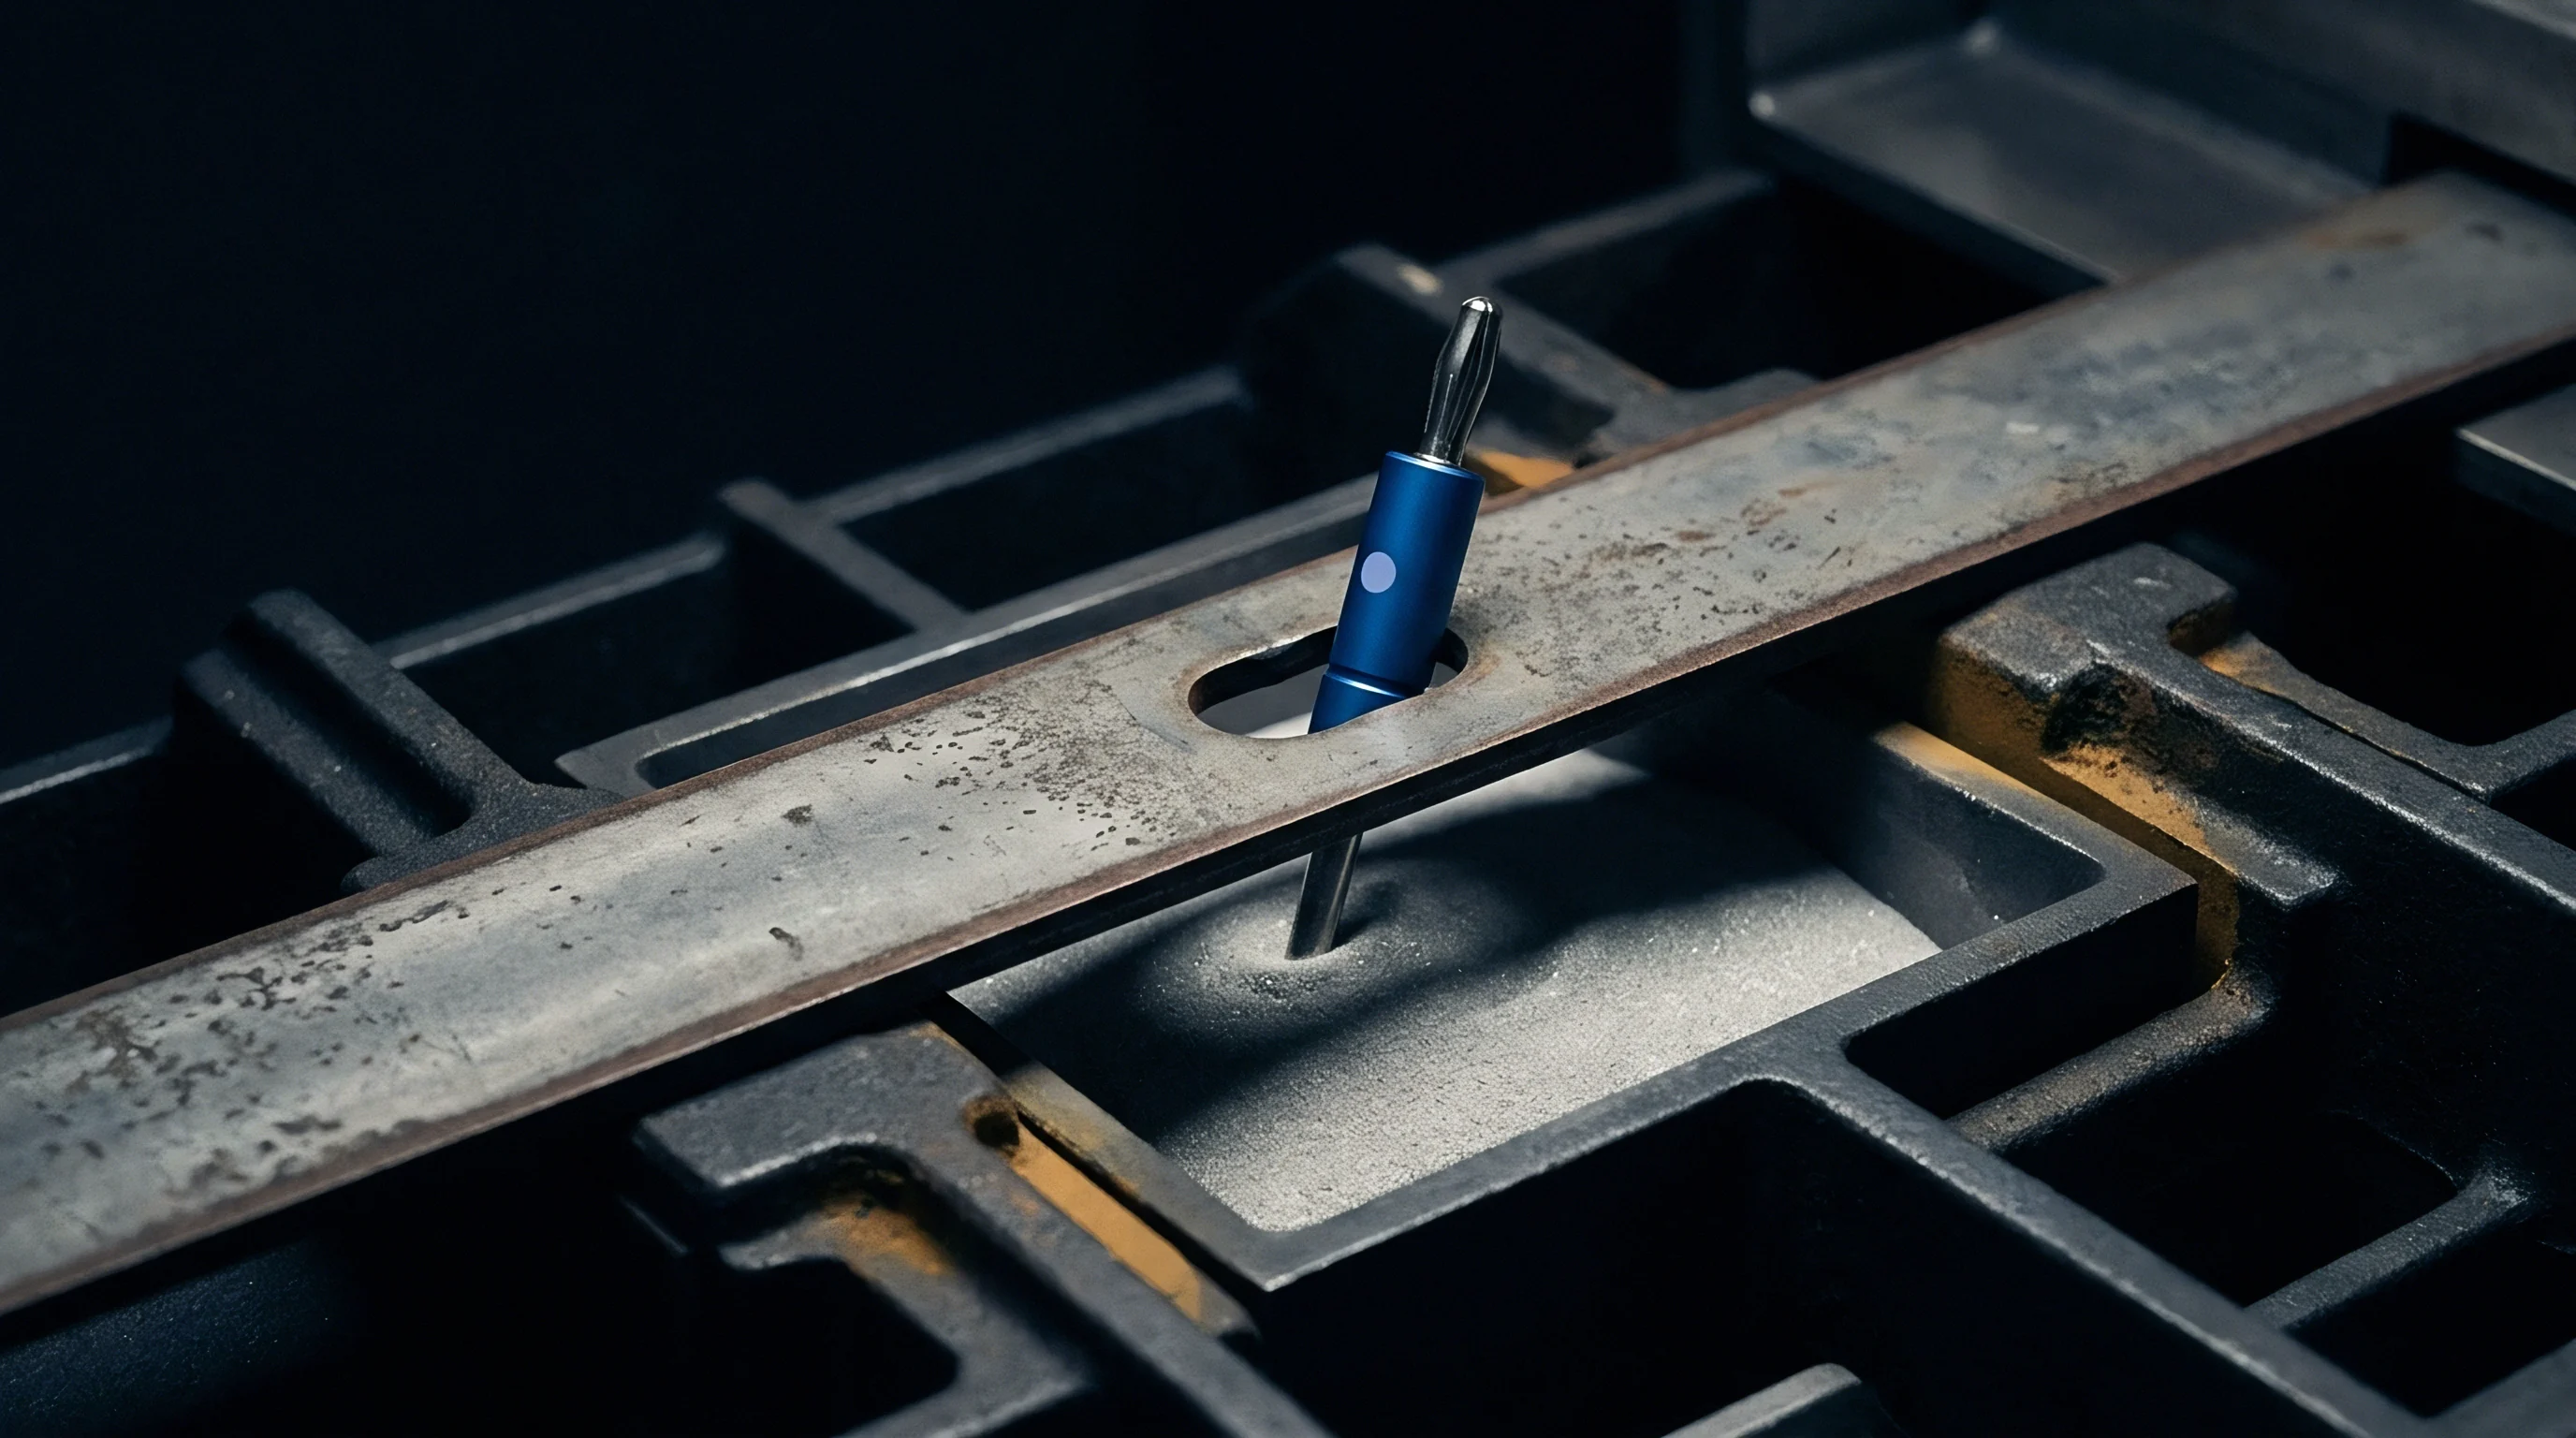
Automated presses compress cooling plates against cell modules to spread dispensed filler tracks into thin layers. Squeeze flow mechanics under velocity control govern final thermal interface thickness and cell stress distributions. Prismatic aluminum cans and framed pouch cells have strict mechanical compression limits; excessive assembly force deforms cell housings, crushes internal electrode stacks, damages pouch seals, or warps cooling plate channels.
When two parallel surfaces compress a fluid bead, material flows outward toward open edges. Resistance depends on dynamic viscosity, gap height, plate area, squeeze speed, and surface boundary conditions. With Newtonian fluids, squeeze force scales inversely with the cube of the gap.
Shear-thinning gap fillers soften this force spike, but squeeze resistance still rises non-linearly as gap dimensions shrink.
Transient Compression Dynamics and Viscous Resistance
Press speed governs the peak reaction forces exerted on cell structures. Rapid compression creates high shear strain rates in the closing gap, thinning the material dynamic viscosity. Yet fast compression also builds sharp hydrodynamic pressures inside the core of the spreading bead.
This transient pressure surge offsets the benefits of shear-thinning, creating heavy resistance forces during the final milliseconds of stroke travel.
Under constant squeeze speed, flow dynamics follow modified Stefan equations for power-law fluids, with peak normal force occurring at minimum gap height. Dropping compression speed during the final ten percent of stroke travel cuts peak hydrodynamic force by up to sixty percent while adding only a fraction of a second to cycle time. Dynamic phase separation occurs when strain rates exceed three thousand inverse seconds in narrow nozzle tests.
Shifting from linear displacement to force-controlled squeeze profiles during cold plate mating cuts thermal impedance by eighteen percent. Modern servo-electric presses execute multi-stage profiles: fast approach, velocity-controlled bulk spreading, and a force-controlled compliance hold. The force-controlled hold allows viscous relaxation, letting material creep into surface micro-valleys without over-stressing pouch cell tabs.
Peak assembly compression force scales inversely with gap height to the power of three minus the flow behavior index divided by two.

Bond Line Thickness and Stack up Tolerances
Tolerance stack-ups across prismatic cell arrays cause varying gap heights across the cooling interface. Combined cell variations, module weld tolerances, and cooling plate flatness errors create local gaps from zero point two millimeters to one point five millimeters within one pack assembly. Gap fillers must spread enough to fill maximum clearance zones without creating excessive reaction force in tight gaps.
Nominal target bond lines usually fall between zero point three and zero point seven millimeters. Minimizing bond line thickness is critical to lowering thermal resistance, since total impedance equals bond line thickness divided by bulk thermal conductivity plus interfacial contact resistance. Thinner gaps shorten conductive paths to liquid coolant, but forcing filler into gaps under zero point two millimeters triggers particle locking, where ceramic grains jam against surface asperities and send squeeze forces soaring.
| Compression Velocity (mm/s) | Initial Gap (mm) | Final Gap (mm) | Spread Diameter (mm) | Peak Squeeze Force (kN) | Relaxation Time to 10% Force (s) | Total Thermal Impedance (K-cm²/W) |
|---|---|---|---|---|---|---|
| 5.0 | 3.0 | 0.5 ± 0.05 | 120 ± 4 | 14.5 ± 1.2 | 8.2 ± 0.6 | 1.45 ± 0.10 |
| 1.0 | 3.0 | 0.5 ± 0.05 | 121 ± 3 | 6.8 ± 0.5 | 4.1 ± 0.3 | 1.38 ± 0.08 |
| 0.2 | 3.0 | 0.5 ± 0.05 | 122 ± 2 | 2.9 ± 0.2 | 1.2 ± 0.1 | 1.32 ± 0.06 |
| Force-Controlled (3 kN Hold) | 3.0 | 0.42 ± 0.03 | 125 ± 2 | 3.0 ± 0.0 | 0.4 ± 0.05 | 1.18 ± 0.05 |

Void Formation and Micro Air Trapping Mechanics
As material spreads laterally, non-uniform advance velocities can trap air bubbles against substrate surfaces. Single-bead layouts let air vent ahead of the spreading front as the gap closes. Multi-line or wave patterns risk merging flow fronts before air escapes, trapping gas pockets in the thermal layer that act as thermal insulators during fast charging.
Void formation increases when localized shear drops fluid viscosity too quickly, destabilizing the spreading boundary. These Saffman-Taylor finger instabilities occur when low-viscosity fluid moves through narrow gaps, breaking uniform linear fronts into irregular fingers that fold over and trap micro-voids against the metal.
Using continuous single-line or optimized serpentine patterns keeps material advancing smoothly outward from the center without trapping air. Cold plate surface finish also matters: deep machining grooves on aluminum plates require slower initial squeeze speeds so the viscous compound wets out surface grooves before the main flow front passes over.
Process engineers optimize automated compression steps using standardized sequence guidelines:
- Position the cell module over the dispense pattern using vision-guided robotic alignment fixtures.
- Lower the press head at twenty millimeters per second to a standoff distance of three millimeters above the cold plate.
- Decelerate press movement to zero point five millimeters per second to drive bulk material wetting across the plate.
- Switch from velocity to force control upon reaching a reaction force threshold of two point five KiloNewtons per module footprint.
- Hold constant force for four seconds to allow thixotropic relaxation, surface micro-wetting, and air evacuation at boundary edges.
- Engage permanent mechanical module fastners to lock stack alignment before releasing press vertical clamp pressure.
Untuned squeeze profiles leave high residual stress on cells, trap voids, or damage structural components. Excessive force can permanently crush internal cooling channels, restricting coolant flow and degrading battery thermal performance over the vehicle’s life.
Wetting
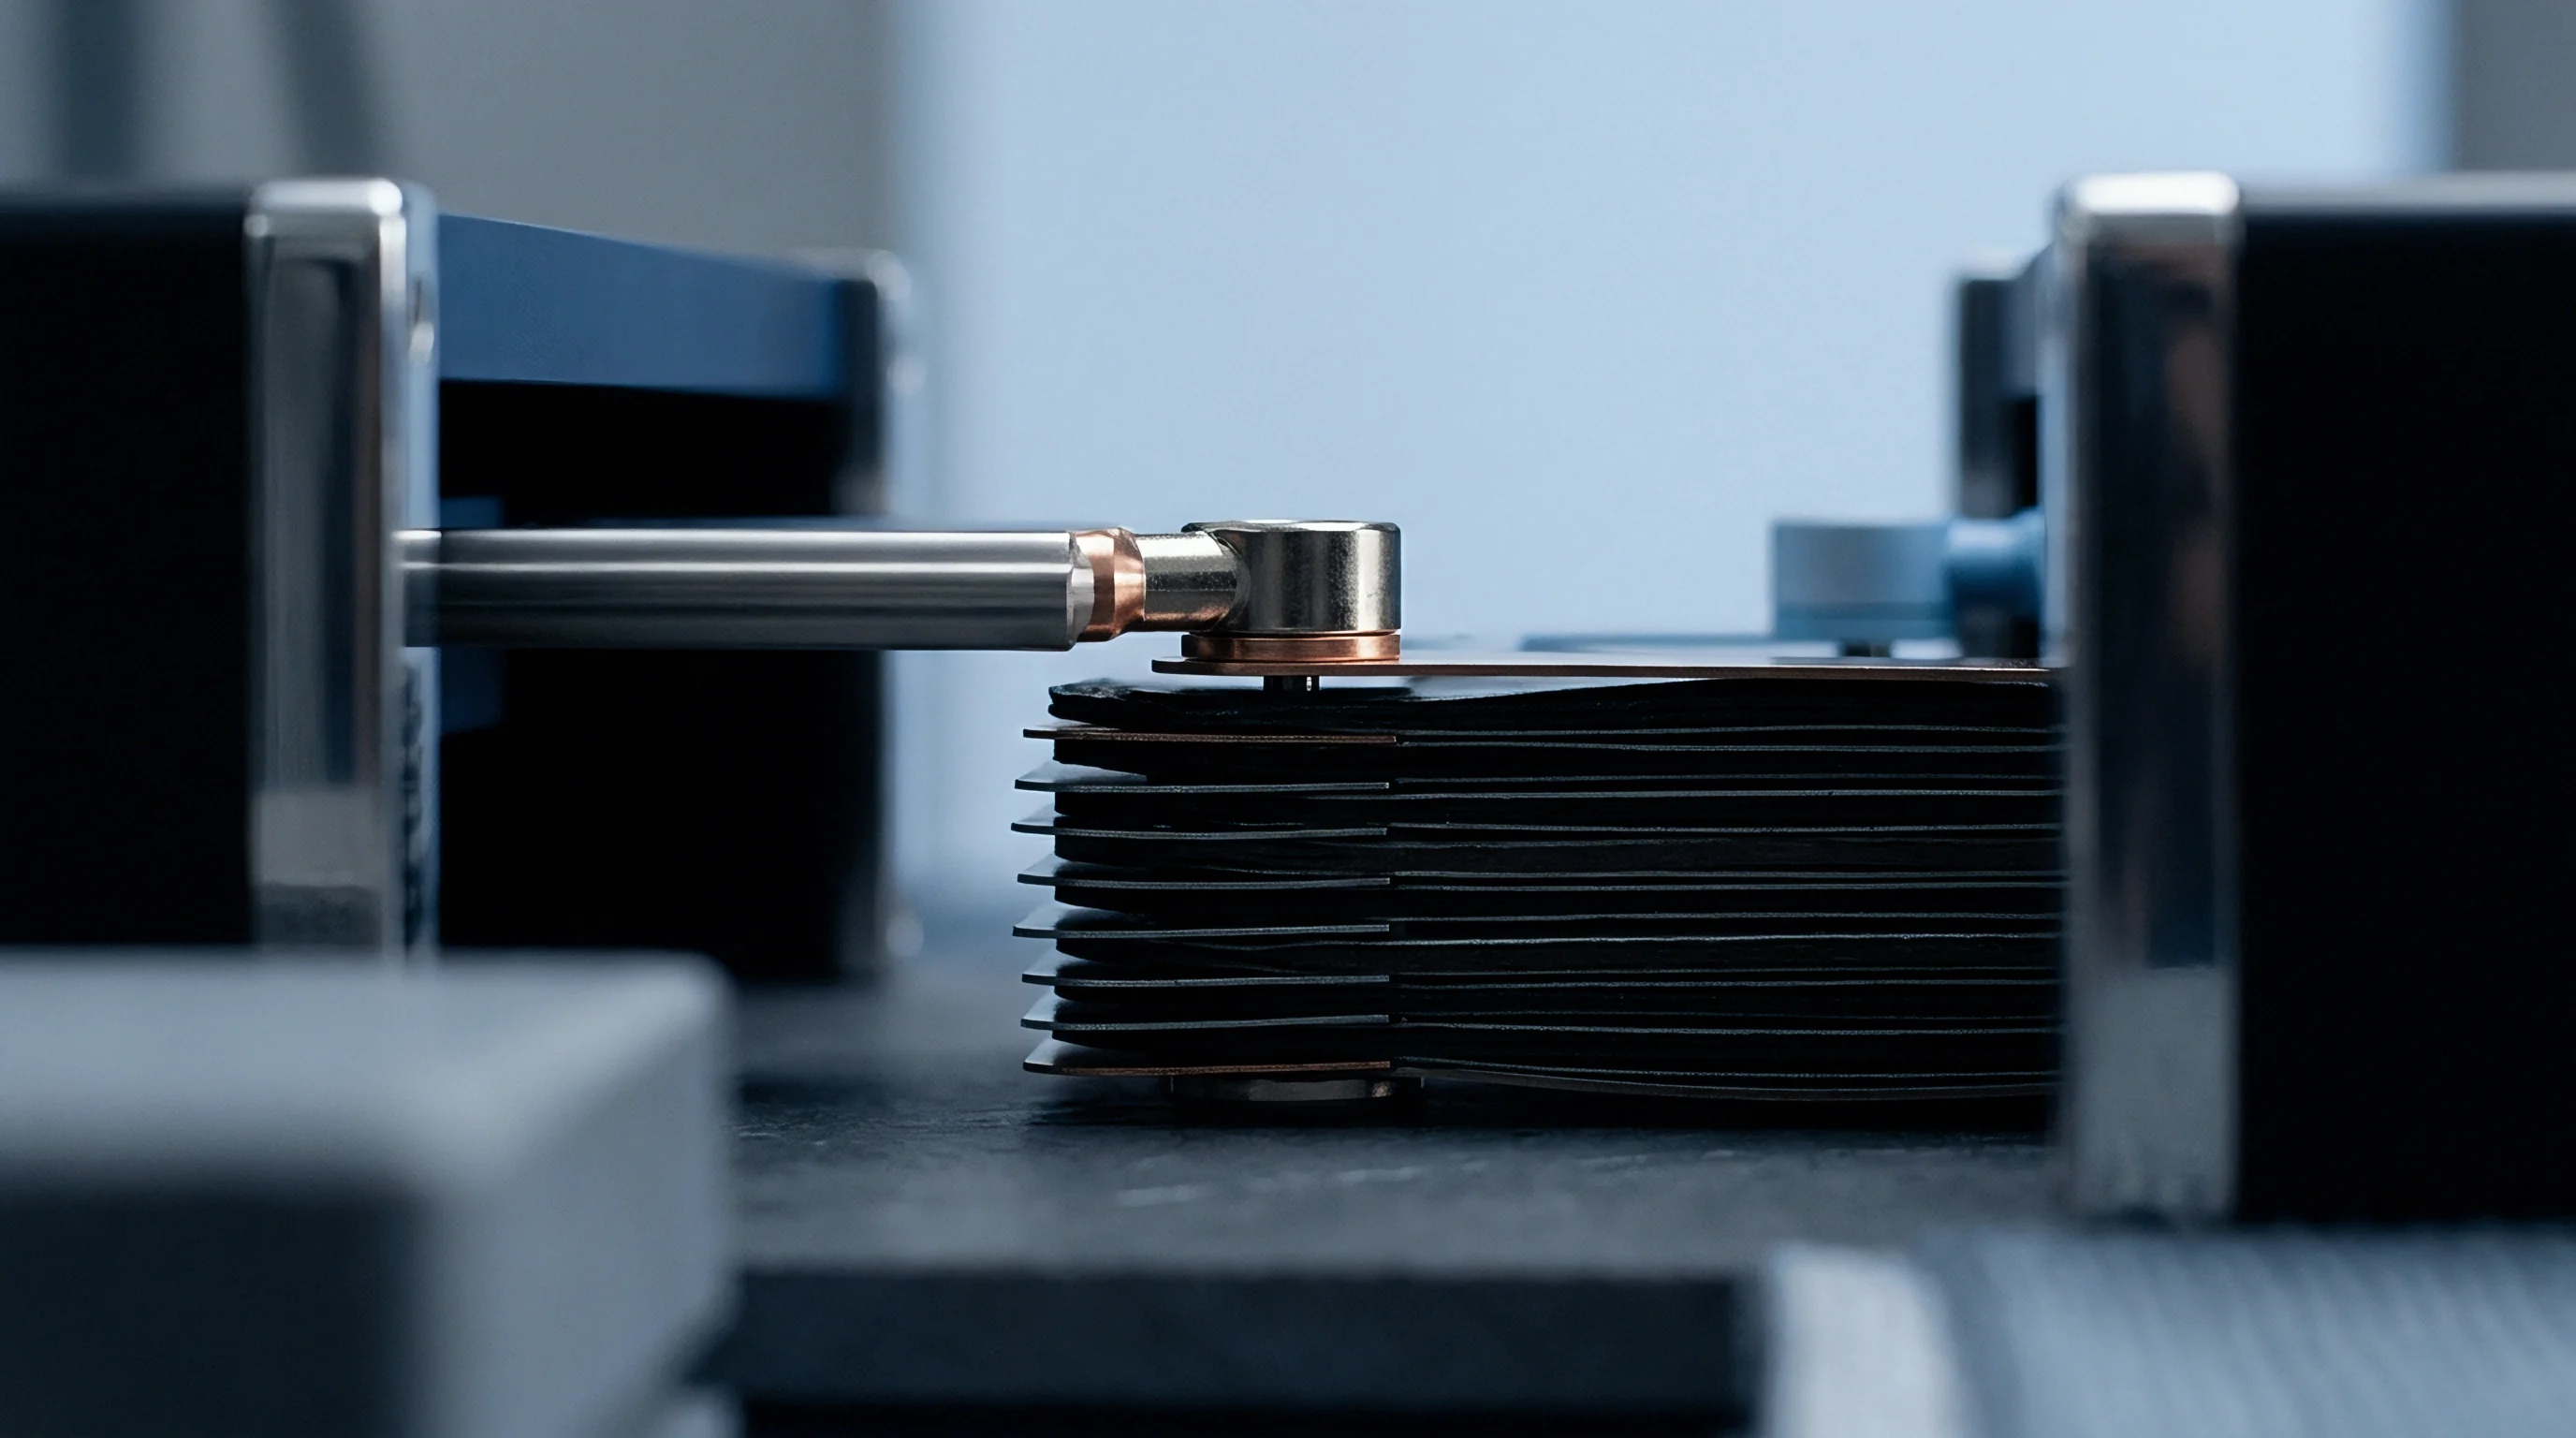
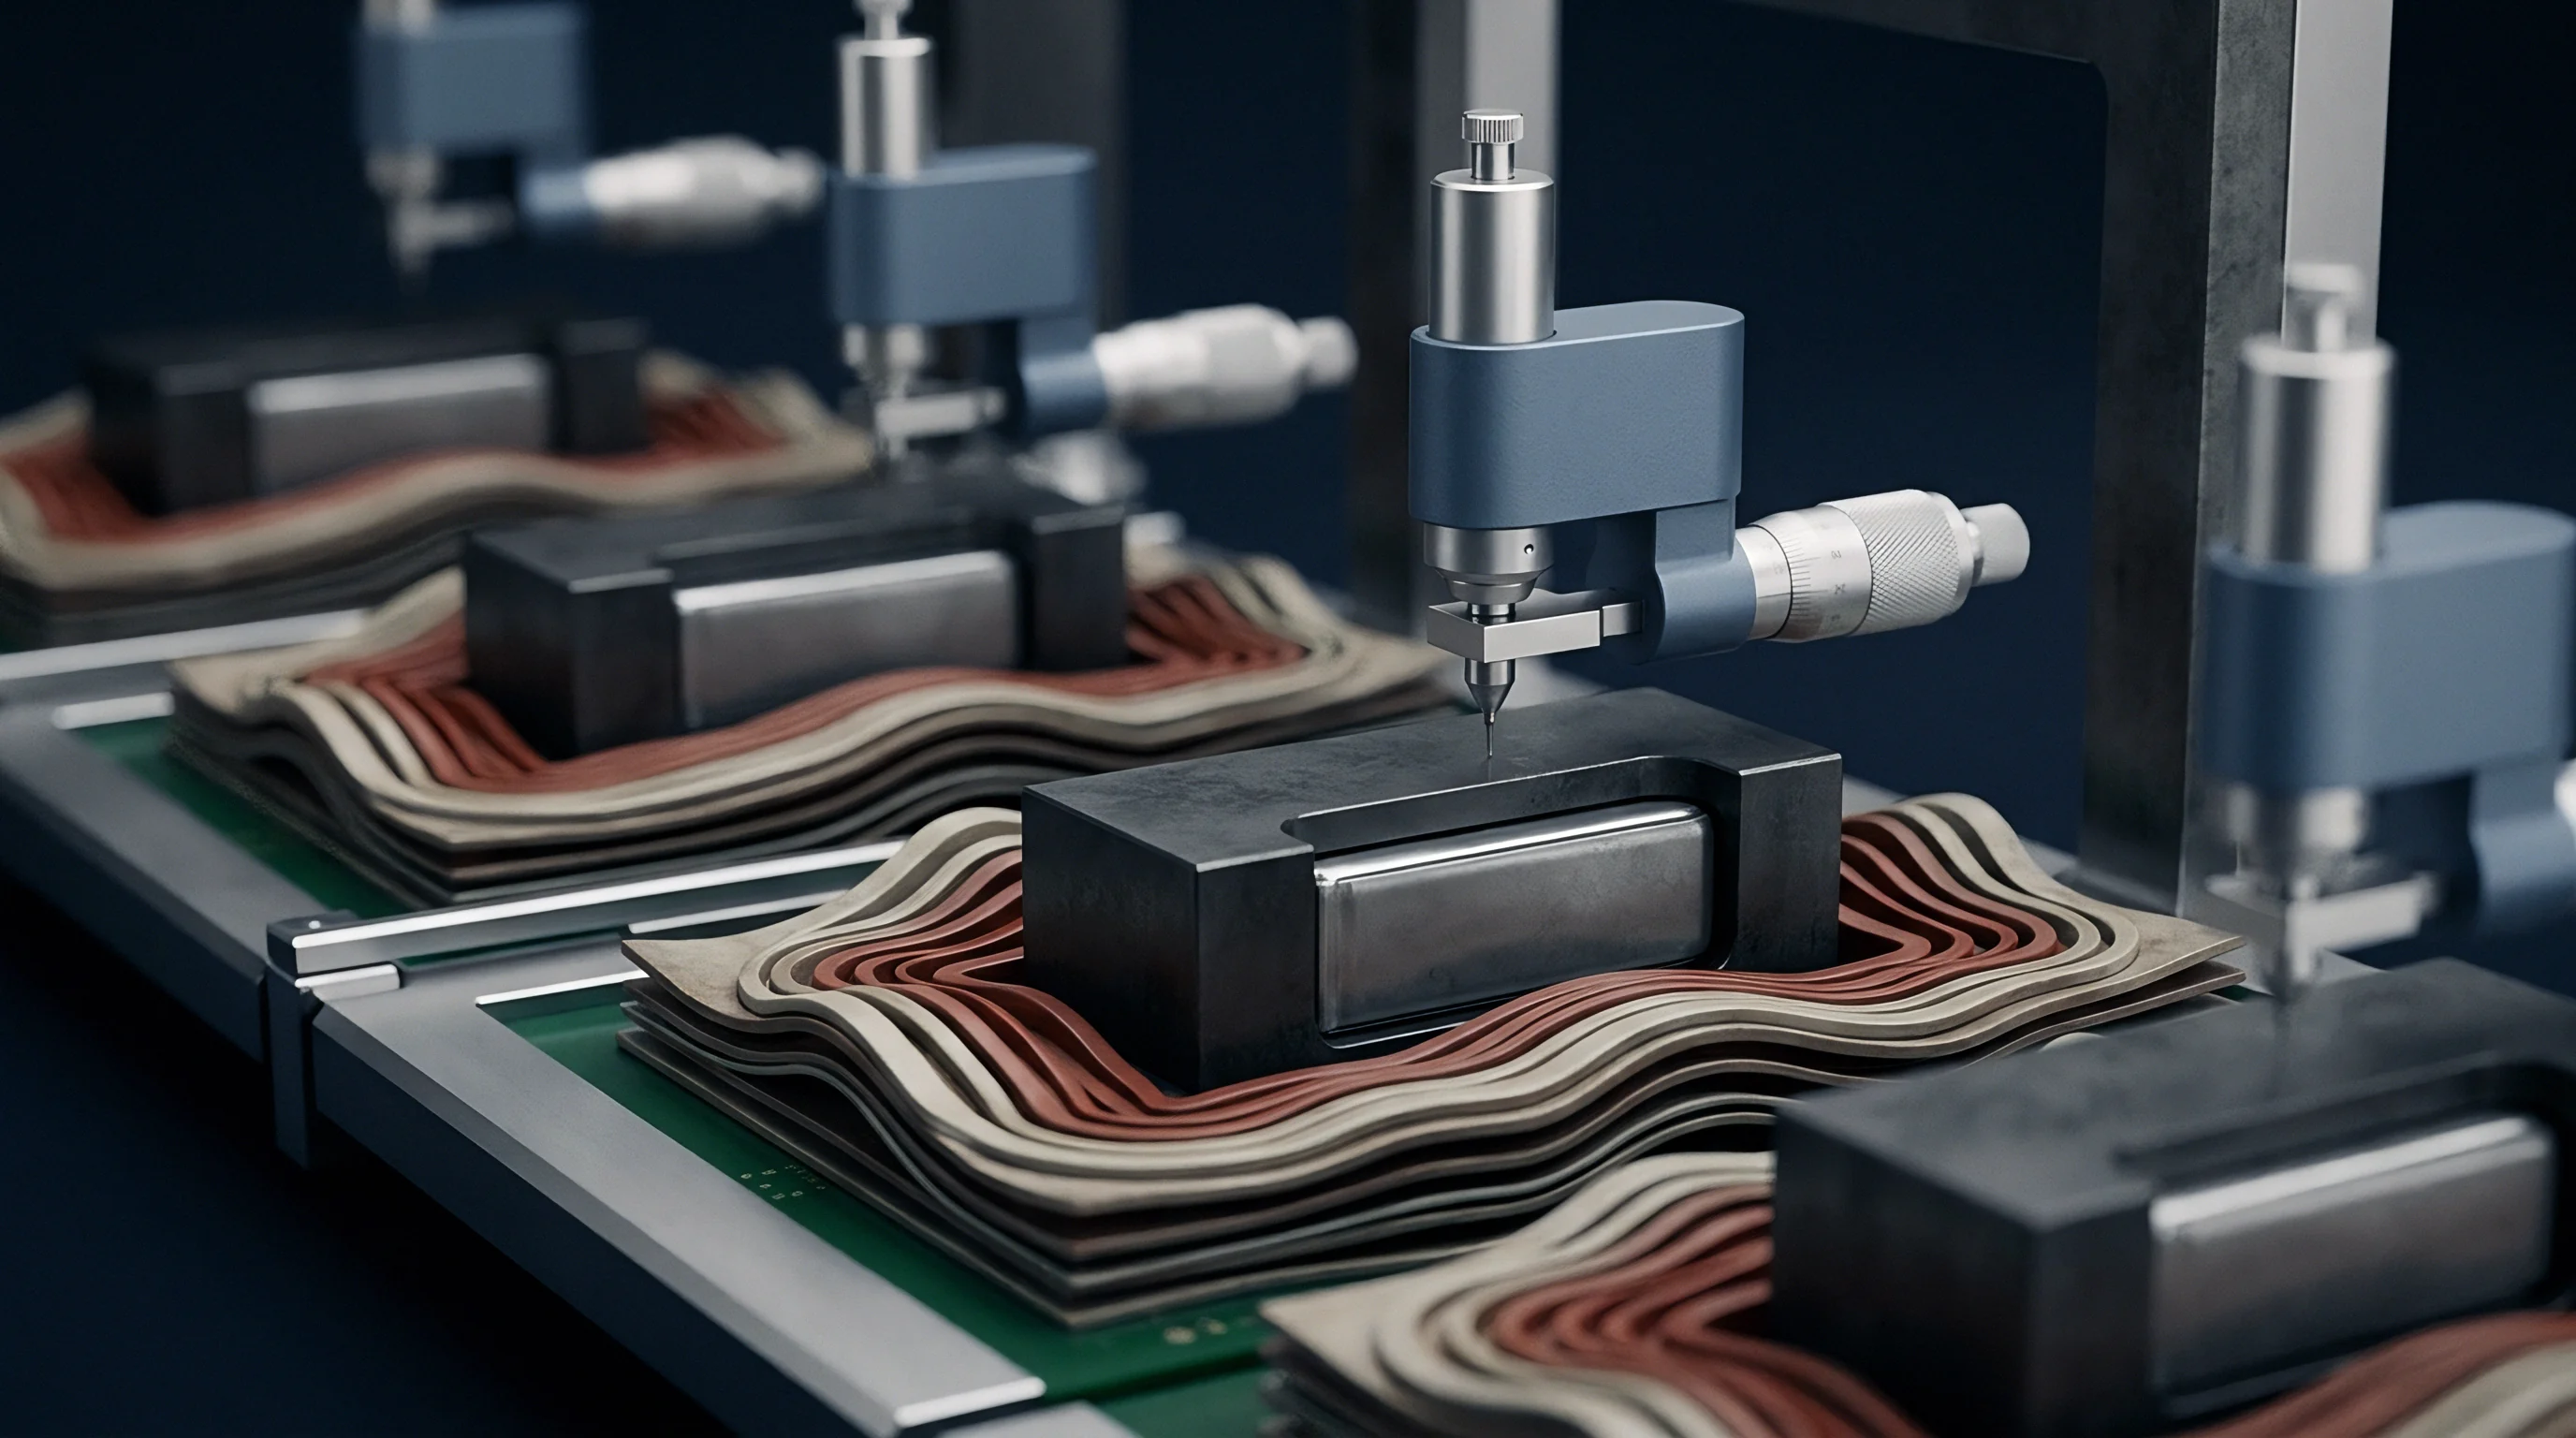
Surface energy on aluminum cold plates and cell casings dictates how well uncured liquid spreads across the interface. Intimate physical contact between filler and metal is essential to minimize interfacial thermal resistance; micro-air gaps at the boundary act as insulation layers that lower overall heat transfer even when bulk material conductivity is high.
Wetting depends on the thermodynamic balance between solid surface energy, liquid surface tension of the resin, and interfacial tension between phases. Untreated aluminum cold plates typically measure thirty-five to forty-five mN/m surface energy, coated with native oxide and residual stamping oils. Base silicone or polyurethane gap fillers display surface tensions between twenty-five and forty mN/m.

Surface Energy and Contact Angle Equilibrium
Interfacial equilibrium governs how far liquid resin spreads on metal surfaces. Young’s equation balances these phase tensions to define static contact angles, where angles below ninety degrees indicate partial wetting and values near zero reflect full spontaneous spreading. Under rapid squeeze flow, high dynamic contact angles slow boundary advancement, leaving unwetted micro-valleys along surface roughness.
Dynamic contact angles diverge significantly from static values during automated pressing. As force pushes material rapidly across cold plates, the advancing contact angle increases with capillary number ~ viscosity times velocity divided by surface tension. At high capillary numbers, advancing contact angles can reach one hundred twenty degrees, forming a convex fluid edge that traps micro-air pockets against rough surfaces.
Keeping dynamic contact angles low requires clean surfaces or surface pre-treatment. Atmospheric plasma cleaning raises aluminum surface energy above sixty-five mN/m by stripping organic residues and grafting polar functional groups onto the oxide layer. These polar surfaces drop static contact angles below fifteen degrees, accelerating wetting without high compression forces.
Interfacial thermal contact resistance drops exponentially as substrate surface free energy increases toward sixty-five milliNewtons per meter.
Surface Contamination and Substrate Preparation
Stamping oils, machining coolants, and silicone release agents leave low-energy hydrocarbon films on cold plates prior to dispensing. These residues can drop surface energy below thirty mN/m, preventing uncured filler from wetting cleanly. The material slips across contaminated areas rather than shearing smoothly, distorting bead geometry.
Factory surface preparation relies on inline plasma cleaning, solvent wiping, or laser ablation. Robotic blown-ion plasma heads sweep cold plates immediately before dispensing, oxidizing surface hydrocarbons and boosting polar surface energy to promote rapid wetting by polyurethane or acrylic matrix resins.
Surface roughness modifies this behavior according to Wenzel’s relation: texturing amplifies the substrate’s natural tendency, increasing contact angle on hydrophobic surfaces and decreasing it on hydrophilic ones. Micro-texturing aluminum cold plates increases surface area and mechanical keying, provided initial resin viscosity is low enough to fill micro-cavities without trapping air.
Evaluating raw substrate suitability relies on evaluating key interface parameters:
- Substrate Surface Free Energy measures total surface energy via multi-liquid Owens-Wendt-Rabel-Kaelble contact angle analysis to verify dispersive and polar components.
- Advancing Dynamic Contact Angle tracks fluid edge spreading behavior under compression speeds matching line assembly rates.
- Surface Roughness Parameter Ra measures mean surface profile height to set baseline filling requirements.
- Interfacial Tension Modifier Content measures silane or titanate coupling agent concentrations added to promote bonding between matrix resin and aluminum oxide substrates.
Interfacial voiding and elevated thermal resistance are frequently attributed to plant humidity swings or alloy batch variations rather than substrate surface energy. Process specifications should define clear surface energy thresholds verified by inline dyne pens or goniometers prior to dispensing. Explicit cleanliness requirements prevent de-wetting and ensure consistent thermal contact throughout production runs.


Degradation
Thermal cycling and vibration test cured elastomeric networks over a fifteen-year vehicle lifespan. Battery packs encounter ambient swings from minus forty to eighty-five degrees Celsius, mechanical shocks up to fifty G, and ongoing structural flexure from road input. Gap fillers must retain elasticity and surface adhesion without cracking, delaminating, or pumping out over millions of strain cycles.
Chemical breakdown includes chain scission, cross-link density drift, siloxane ring formation in silicones, and hydrolysis in polyurethanes. Sustained heat accelerates thermal-oxidative aging, raising cross-link density and hardening the elastomer. Hardened material loses compliance, transferring higher mechanical stress directly to lithium-ion cell walls as temperatures cycle.

Pump out and Filler Settling Mechanisms
Differential thermal expansion between cells and cooling plates creates cyclic shear across the joint. Aluminum cold plates expand at roughly twenty-three parts per million per Kelvin, while cell modules expand asymmetrically based on internal electrode orientation. Relative movement across the joint creates alternating shear stresses that squeeze material outward toward open edges ~ a process called thermal pump-out.
Pump-out gradually clears thermal material from central high-heat areas, leaving dry spots filled with air that cause sharp spikes in thermal impedance and localized cell overheating. Formulations with high elasticity, low compression set, and strong adhesion resist lateral movement under repeated thermal cycling.
Density differences cause filler settling in stored pails or two-part supply tanks. Heavy ceramic particles drop over time, creating a gradient in density and viscosity from top to bottom. Dispensing from settled containers yields non-uniform filler ratios, unpredictable line rheology, and inconsistent thermal conductivity in finished packs.
Regular mechanical agitation or drum rotation protocols keep particles suspended prior to use.

Dielectric Breakdown and Thermal Resistance Drift
Electrical isolation across the thermal interface degrades if void channels align under high voltage. Operating at nominal pack voltages between four hundred and eight hundred Volts DC, gap fillers double as primary electrical insulation between cell casings and the grounded chassis cold plate. ASTM D149 breakdown strength requirements typically exceed ten to fifteen KiloVolts per millimeter.
Breakdown pathways can form along aligned ceramic particles, moisture ingress paths, or void networks left during compression. Strong electric fields trigger partial discharges inside trapped voids, generating localized micro-arcs that degrade the matrix into conductive carbon tracks and threatening high-voltage shorts to chassis ground.
Thermal resistance drift tracks percentage increases in thermal impedance after accelerated aging. Extended exposure to high humidity ~ eighty-five degrees Celsius at eighty-five percent relative humidity ~ allows moisture onto ceramic particle surfaces, weakening matrix bonds. Micro-cracking along these filler boundaries impedes phonon transport and drives thermal resistance up over time.
Standardized qualification sequences establish material compliance through mandatory test procedures:
| Test Protocol Standard | Environmental Exposure Parameters | Test Duration / Cycles | Max Allowed Thermal Impedance Drift (%) | Min Allowed Dielectric Strength (kV/mm) |
|---|---|---|---|---|
| High Temperature Storage (ISO 16750-4) | 85°C dry heat continuous exposure | 1000 Hours | < 15% | > 12.0 |
| Temperature Humidity Bias (IEC 60068-2-78) | 85°C temperature and 85% RH bias | 1000 Hours | < 20% | > 10.0 |
| Thermal Shock Cycling (JESD22-A104) | -40°C to +85°C, 30 min dwell, <10s transfer | 1000 Cycles | < 15% | > 12.0 |
| Multi-Axis Random Vibration (GMW3172) | 10 Hz to 2000 Hz, 3.2 G rms profile with thermal cycle | 32 Hours per Axis | < 10% | > 15.0 |
Quality specs should require suppliers to certify dielectric breakdown retention after thermal aging. Standard supply agreements reference ISO 16750-4 section 5.3, capping thermal impedance drift at fifteen percent after one thousand shock cycles from minus forty to eighty-five degrees Celsius. Binding environmental thresholds in master supply agreements protect pack integrators against unannounced formulation changes that affect long-term safety.


Warranty
Quality agreements define operational bounds for material viscosity, dispense pressures, and cured bond thickness. Procurement teams negotiating supply contracts must map technical failure modes directly to legal liability limits. Vague boundaries between resin suppliers, dispensing equipment vendors, and pack assemblers lead to costly disputes if line yields drop or field failures occur.
Contracts assign financial responsibility based on verified adherence to drawing specifications. If a material supplier meets incoming viscosity, specific gravity, and thixotropic index specs, liability for dispense voids or thick bond lines falls on the integrator or assembly plant. Conversely, if a supplier changes particle size distribution or catalysts without notice ~ causing pressure spikes and tip clogs ~ they assume cost recovery for lost takt time and scrapped module assemblies.
Qualification Test Dossiers and Accelerated Aging
Qualification programs subject complete battery packs to thermal shock, high-humidity storage, and multi-axis random vibration. Purchasing organizations require full technical dossiers before awarding volume contracts ~ including raw material batch logs, differential scanning calorimetry cure kinetics, temperature-dependent flow curves, and third-party electrical test reports.
Automated lines rely on real-time data logging to validate compliance on every pack. Vision systems inspect bead width, height, and continuity before module placement, while servo-press controllers log peak squeeze force, stroke speed, and final standoff height. Quality engineers save these logs to the pack birth certificate database, creating an audit trail linking process parameters to individual serial numbers.
Supplier accelerated aging data requires independent audit verification. Vendors frequently run qualification tests on ideal lab fixtures with polished, gold-plated co-planar plates, understating contact resistance seen on industrial aluminum cold plates. Supply contracts should require testing on production-grade cold plates with realistic surface roughness, oil residue levels, and flatness tolerances.
Defect Allocation and Liability Seams
Supply contracts establish the legal boundaries allocating financial responsibility for thermal failures. Warranty claims tied to cell overheating require forensic teardowns to isolate root causes ~ evaluating bond line thickness, void fraction, delamination, and chemical composition using Fourier-transform infrared spectroscopy and X-ray computed tomography.
Defect allocation terms define explicit metric thresholds for failure classification. Void area fractions above five percent of total cell contact area point to assembly errors in press operation or bead placement. Micro-cracking, phase separation, or matrix hardening combined with dielectric breakdown represent material defects assigned to the supplier.
Setting these explicit boundaries in master quality agreements avoids ambiguity during warranty disputes.
Tooling amortization models must account for tip wear and pump seal replacements. Highly abrasive thermal compounds wear mechanical fluid components at predictable rates, requiring preventive maintenance shutdowns every fifty thousand cycles. Equipment agreements should specify wear warranties, requiring pump valves to hold volumetric accuracy within plus or minus two percent across their rated service life.
Final acceptance testing for automated dispensing cells requires full line-rate verification under production conditions. Systems must hit target volumetric flow rates, maintain vision-guided bead positioning within zero point two millimeter tolerances, and complete squeeze cycles without over-force alerts across one thousand consecutive test cycles. Verifying compliance during pilot runs establishes process capability metrics and provides the final sign-off for volume battery assembly.