Capacity Grading Tolerances inside a Tier One Factory
Capacity grading accuracy depends on controlling thermal soaking windows, pneumatic pin resistance, and strict four-wire Kelvin probe calibration on the line.


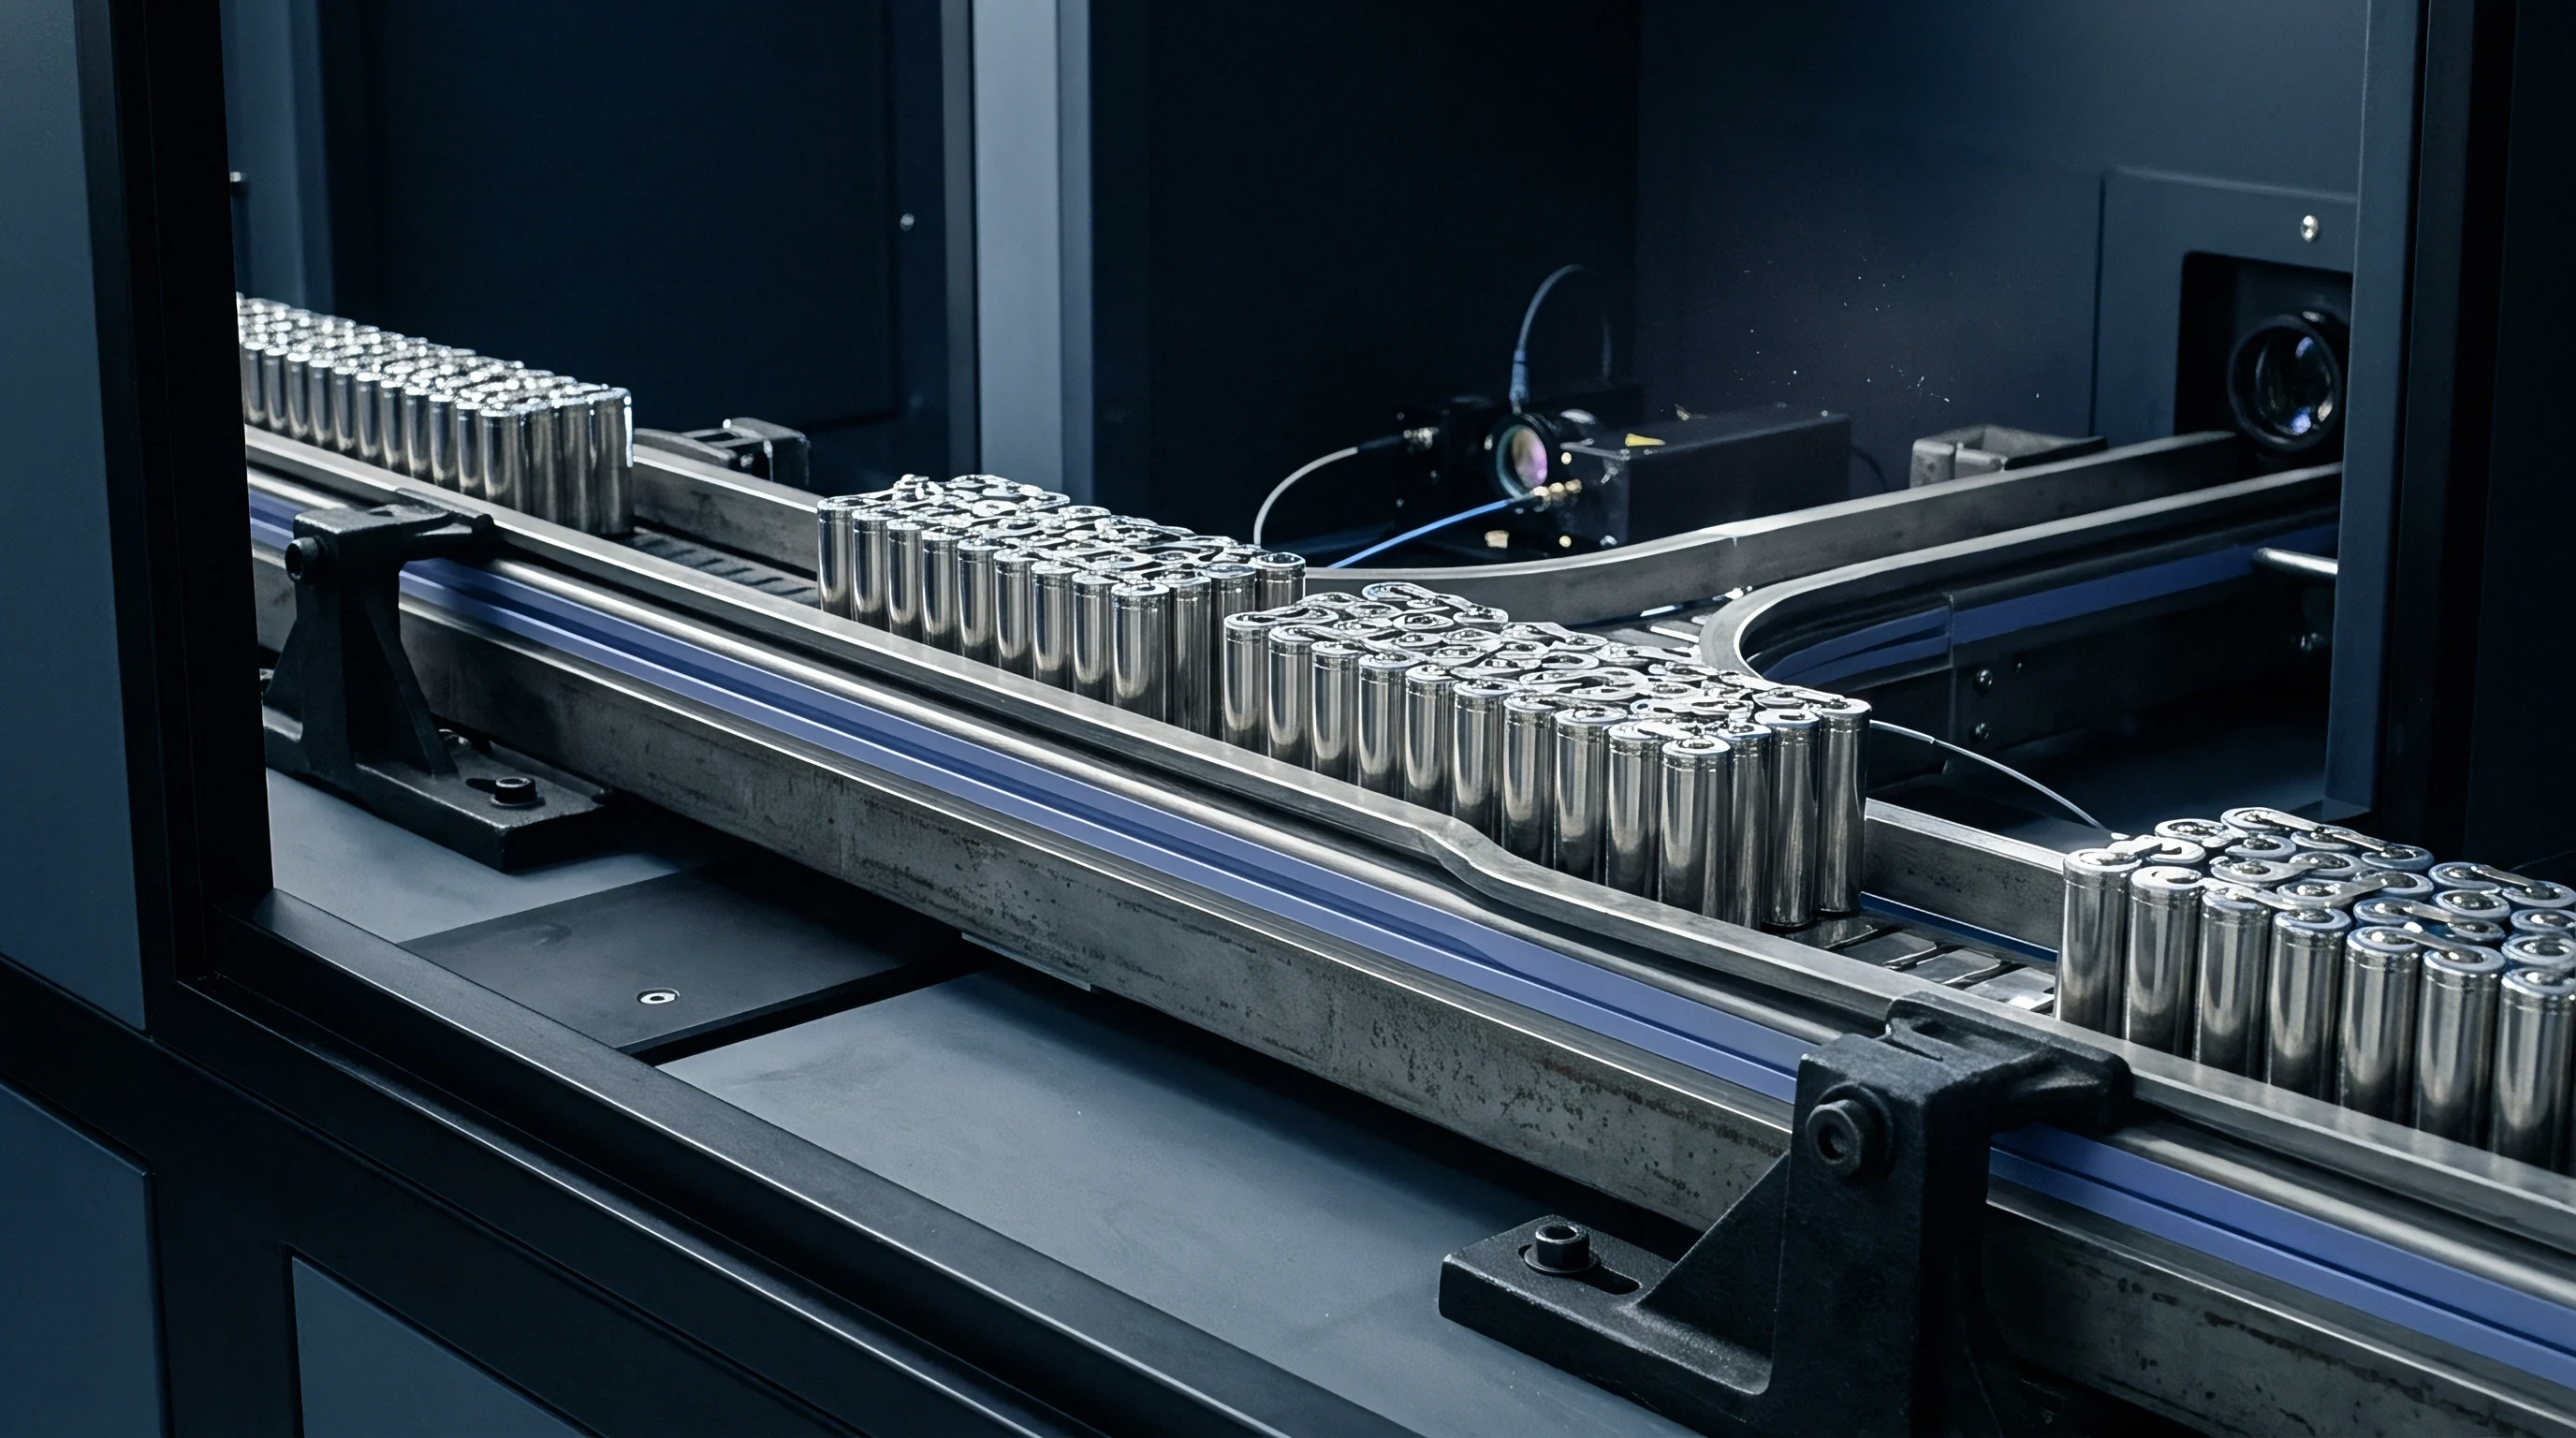
Clamp
Mass production of lithium-ion cells depends heavily on clean physical contact during final formation and automated capacity grading. In formation cabinets holding thousands of individual test channels, mechanical contact pressure directly controls measurement accuracy. Shift contact resistance by even half a milliohm across a high-current discharge circuit, and terminal voltage readings change.
That voltage drop trips lower cut-off thresholds in automated cyclers too early, truncating the measured discharge capacity. High-volume plants process tens of thousands of cells every shift. At that throughput, automated pneumatic contact fixtures suffer from mechanical wear, surface oxidation, and thermal expansion.
If clamping systems fail to hold uniform force across cell tabs, the reported capacity distribution drifts, artificially stretching the apparent variance of an otherwise homogeneous chemistry batch.
Pneumatic actuators press gold-plated beryllium copper pins against bare aluminum or nickel-plated copper cell terminals. In automated grading trays, line pressure usually targets zero point four to zero point eight megapascals. Drop below that pressure, and microscopic air gaps form between the pin tip and terminal face, driving local contact resistance up from a nominal zero point one milliohm to as high as two point five milliohms.
During a high-rate capacity verification discharge cycle at one C, a three-ampere current flowing through an elevated two-milliohm resistance produces a six-millivolt drop across the measurement interface. On a three-wire or poorly calibrated contact setup, the cycler misreads this voltage drop as internal cell polarization. The cycler hits the lower cut-off voltage threshold ~ such as two point five volts for a lithium iron phosphate cell ~ earlier in the time domain, logging a capacity figure three to five percent below the true electrochemical energy stored within the active materials.
Kelvin sensing probes are designed to isolate current paths from voltage measurement lines. Four-wire sensing connects separate current delivery leads and high-impedance voltage sense lines straight to the cell tab. However, physical alignment errors inside high-throughput factory racks frequently ruin this isolation.
When pneumatic actuators drive probes onto tarnished or misaligned cell tabs, the current-carrying pin and the sense pin make microscopic contact before reaching the tab surface. That contact shorts the sense line directly into the main current loop, bleeding contact resistance artifacts into the voltage channel. Evaluating formation tray logs helps spot systematic channel offsets.
When recurring capacity deficits show up at specific tray positions, the root cause is almost always mechanical wear on the Kelvin pin springs or surface contamination on the probe tips, rather than a chemical defect in the cathode material.
Thermal management inside grading cabinets creates just as many measurement repeatability problems as mechanical contact. Electrochemical reactions display sharp temperature sensitivity. The ionic conductivity of liquid organic electrolytes, such as ethylene carbonate blended with ethyl methyl carbonate containing lithium hexafluorophosphate, rises as ambient temperature climbs.
A cell sitting at thirty degrees Celsius exhibits lower charge transfer resistance across the solid electrolyte interphase and higher lithium-ion diffusivity within the graphite anode than the same cell tested at twenty degrees Celsius. Standard grading protocols mandate tight chamber control, usually specifying twenty-five degrees Celsius within a tolerance band of plus or minus one degree. In practice, large cabinets holding five hundred cell slots develop pronounced internal thermal gradients.
Exhaust fan airflow varies across vertical and horizontal rack axes, leaving pockets of warm and cool air throughout the cabinet.
Upper rack positions often run two to three degrees warmer than lower slots situated near the main chilled air inlets. A cell graded near the top at twenty-eight degrees Celsius delivers slightly higher discharge capacity and lower internal resistance than an identical unit sitting in a lower channel at twenty-two degrees Celsius. Factory software records these two cells into different commercial capacity sub-bins based entirely on fixture location.
Their internal chemistry remains identical, yet rack dynamics enforce a fake performance gap. Quality control requires continuous thermal mapping across all test channels. Thermocouples attached to dummy cells in top, middle, and lower shelf positions track temperature stability over full eight-hour shifts.
Without active thermal compensation within the cycler software, channel-to-channel thermal variance skews the capacity grading standard deviations reported on factory quality certificates.
- Pneumatic drive cylinders undergo mechanical calibration every seventy-two operating hours to maintain clamping forces within five percent of targeted megapascals.
- Spring-loaded beryllium copper contact pins are surface-cleaned with automated isopropyl alcohol spray bars after every fifty cycling passes.
- Four-wire impedance checks run across empty channels twice per day to detect pin wear before contact resistance exceeds zero point two milliohms.
- Thermal logging sensors mounted on reference aluminum blocks register ambient cabinet air temperature across twelve spatial zones every sixty seconds.
- Automated channel re-mapping algorithms exclude capacity measurements from channels displaying voltage sensing noise greater than zero point five millivolts.
Probe geometry directly dictates how long voltage readings remain accurate. Conical tips penetrate thin oxide layers on aluminum positive tabs far better than flat probe tips. The mechanical penetration creates a microscopic cold weld between the probe material and the tab substrate, establishing a low-resistance ohmic contact.
Flat probes depend entirely on pneumatic clamping force to crush surface oxides. Over thousands of insertion cycles, flat probes collect tab metal debris and ambient dust, building an insulating film across the contact zone. That film increases electrical noise right as charging transitions between constant current and constant voltage phases.
When noise disrupts the current decay measurement during constant voltage steps, the automated system terminates the charge phase prematurely. The cell enters its capacity discharge step undercharged by zero point two to zero point eight percent of its nominal state of charge, a deficiency downstream sorting systems interpret as a primary cathode coating weight defect.

Formation Cabinets and Contact Resistance Anomalies
Current distribution across large pouch cell tabs introduces complex spatial contact dynamics. High-capacity pouch cells built for electric vehicle modules use wide tabs, frequently exceeding eighty millimeters in width. Pressing a single point contact probe onto a wide tab forces the full charge and discharge current through a narrow region of thin metallic foil.
Localized current density spikes generate heavy Joule heating right at the tab junction, raising tab temperatures five to ten degrees Celsius above the main cell body. Heat generated at the tab conducts inward toward the internal jelly-roll or stack structure, altering local electrolyte resistance near the tab seals. Multi-point contact bars or wide-faced clamping pads distribute current uniformly across the entire tab width and eliminate these heating artifacts.
High-speed assembly lines often choose narrow spring pins to simplify fixture mechanics, sacrificing thermal and measurement stability for mechanical simplicity.
Incorrect mechanical clamping force distorts physical cell structures during formation swelling. Pouch cells expand slightly in thickness during initial formation as lithium ions intercalate into the graphite anode, driving volume changes up to four to six percent. Continuous rigid mechanical restraint during this phase prevents localized gas pocket formation between separator layers.
If a grading fixture applies insufficient or uneven clamping pressure, solid electrolyte interphase formation becomes non-uniform across the electrode surface. Regions under lower compression build up thicker solid electrolyte interphase layers, increasing local charge transfer impedance. Conversely, clamping pressure exceeding one megapascal crushes separator pores, restricting local electrolyte access and slowing lithium-ion transport.
The factory fixture must maintain dynamic pressure control, flexing slightly to accommodate chemical swelling while maintaining steady target contact pressure throughout the full charge and discharge cycle window.
Testing fixture maintenance records show significant drops in measurement repeatability as hardware ages. High-volume manufacturing plants running twenty-four hours a day subject contact probes to continuous mechanical shock and thermal cycling. Micro-arcs occurring during cell insertion and removal ~ when channels carry residual trickle voltage ~ pit the contact surfaces.
Pitted surfaces trap atmospheric moisture and vaporized electrolyte leaking from unsealed cell fill ports during preliminary formation. Hydrofluoric acid traces formed when electrolyte reacts with humid air eat through gold plating, exposing the underlying copper alloy to rapid oxidation. Oxidized pins elevate channel failure rates, forcing automated re-test loops that degrade overall plant throughput.
Sourcing contracts specifying strict cell capacity tolerances must also mandate audited maintenance intervals for all channel contact hardware within the supplier facility.

Kelvin Probe Geometry and Pin Thermal Drift
Thermal expansion of contact assemblies introduces systemic drift during extended testing runs. Continuous high-current operation elevates internal temperatures in testing cabinet switches, busbars, and contact boards. As copper busbars heat up, thermal expansion shifts physical alignment between stationary pneumatic actuators and cell carrier trays.
Alignment shifts as small as zero point three millimeters force spring-loaded Kelvin pins to seat at oblique angles against cell tabs. Off-center seating cuts the actual contact surface area and multiplies localized contact resistance by factors of three to five. The voltage sensing tip shifts off its dedicated landing pad, coming down on the current-carrying pin housing or high-resistance oxidation zones near the tab edge.
The recorded voltage trace displays step-change noise spikes, triggering false over-voltage or under-voltage safety shutoffs inside the cycler control software.
| Parameter Metric | Nominal Value | Upper Tolerance Threshold | Observed Measurement Offset | Primary Root Cause |
|---|---|---|---|---|
| Contact Pressure | 0.5 MPa | 0.8 MPa | -1.2% Nominal Capacity | Separator Pore Compression |
| Pin Resistance | 0.15 mΩ | 0.50 mΩ | -0.8% Nominal Capacity | Surface Oxidation and Pitting |
| Cabinet Temp Delta | ±0.5 °C | ±2.5 °C | +1.5% Capacity Variance | Non-Uniform HVAC Airflow Distribution |
| Tab Alignment Shift | ±0.1 mm | ±0.5 mm | -2.1% Nominal Capacity | Kelvin Probe Shorting to Current Loop |
| Voltage Noise Floor | 0.1 mV | 1.0 mV | -0.4% Nominal Capacity | Premature Cut-off Triggering |
Modern formation cyclers use built-in software filters to correct for measurement noise, but mathematical smoothers often mask underlying mechanical degradation. Moving average voltage filters smooth short-duration noise spikes caused by poor pin contact, preventing unnecessary step terminations. However, these algorithms also smooth out the rapid voltage roll-off that occurs as a cell reaches its true physical lower cut-off limit.
The software calculates total integrated capacity based on smoothed time-series data, introducing a small mathematical bias into the final amp-hour value. Over millions of rated cells, a constant positive bias of zero point three percent shifts sub-marginal cells into higher commercial grades, creating silent quality risks for pack integration. Independent qualification checks must audit raw high-frequency voltage and current data streams prior to algorithm smoothing to verify the absolute accuracy of reported factory binning data.
Uncontrolled ambient room humidity speeds up contact degradation inside high-volume factory zones. Production lines situated in regions with extreme seasonal humidity changes experience fluctuating condensation rates on chilled cabinet components. Water droplets interacting with ambient dust particles form conductive pathways across adjacent contact channels on multi-cell testing boards.
Creepage currents between channels alter current measurement shunts, causing cycler calibration offsets. High precision current shunts rely on stable ambient conditions to measure discharge current within zero point zero five percent accuracy. Moisture-induced thermal and electrical drift across current shunts skews the numerical integration of discharge current over time, directly corrupting the calculated ampere-hour capacity value delivered by the factory database.
Thermal Soaking Windows in High-Throughput Sorting
Cell thermal equilibration rules govern the valid execution of capacity grading cycles. Following high-temperature aging or formation, cells enter grading halls at temperatures ranging from thirty-five to forty-five degrees Celsius. Placing a warm cell immediately onto a grading channel yields artificially inflated capacity figures.
Thermal soaking requires holding cell trays in climate-controlled staging zones to allow internal cell temperature to normalize to twenty-five degrees Celsius. The time required for full thermal equilibration depends heavily on cell form factor and volumetric mass density. Compact cylindrical 18650 cells stabilize within ninety minutes, whereas large fifty-ampere-hour prismatic cells require four to six hours to eliminate internal thermal gradients between core and outer casing.
Automated grading channels failing daily zero point calibration consistently shift true capacity standard deviations into lower margin commercial tiers.
High-throughput production targets push factory managers to compress thermal soaking windows. Reducing soak times from four hours down to two hours for large prismatic cells leaves internal core temperatures elevated by three to five degrees Celsius above the outer skin when testing starts. As the cell discharges, elevated core temperature lowers internal ionic impedance, masking cathode manufacturing variations that would otherwise appear under standard ambient conditions.
The cell registers a capacity meeting Grade A specifications while operating warm. Once shipped, cooled to true twenty-five-degree ambient environments, and integrated into multi-cell modules, the cell displays elevated internal resistance and lower usable capacity than certified on the factory origin document. Sourcing engineers auditing factory operations must verify soaking window compliance via automated cell barcode timestamps recorded upon entry and exit of environmental staging zones.
Airflow velocity across cell surfaces during the thermal soaking window introduces further measurement variance. Cells placed near high-velocity forced air vents cool faster than cells stacked in stagnant central regions of storage pallets. Uneven cooling rates establish spatial temperature variations within a single production batch.
When the batch moves to automated grading, cells from outer pallet edges start testing at true thermal equilibrium, while cells from inner pallet zones retain residual internal heat. The resulting capacity measurement data produces a bimodal distribution curve, suggesting two distinct material lots when the true cause stems entirely from inconsistent cooling airflow exposure. Factory environmental design must specify low-velocity laminar airflow systems across all thermal soaking racks to achieve uniform thermal stabilization across every pallet layer.
Continuous monitoring of internal cell temperature during discharge cycles provides a definitive check against thermal soaking failures. Advanced testing channels incorporate non-contact infrared temperature sensors aimed directly at the center of each cell casing. If the skin temperature of a cell drops during the initial phase of a discharge cycle, the cell was loaded into the fixture at a temperature above ambient room conditions.
The cycler logs this negative temperature derivative as an environment error flag, voiding the test run and returning the cell tray to the thermal soaking queue. Implementing automated physical derivative checks eliminates human error and scheduling shortcuts on the plant floor, protecting the integrity of reported capacity data prior to commercial cell sorting.
Factory line arguments for channel-to-channel capacity spreads often point to high line speeds requiring dynamic mathematical normalization across variable cabinet environments, relying on continuous sensor-driven software adjustments to bridge the gap between non-standard cabinet temperatures and certified rating standards. However, software-based environmental corrections consistently underreport capacity degradation in cells with higher baseline internal resistance, disguising mechanical assembly defects under algorithmic data smoothing.

Grade
Electrochemical capacity sorting establishes the commercial value of manufactured lithium-ion cells. After formation, aging, and thermal stabilization, every cell undergoes standard capacity verification cycling to assign its final quality grade. Grade A cells meet narrow capacity bands around nominal rating, tight internal resistance thresholds, and low self-discharge rates.
Grade B cells exhibit minor capacity deficits, wider impedance spreads, or elevated self-discharge profiles, making them unsuitable for demanding automotive applications while remaining viable for low-rate stationary storage. Tier one factories utilize automated sorting networks to process cells into specific capacity bins, often separated by increments of just zero point five percent of total nominal Ah rating. The statistical distribution of these bins reflects the precise control of active material coating weight, slurry viscosity, and electrode calendering thickness across the front-end chemical manufacturing process.
Sorting distributions reveal process control. In a highly controlled manufacturing plant, capacity output follows a narrow Gaussian distribution centered slightly above the cell datasheet nominal specification. A nominal one-hundred-ampere-hour cell line targets a mean output of one hundred three ampere hours, providing a safety margin against manufacturing fluctuations.
The three-sigma standard deviation for a tier one production line remains within zero point five percent of the mean value. When slurry mixing inconsistencies or coating thickness variations occur on the electrode line, the capacity distribution widens, displaying an asymmetric skew toward lower capacity values. Cells falling below ninety-eight percent of nominal rating are discarded or re-sorted into secondary commercial channels.
Tight capacity grading limits prevent cell capacity imbalance inside series-connected battery packs, where the weakest cell dictates the usable energy window of the complete battery system.
Cell capacity binning relies on precisely calibrated charge and discharge regimes. Standard factory grading protocols apply a constant current charge at zero point five C rate up to the upper voltage limit, followed by a constant voltage hold until current decays to zero point zero two C. After a thirty-minute rest period, the cycler applies a constant current discharge at one C rate down to the minimum cutoff voltage. Discharge capacity is calculated via precise current integration over time.
Minor variations in upper voltage cut-offs severely alter measured values. For nickel manganese cobalt chemistries, an upper cut-off shift of just ten millivolts alters delivered capacity by zero point four percent due to the steep slope of the open circuit voltage curve near full state of charge. Standard calibration protocols enforce zero point zero five percent voltage measurement accuracy across all cycler channels.
Internal impedance sorting occurs concurrently with capacity grading. Direct current internal resistance measurements calculate voltage drop in response to a high-current discharge pulse. A typical protocol applies a ten-second pulse at two C rate from a fifty percent state of charge base point.
The recorded voltage step divided by the applied pulse current yields the internal resistance value in milliohms. Cells displaying elevated internal resistance despite meeting capacity requirements are downgraded. High internal resistance indicates inadequate electrolyte wetting, localized binder accumulation on current collectors, or improper tab welding junctions.
These structural micro-defects accelerate localized degradation over long-term field operation, causing early capacity fade and localized heat generation under heavy load profiles.
- Nominal Bin Limits maintain maximum plus or minus zero point five percent total capacity variance from targeted batch mean values.
- Voltage Relaxation Slopes identify internal micro-shorts by tracking open circuit voltage drop over a fourteen-day room temperature aging period.
- Pulse Impedance Bounds restrict ten-second direct current internal resistance values within a zero point two milliohm window across the batch population.
- Coulombic Efficiency Ratios flag active lithium loss during initial charge-discharge passes when efficiency metrics fall below ninety-nine point eight percent.
- Geometric Casing Variance isolates physical cell swell prior to grading, removing mechanically deformed units from automated testing lines.
Self-discharge rate determination, quantified as the K-value, forms the third column of cell capacity grading. Following capacity verification, cells undergo a secondary storage period ranging from seven to twenty-one days at controlled room temperature. The open circuit voltage is recorded at the start and end of this aging window.
The K-value represents the daily voltage drop rate expressed in millivolts per day. Standard Grade A cells display K-values below zero point five millivolts per day. Cells exhibiting K-values exceeding one point five millivolts per day contain microscopic internal contamination, such as metallic iron particles introduced during electrode slitting.
These micro-contaminants form localized dendrites that breach the separator, creating slow self-discharge pathways that eventually evolve into severe internal short circuits.

Gaussian Capacity Distribution across Formation Lots
Statistical process control metrics quantify factory stability across sequential manufacturing lots. Process capability index Cpk measures the relationship between manufacturing tolerances and actual process distribution. A tier one factory targets a Cpk greater than one point three three for cell capacity output.
A Cpk of one point three three indicates that the statistical capacity spread sits comfortably within upper and lower engineering specification limits, producing fewer than sixty-four defective units per million produced. If coating line blade wear causes electrode thickness variations, the capacity mean shifts, reducing the Cpk value. Sourcing agreements specifying minimum acceptable Cpk values force suppliers to maintain continuous control over raw material feeding, slurry viscosity, and calendering roll gap settings.
Electrode coating weight variations directly drive capacity variance across cell batches. Double-sided coating lines apply cathode slurry onto aluminum foil substrates at speeds exceeding fifty meters per minute. Laser thickness gauges continuously measure wet and dry coating thickness across the foil width.
If wet slurry viscosity shifts due to ambient temperature changes in the mixing room, coating density varies across the transverse axis of the foil roll. Electrodes cut from the outer edges of the roll exhibit different active mass loads compared to electrodes cut from the central zone. When assembled into finished cells, these mass variations translate into a broadened capacity distribution curve.
Advanced factories deploy automated closed-loop feedback systems, adjusting doctor blade gaps in real time based on down-line laser measurement data to suppress mass variance.
| Commercial Grade | Capacity Range (% Nominal) | Max DCIR (mΩ) | Max K-Value (mV/day) | Commercial Pricing Factor |
|---|---|---|---|---|
| Grade A+ | 101.5% – 103.0% | 0.45 | 0.30 | 1.05x Base Price |
| Grade A | 100.0% – 101.5% | 0.55 | 0.50 | 1.00x Base Price |
| Grade A- | 98.5% – 99.9% | 0.65 | 0.80 | 0.92x Base Price |
| Grade B | 95.0% – 98.4% | 0.85 | 1.50 | 0.75x Base Price |
| Scrap / Recycle | < 95.0% | > 0.85 | > 1.50 | 0.15x Material Value |
Active material stoichiometry introduces secondary capacity shifts across production batches. Cathode precursor powders exhibit batch-to-batch variations in nickel, manganese, and cobalt molar ratios. A zero point five percent shift in nickel content alters maximum reversible lithium intercalation capacity per gram of active material.
When a factory transitions from one raw material precursor lot to another, the baseline capacity mean of the finished cells shifts slightly, even if electrode coating thickness remains strictly identical. Tier one facilities isolate incoming raw material lots into distinct production runs, recalibrating the automated grading software to align sorting bin thresholds with the specific stoichiometric potential of the active raw material batch.

Direct Current Internal Resistance Binning Thresholds
Direct current internal resistance reflects the total structural ohmic impedance and charge transfer kinetics of the complete cell system. Measuring resistance at a single point in time captures only a static snapshot of dynamic electrochemical performance. Advanced grading channels apply multi-pulse frequency sequences to differentiate between metallic tab contact resistance, electrolyte ionic transport resistance, and charge transfer resistance at the electrode-electrolyte interface.
High tab resistance points to improper ultrasonic or laser welding settings during tab-to-busbar assembly. High charge transfer resistance points to incomplete solid electrolyte interphase formation or surface degradation of cathode active particles. Categorizing resistance sources allows factory engineers to isolate mechanical assembly faults from chemical coating anomalies.
State of charge selection alters pulse resistance measurement sensitivity. Direct current internal resistance measurements conducted at high states of charge, such as eighty to one hundred percent, exhibit low baseline impedance values, masking subtle differences between good and marginal cells. Conducting pulse testing at lower states of charge, specifically twenty to thirty percent, amplifies impedance variations.
At low states of charge, lithium concentration gradients within active particles steepen, causing charge transfer resistance to rise sharply. Micro-structural defects inside the active material layer produce pronounced voltage drops during low state of charge pulse tests. Factory grading procedures targeting high-performance applications incorporate a dual-point resistance test, recording impedance at both fifty percent and twenty percent states of charge to capture comprehensive cell operational characteristics.
A nickel manganese cobalt pouch cell tested at one C discharge yields three point two ampere hours at twenty five degrees Celsius but loses forty milliampere hours when ambient rack temperature drops to twenty one degrees.
Electrolyte fill volume variations directly shift internal impedance metrics across finished cell lots. Liquid electrolyte acts as the sole ionic conductor bridging cathode and anode active layers. Insufficient electrolyte fill volume leaves central regions of the dense electrode roll un-wetted.
Dry zones reduce effective active surface area, forcing charge current through remaining wetted regions and elevating local current density. Elevated local current density increases overall measured cell internal resistance while accelerating localized lithium plating during charge cycles. Automated electrolyte injection systems measure fill mass within zero point zero one gram precision.
Despite precise volumetric dosing, variations in separator porosity or electrode compaction density alter liquid absorption rates. Cells failing to absorb target electrolyte volumes exhibit elevated pulse impedance during initial grading and are flagged for automatic downgrade.

Does Ambient Air Velocity Skew High Rate Grading?
High discharge rates applied during capacity grading generate non-uniform internal heat within test cells. When a fifty-ampere-hour cell discharges at a one C rate, internal heat generation can elevate core temperature by eight to twelve degrees Celsius over a sixty-minute discharge window. Forced air circulation systems inside grading cabinets remove this heat via convection from the cell surface.
Variations in local air velocity across different channels alter heat transfer rates. A cell positioned in a channel with high air velocity transfers heat rapidly, maintaining a lower casing temperature. Lower temperature increases internal electrolyte viscosity and charge transfer resistance, yielding a lower capacity output measurement.
Conversely, a cell sitting in a low airflow channel heats up rapidly during discharge. Elevated cell temperature lowers internal resistance and enhances ionic transport, yielding higher measured capacity output. The apparent capacity difference between these two identical cells stems entirely from localized air cooling variations within the test chamber.
To prevent air velocity artifacts from corrupting grading data, tier one factories deploy environmental chambers utilizing closed-loop laminar airflow controls. Laminar flow design ensures identical convective heat transfer coefficients across every test channel slot, eliminating air velocity as a confounding variable in high-rate capacity verification.
Cell orientation within convective air streams introduces additional spatial thermal variations. Vertical mounting of pouch cells allows natural thermal convection currents to rise along the cell surface, accelerating heat dissipation near the top edge of the cell. Horizontal mounting traps heated air along the underside face of the cell casing, establishing an asymmetric temperature gradient between top and bottom active layers.
Asymmetric temperature distribution causes uneven current density distribution across the electrode plates during high-rate discharge. Upper active layers operate at cooler temperatures with lower local capacity utilization, while warmer lower active layers sustain higher current density and experience accelerated degradation. Standardized factory protocols mandate uniform cell mounting orientation across all grading racks to maintain repeatable convective boundary conditions.

Electrolyte Stabilization and Voltage Relaxation Windows
Voltage relaxation tracking after formation cycling reveals subtle chemical instability inside newly manufactured cells. Immediately following charge or discharge steps, cell terminal voltage reflects both thermodynamic open-circuit potential and transient concentration polarization gradients within the electrolyte. True thermodynamic open-circuit voltage appears only after chemical species diffuse evenly across active layers and polarization dissipates.
The time required for full voltage stabilization ranges from twenty-four to seventy-two hours depending on electrolyte formulation and micro-porous separator tortuosity. Automated sorting networks track the decay slope of terminal voltage during post-grading rest periods to compute high-precision relaxation curves.
Tracking voltage relaxation curves across forty-eight hours of room temperature aging highlights subtle chemical instabilities. Anomalous relaxation curves indicate incomplete solid electrolyte interphase formation or continuous chemical side reactions between electrolyte solvents and delithiated cathode surfaces. Cells displaying prolonged voltage decay times over the forty-eight-hour rest window continue to consume active lithium ions through parasitic side reactions.
These side reactions thin the usable lithium inventory prior to customer delivery, reducing long-term cycle life capacity retention. Automated sorting routines flag cells exhibiting irregular voltage relaxation decay constants, excluding them from primary commercial shipment lots regardless of whether their initial discharge capacity met nominal rating specs.
Mathematical modeling of open-circuit voltage decay curves enables early identification of defective units without requiring extended aging holds. Exponential decay fitting algorithms extrapolate seventy-two-hour equilibrium voltages from initial twelve-hour relaxation data streams. If the predicted equilibrium voltage falls below baseline statistical thresholds, the cell moves to an isolated secondary testing queue.
Implementing predictive voltage decay modeling reduces mandatory factory inventory holding times from fourteen days down to five days, significantly lowering working capital requirements for high-volume manufacturing facilities while preserving outgoing quality control standards.
Unresolved questions remain regarding how microscopic electrolyte decomposition products generated during high-voltage formation steps alter long-term capacity relaxation kinetics. While baseline grading protocols isolate obvious self-discharge anomalies, subtle variations in parasitic gas dissolution rates between different electrolyte additive packages introduce unquantified noise into automated K-value calculations. Sourcing practices must account for these subtle chemical variables when comparing capacity retention claims across competing tier one battery suppliers.


Ledger
Commercial contracts for bulk lithium-ion cell procurement translate electrochemical measurement tolerances into direct financial obligations. When a buyer commits millions of dollars to a multi-gigawatt-hour supply agreement, minor deviations in certified cell capacity alter the landed economics of the battery project. A certified one percent deficit in average delivered capacity across a one-gigawatt-hour order represents ten megawatt-hours of missing storage capacity.
At prevailing commercial prices of one hundred dollars per kilowatt-hour, this deficit imposes a direct financial loss of one million dollars before pack integration begins. Sourcing engineers must structure purchase specifications to bind suppliers to strict statistical capacity distributions rather than relying on loose nominal datasheet ratings.
Nominal capacity ratings published on cell datasheets frequently represent optimistic best-case manufacturing outputs rather than guaranteed delivered averages. Datasheets state nominal capacity alongside a minimum capacity threshold, often separated by a margin of two to three percent. Tier one factories use this gap to absorb normal production variance.
If a supplier ships a batch where every cell meets the bare minimum capacity threshold, the shipment remains legally compliant under a basic minimum specification clause. The buyer receives a batch delivering two percent less total energy than modeled in their system architecture. Standard supply contracts must explicitly stipulate that the batch mean capacity must equal or exceed the nominal rating, treating the minimum threshold as a non-conformance drop line rather than an acceptable delivery average.
Batch variance controls pack engineering margins. In multi-cell pack configurations, series-connected cell strings are constrained by the lowest capacity cell in the string. If a pack integrates ninety-six series cells with a capacity spread ranging from ninety-eight to one hundred two ampere hours, the pack BMS terminates discharge when the weakest ninety-eight-ampere-hour cell hits its lower cut-off voltage.
The remaining four ampere hours of capacity present in the stronger cells remains unusable. Sourcing contracts incorporating tight binning clauses enforce narrow capacity bands, such as plus or minus zero point five percent, within any individual delivery lot. Enforcing tight lot uniformity minimizes usable energy loss inside final pack assemblies, protecting system-level performance without requiring complex active capacity balancing electronics.
Landed cost calculations must incorporate testing methodology discrepancies between factory certification lines and buyer incoming inspection channels. Factories certify capacity using low C-rates, elevated ambient temperatures, and wide voltage windows designed to maximize reported Ah figures. Incoming inspection teams test cells under realistic operating conditions, using lower ambient temperatures and stricter upper and lower voltage buffers to preserve long-term pack life.
These operational constraints reduce delivered usable capacity compared to factory origin certificates. Contract terms must define explicit qualification test procedures, specifying exact charge/discharge profiles, rest periods, thermal environments, and cut-off criteria that govern commercial acceptance and invoice settlement.
- Statistical Sampling Protocol establishes mandatory ISO 2859-1 inspection levels and lot size ratios for incoming container validation.
- Capacity Deficit Penalty Clause defines direct financial offsets calculated per delivered kilowatt-hour missing from contract baseline averages.
- Lot Uniformity Boundaries restrict total allowable capacity standard deviation within an individual shipping container to zero point five percent.
- Independent Arbitration Procedure details accredited third-party laboratory verification methods executed when buyer and supplier test data diverge.
- Warranty Reserve Index ties supplier financial retenue funds directly to verified field capacity retention data collected over twenty-four months.
Financial exposure extends into logistics and transport duty categories. Customs tariffs and dangerous goods freight charges scale based on physical cell weight and gross volumetric shipment dimensions rather than actual energy delivered. Shipping sub-nominal capacity cells incurs full freight costs per unit weight while delivering lower net commercial value at the destination port.
A two percent landed cost penalty occurs when cell variance expands beyond contract specification. When accounting for international marine freight, port handling fees, customs duties, and inland transport costs, importing low-energy density or sub-nominal cell lots significantly increases the total cost per delivered usable kilowatt-hour at the customer integration facility.
Acceptance Quality Limits and Statistical Sampling Rules
Receiving inspection procedures rely on statistical sampling frameworks to validate incoming cell lots without incurring the cost of hundred-percent re-testing. Standard acceptance sampling schemes adopt ISO 2859-1 standards, applying General Inspection Level II with Single Normal Sampling Plans. For a shipment of fifty thousand prismatic cells, an ISO 2859-1 level II plan selects a representative sample of five hundred cells for full capacity and impedance verification testing.
The Acceptance Quality Limit defines the maximum acceptable percentage of non-conforming units within the sample. A strict procurement contract specifies an AQL of zero point four zero for capacity defects, meaning if more than five cells in the five-hundred-unit sample fail capacity specs, the entire fifty-thousand-cell shipment faces immediate rejection.
Sampling risks fall into two distinct statistical categories. Producer risk, or alpha risk, represents the probability that incoming inspection rejects a high-quality cell lot due to random sampling variations. Consumer risk, or beta risk, represents the probability that incoming inspection accepts a sub-standard cell lot containing excessive non-conforming units.
Setting overly aggressive AQL thresholds elevates producer risk, prompting tier one suppliers to add risk premiums to baseline cell pricing. Setting loose AQL thresholds elevates consumer risk, exposing the buyer to high integration defect rates down-line. Balanced sourcing agreements define precise Operating Characteristic curves, aligning statistical sampling risks transparently between buyer and supplier.
Auditing incoming shipments with independent four-wire testing stations relies on automated receiving channels running standardized verification scripts that match origin factory parameters. If incoming test data reveals systematic capacity shifts compared to origin certificates, environmental conditions and channel calibration parameters undergo cross-verification. Divergence between origin certificates and destination receiving data usually stems from ambient temperature variations during shipping or subtle calibration offsets between factory cyclers and destination test equipment.
Contractual clauses requiring joint calibration checks using certified reference standard cells eliminate measurement equipment disputes before lot rejections are triggered.
Commercial Exposure from Nominal versus Delivered Capacity
Delivered energy arithmetic governs pack-level project margins. System integrators construct energy storage systems around specific megawatt-hour rating targets promised to end-use customers. If an integrator purchases cells based on optimistic nominal ratings and discovers a two percent delivered capacity deficit during pack commissioning, they must add extra cell modules or augmentation strings to fulfill their contractual energy delivery guarantees.
Adding hardware late in the build process consumes spare physical enclosure space, overburdens thermal management cooling loops, and destroys project profit margins. Writing explicit delivered energy guarantees into cell supply contracts shifts the financial burden of capacity shortfalls back to the cell manufacturer.
| Variance Scenario | Mean Lot Capacity (Ah) | Usable Energy Deficit (%) | Required Augmentation Cell Cost | Net Landed Cost per kWh |
|---|---|---|---|---|
| Tight Target (±0.5%) | 102.1 Ah | 0.0% | $0.00 / kWh | $108.50 / kWh |
| Standard Spread (±1.5%) | 100.2 Ah | -1.86% | +$2.15 / kWh | $110.65 / kWh |
| Wide Variance (±3.0%) | 98.5 Ah | -3.52% | +$4.20 / kWh | $112.70 / kWh |
| Sub-Nominal Outlier | 96.8 Ah | -5.19% | +$6.45 / kWh | $114.95 / kWh |
Pricing adjustment formulas tied to batch capacity averages establish equitable commercial terms for both transaction parties. Rather than enforcing binary accept-or-reject thresholds that disrupt factory delivery schedules, modern supply contracts utilize dynamic price sliding scales. If a delivered cell lot exhibits a mean capacity exceeding nominal specification by one percent, the supplier earns a structured pricing bonus based on delivered value.
Conversely, if the lot mean falls one percent below nominal rating while remaining above the absolute rejection floor, the invoice price drops proportionally per missing watt-hour. Dynamic price scales align commercial payments directly with delivered electrochemical energy, protecting buyer margins while rewarding supplier manufacturing precision.
Section 4.2 of the master supply agreement specifies that cell shipments containing more than two percent sub-nominal capacity units grant the buyer immediate return rights for the full lot.
Serial code traceability underpins commercial dispute resolution. Tier one factories laser-etch unique two-dimensional Data Matrix codes onto every cell casing prior to initial formation. This code links directly to factory database records storing full high-frequency formation data curves, cabinet channel IDs, thermal soaking room timestamps, and final grading bin assignments.
When an incoming inspection team flags a defective cell lot, scanning the matrix codes reveals whether the failing units originated from a specific formation cabinet shift or raw material coating lot. Granular traceability enables surgical lot rejections, isolating defective sub-lots while allowing validated compliant cells to proceed directly to integration assembly lines.
Warranty Reserve Arithmetic and Landed Cost Penalties
Long-term capacity fade warranties represent significant financial liabilities for both cell manufacturers and system integrators. Typical energy storage contracts guarantee that installed cells retain seventy or eighty percent of initial rated capacity over a ten-year operational lifecycle or a specific cumulative energy throughput count. The rate of capacity fade depends heavily on initial cell quality and lot uniformity.
A cell lot starting life with high capacity variance and elevated internal resistance degrades significantly faster than a tightly graded Grade A lot. High baseline internal resistance accelerates parasitic chemical side reactions and localized lithium plating during field operation, driving accelerated non-linear capacity degradation curves.
Integrators must calculate warranty reserve allocations based on delivered cell quality metrics. Integrating loosely graded cells requires holding higher financial warranty reserves to cover anticipated premature field failures and early pack augmentation requirements. A baseline warranty model allocates three to five percent of total project capital expenditure as a long-term warranty reserve fund.
If incoming cell inspection reveals elevated capacity variance or high pulse impedance spreads, the required warranty reserve allocation rises to eight or ten percent to offset calculated field degradation risks. Sourcing contracts that enforce strict origin grading standards allow integrators to minimize warranty reserve holdings, freeing up liquid capital for business expansion.
Third-party arbitration clauses protect procurement teams from prolonged legal stalemates when factory certification and buyer receiving data conflict. Standard contracts mandate sending contested cell samples to accredited independent electrochemistry testing facilities. The independent laboratory uses certified testing channels calibrated directly against international standard reference units.
The contract stipulates that the arbitration laboratory’s measurement results are final and legally binding on both parties, establishing clear financial liability for testing costs and sample shipping fees. Including explicit third-party arbitration terms prevents suppliers from using technical measurement ambiguities to delay legitimate warranty claims or batch rejection settlements.
Master supply agreements incorporate Section 8.3 governing lot rejection remedies: “If incoming statistical sampling executed under Section 4.2 reveals an average lot capacity deficiency exceeding one point five percent of certified nominal rating, buyer retains sole right to reject the shipment in full, forcing supplier to deliver replacement compliant lots within fourteen business days while assuming all associated import duty and freight costs.”