Distinguishing AC Impedance and DC Resistance in Prismatic Cell Quality Control
AC impedance screens tab welds at high speed while DC resistance predicts real operating voltage drop, thermal runaway risk, and pack degradation.

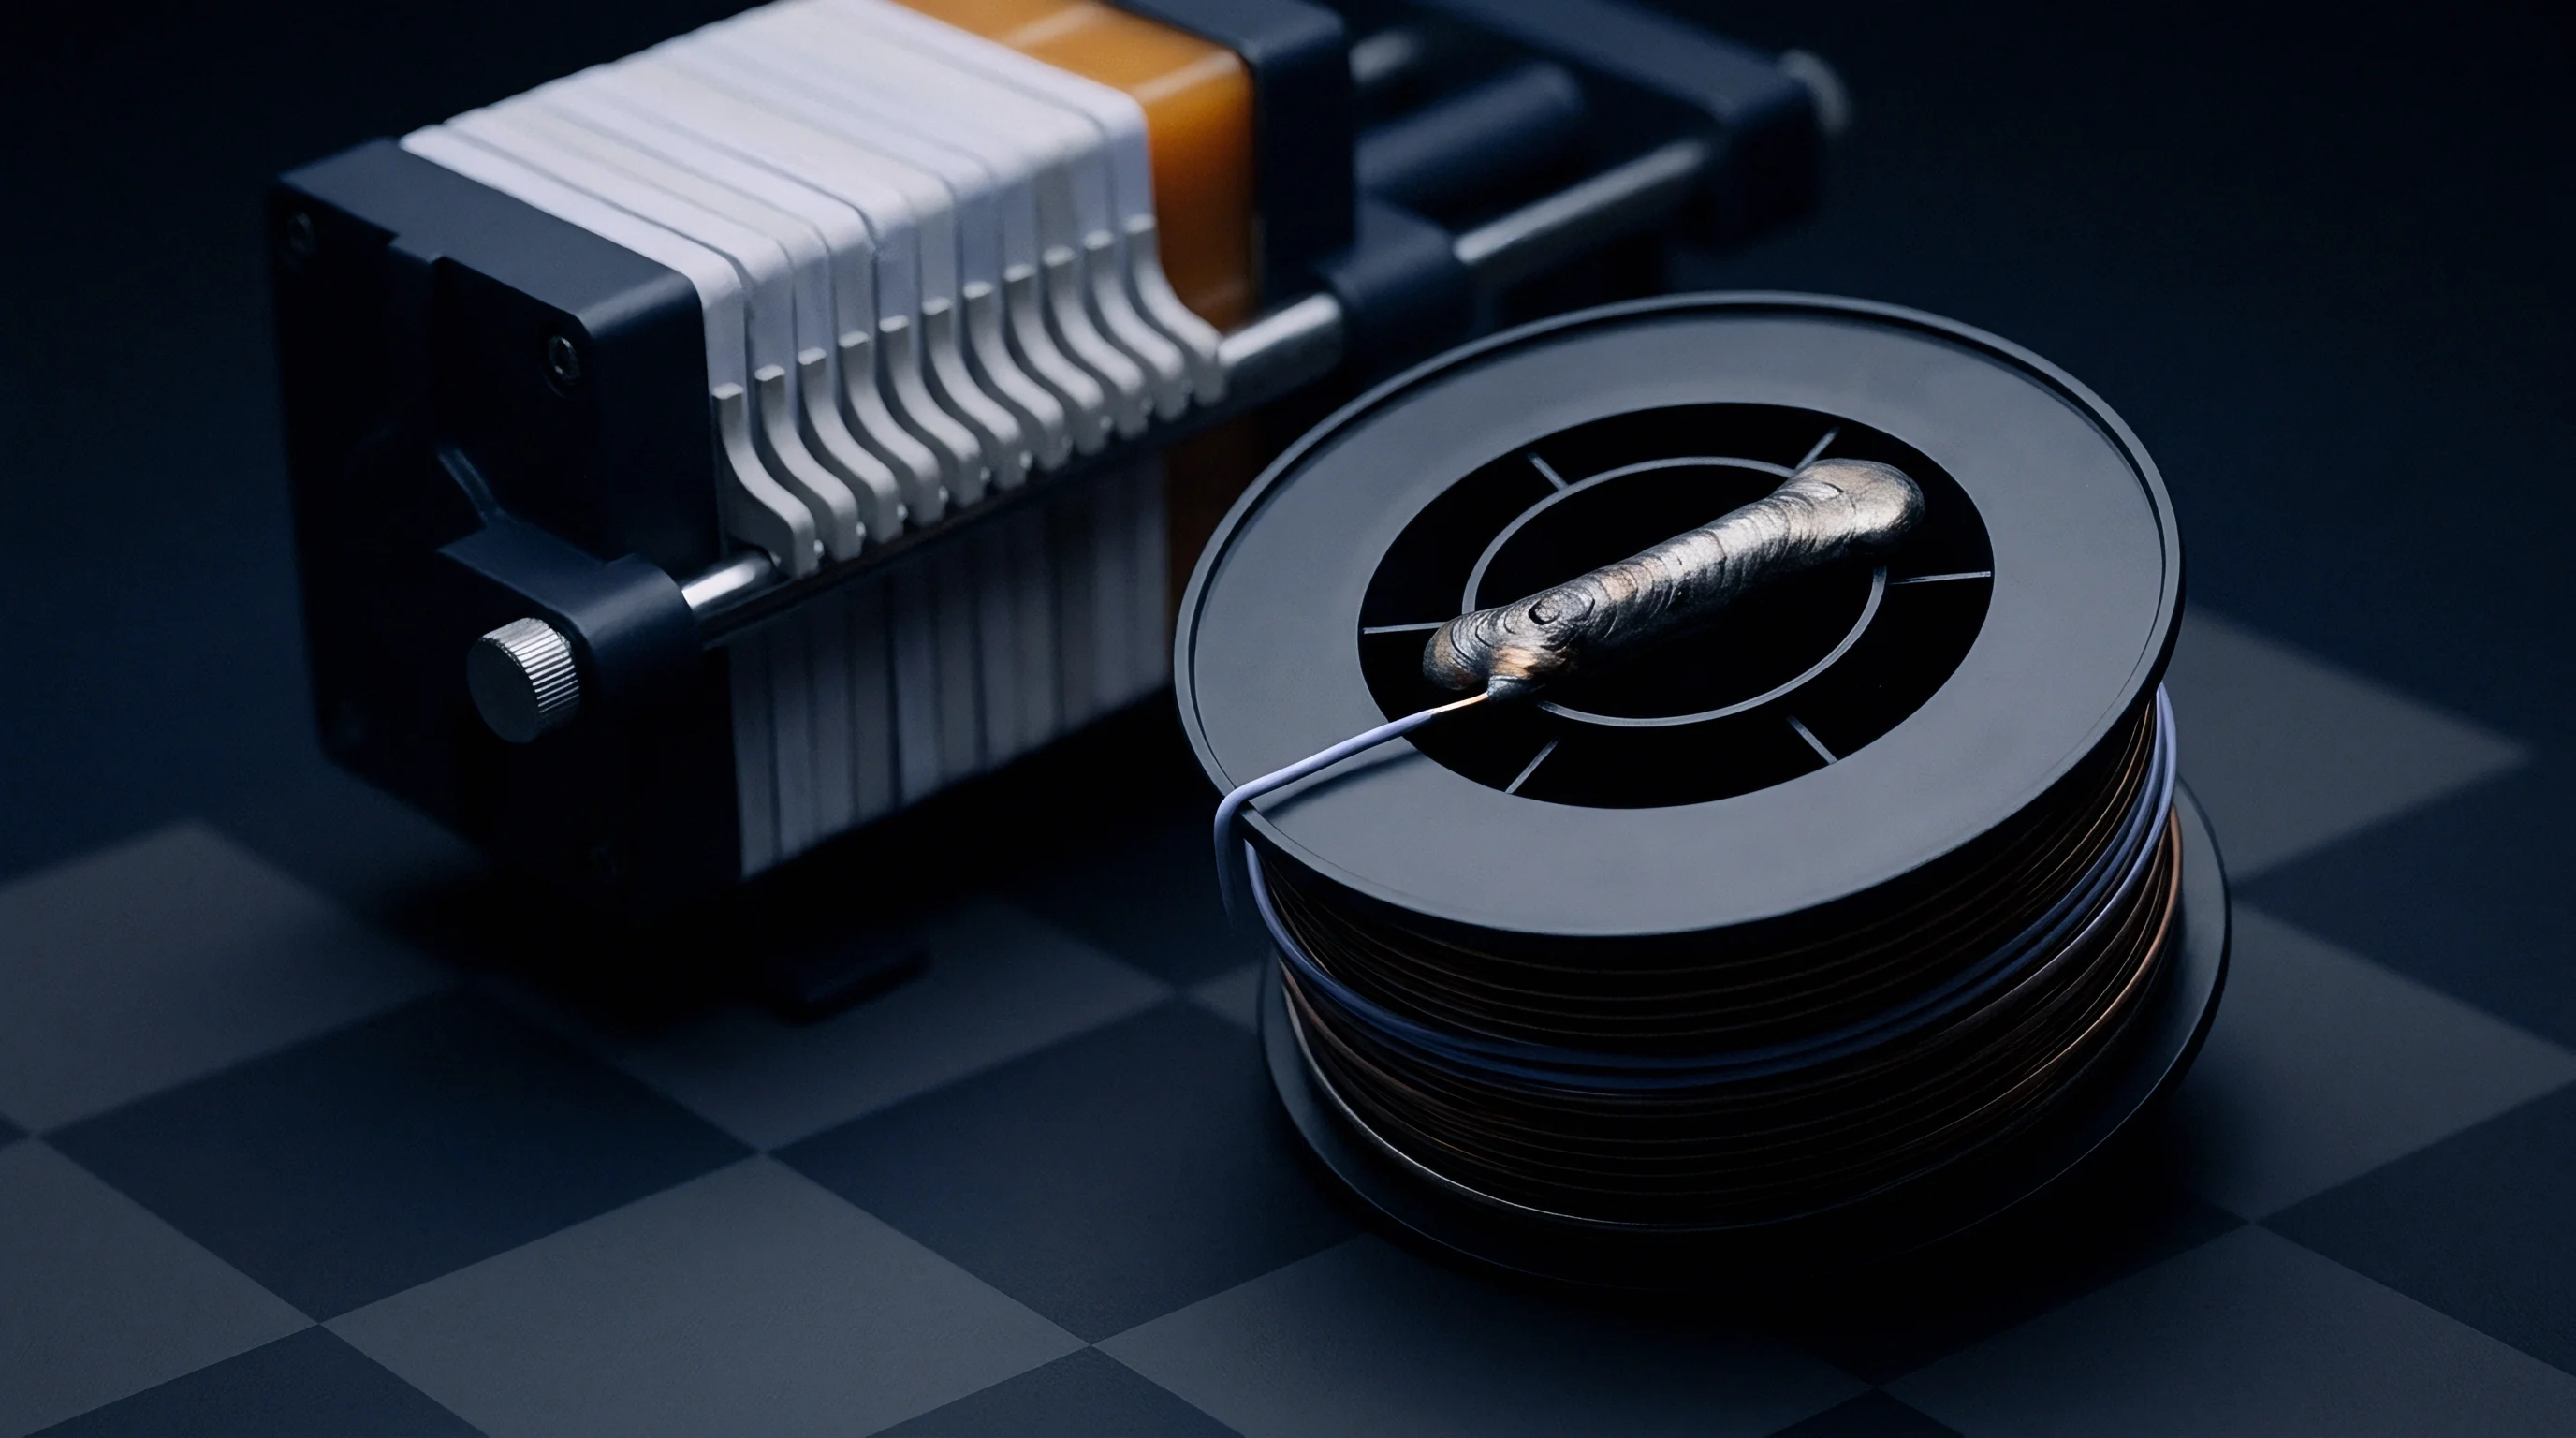
Frequency
Alternating current excitation across lithium-ion prismatic formats isolates high-rate conductive behavior inside the cell body. High frequencies bypass kinetics.
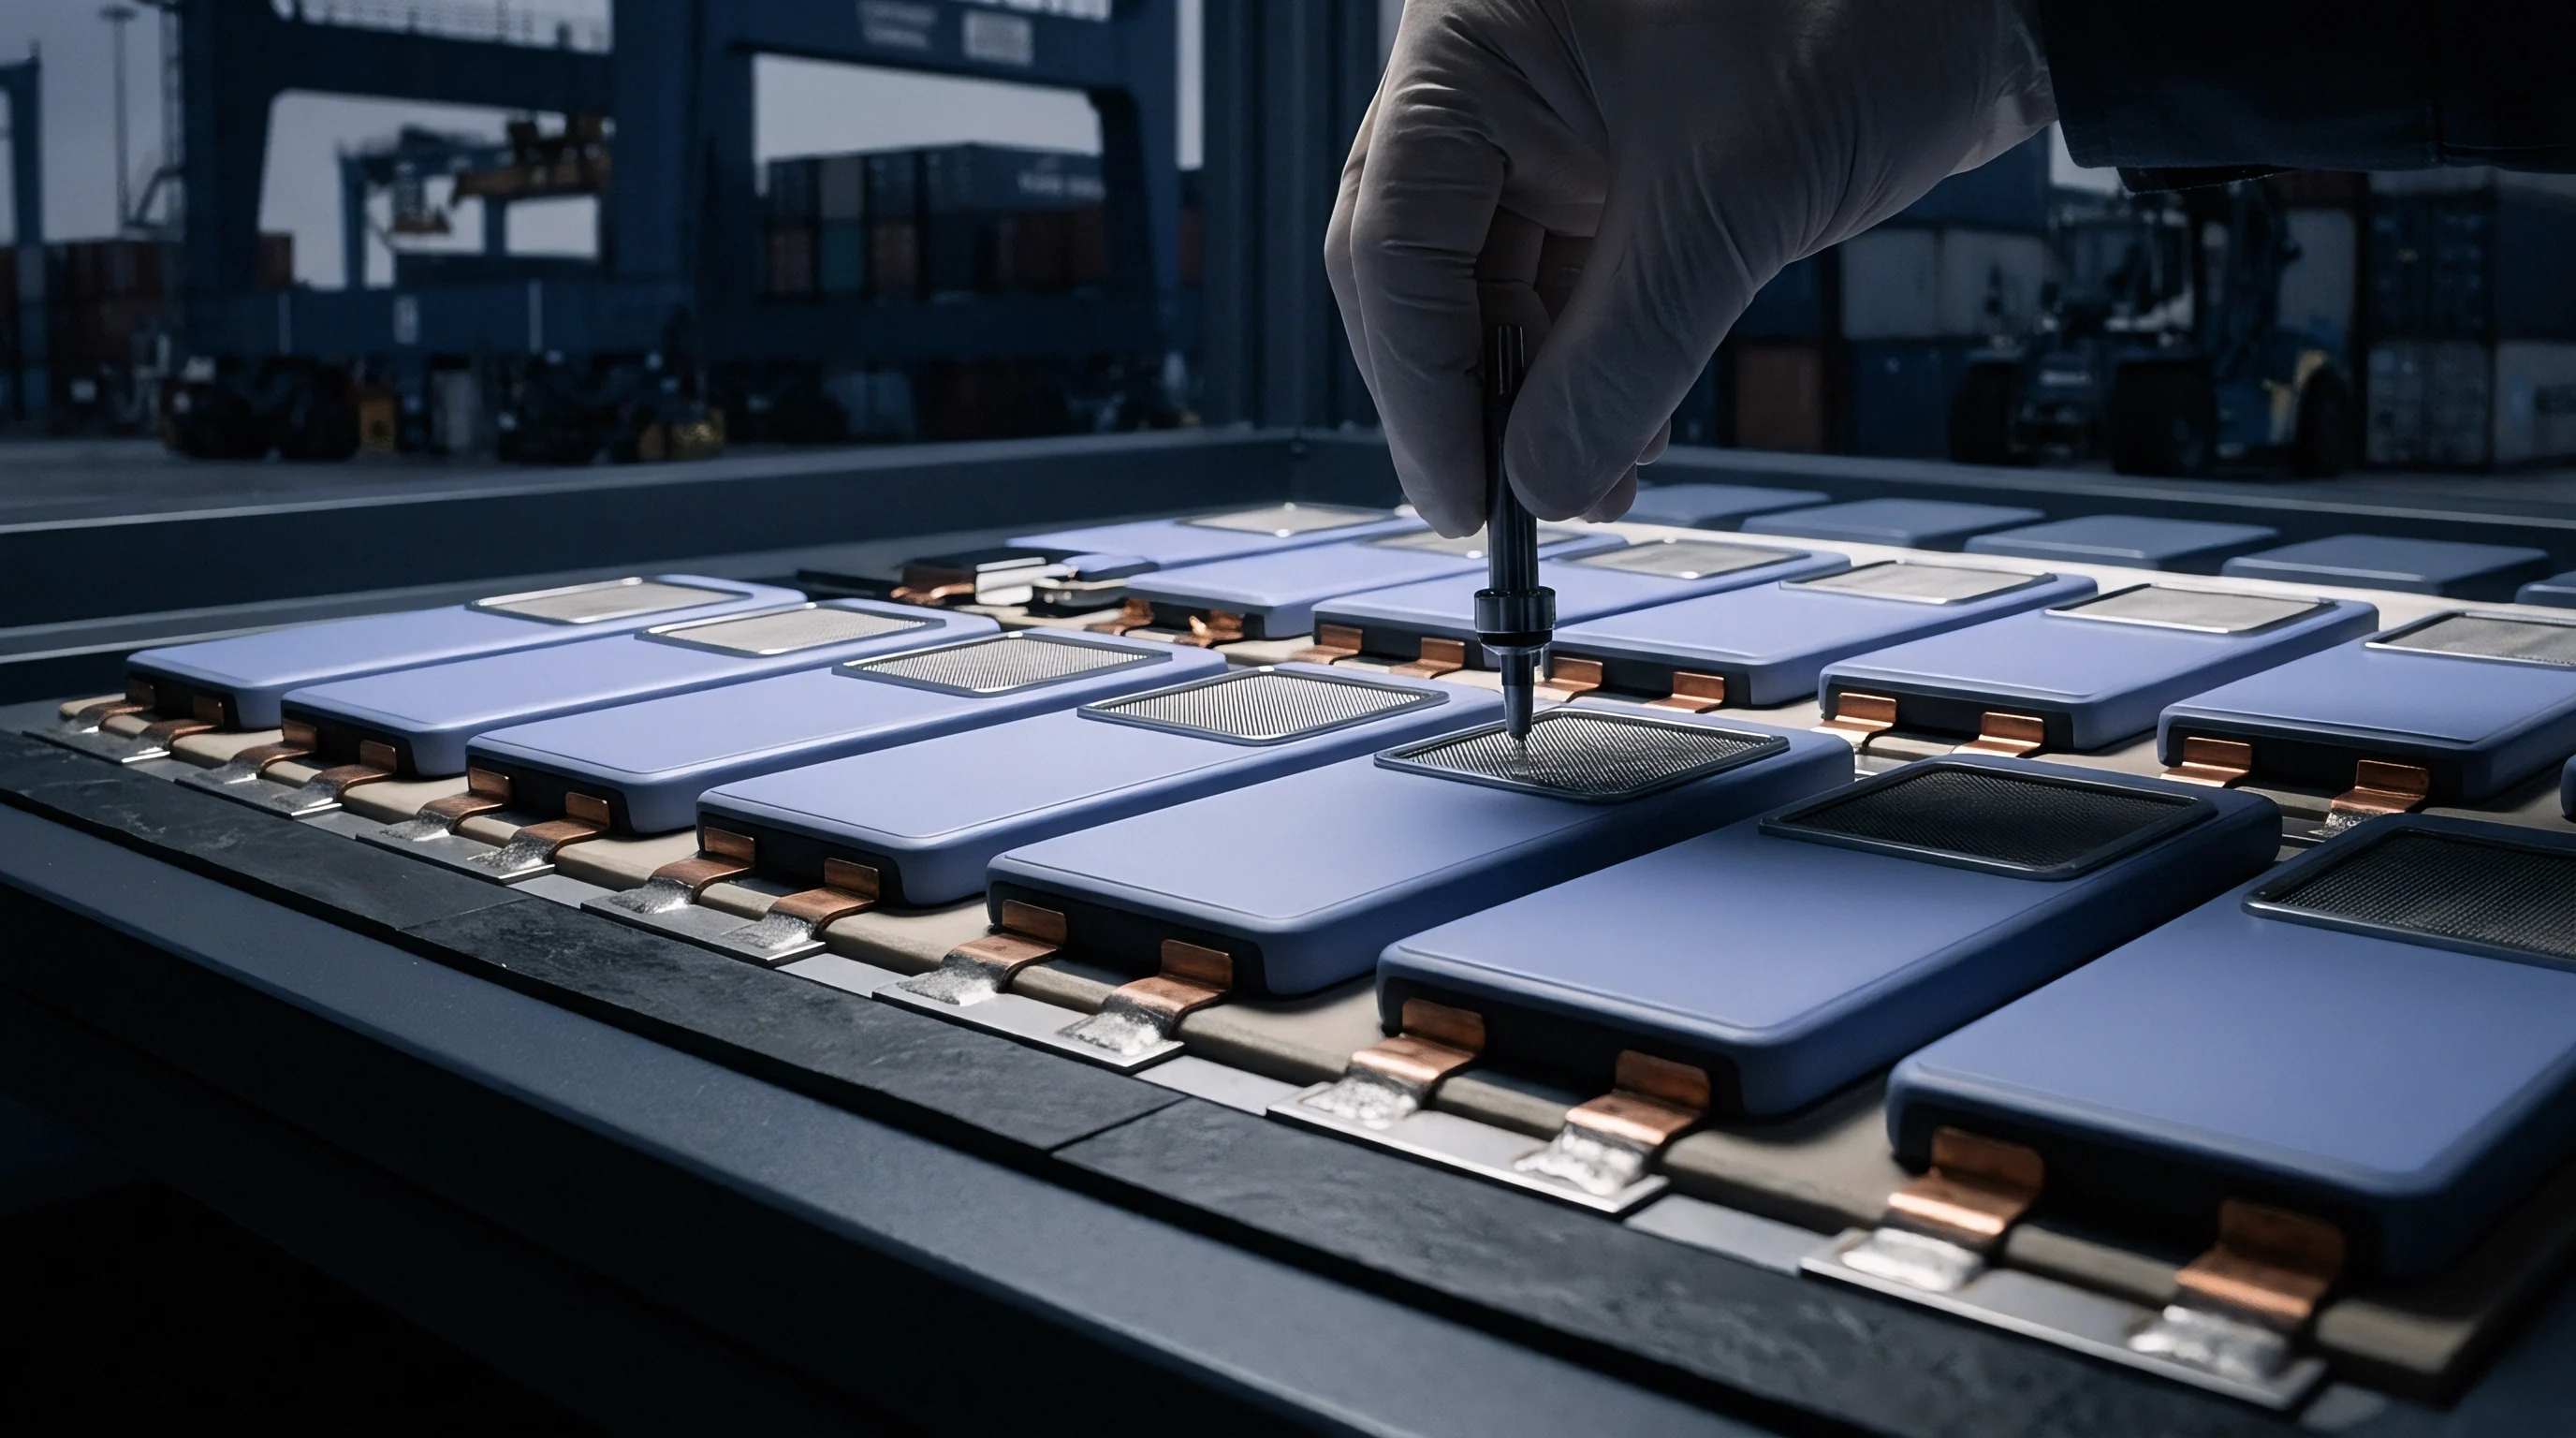
Electrochemical Spectrum across Excitation Domains
Sinusoidal perturbations applied at standard one kilohertz signals pass directly through interfacial double-layer capacitances. At this frequency, the capacitive reactance of the electrode-electrolyte interface drops toward zero. The measurement captures pure high-frequency ohmic resistance, combining bulk electrolyte ionic conductivity, separator tortuosity, copper and aluminum current collector foil resistance, ultrasonic tab welds, and external terminal post connections.
Ohmic loss generates heat.
Low-frequency alternating excitation or direct current pulse testing operates in a fundamentally different electrochemical regime. When perturbation frequencies fall below ten hertz, capacitive double layers charge fully, forcing lithium ions to cross the solid electrolyte interphase and undergo charge transfer reactions at active material particle surfaces. This kinetic barrier introduces charge-transfer resistance, followed at even lower frequencies by mass transport limitations defined by solid-state diffusion within active cathode and anode materials.
An excitation signal at 1 kHz isolates pure ionic and metallic ohmic paths while bypassing kinetic double-layer charge transfer across the electrode interface.

Interfacial Kinetics and Mass Transport Delay
Charge transfer across active electrode surfaces involves activation energy barriers at the electrolyte interface. In lithium iron phosphate and nickel manganese cobalt prismatic cells, the solid electrolyte interphase layer adds a discrete resistive component. Alternating current impedance measurements taken at a single high frequency cannot resolve whether an elevated resistance reading stems from a poor mechanical weld or a passivated, degraded electrode surface.
Mass transport delays emerge during continuous ion flux. As lithium ions migrate through bulk electrolyte pores and insert into host crystal lattices, localized concentration gradients develop. These gradients produce concentration overpotentials that add directly to the total voltage drop measured across the cell terminals during operation.
High-frequency sinusoidal signals reverse direction far too quickly to induce these concentration polarization effects.
The exact excitation frequency at which charge transfer polarization begins to obscure bulk electrolyte impedance across variable solid electrolyte interphase thicknesses remains an open empirical question across multi-factory production runs.


Pulse
Galvanostatic step testing measures real operational voltage decay under continuous direct current loads. Current steps reveal polarization.

Galvanostatic Step Dynamics
Applying a constant load current forces the prismatic cell out of thermodynamic equilibrium. The initial terminal voltage drop occurs within microseconds, governed purely by metallic and bulk ionic ohmic paths identical to those measured by high-frequency alternating current methods. As current continues to flow over milliseconds and seconds, the terminal voltage continues to decline along a dynamic polarization curve.
Hybrid Pulse Power Characterization protocols formalize this measurement by applying specific discharge and charge pulses across varying states of charge. Pulse duration determines which electrochemical mechanisms contribute to the calculated resistance value. Short pulses miss diffusion.
Calculating direct current resistance requires dividing total terminal voltage change by applied current magnitude at designated time intervals. A one-hundred-millisecond calculation isolates ohmic and rapid charge-transfer steps. A ten-second or thirty-second pulse calculation incorporates deep charge-transfer kinetics and mass transport concentration gradients, reflecting the true resistance experienced by a pack during heavy acceleration or fast-charging profiles.

Dissecting Voltage Drops under Load
Overpotential accumulation during discharge splits into three distinct electrochemical time regimes. Heat follows current square. Evaluating a cell using a worked engineering construction clarifies how these time-dependent resistance components accumulate under physical load conditions.
Consider a quality control evaluation on a 280 Ah lithium iron phosphate prismatic cell tested at 25°C and 50% state of charge. Assume a 140 A galvanostatic discharge step representing a 0.5C continuous rate. Baseline open circuit voltage sits at 3.295 V.
At 10 milliseconds post-step, terminal voltage drops to 3.270 V. Calculating instantaneous resistance yields:
Rinstant = frac3.295 V – 3.270 V140 A = frac0.025 V140 A = 0.178 mΩ
At 1 second post-step, ongoing charge-transfer polarization reduces terminal voltage to 3.255 V:
R1s = frac3.295 V – 3.255 V140 A = frac0.040 V140 A = 0.286 mΩ
At 10 seconds post-step, full charge-transfer activation and emerging lithium concentration gradients pull terminal voltage down to 3.230 V:
R10s = frac3.295 V – 3.230 V140 A = frac0.065 V140 A = 0.464 mΩ
A standard 1 kHz alternating current impedance test on this identical cell yields 0.18 mΩ, matching the 10-millisecond instantaneous ohmic response. Pulse duration changes resistance. Quality inspection protocols relying exclusively on the 1 kHz alternating current metric completely miss the additional 0.284 mΩ of electrochemical overpotential that drives thermal generation during a 10-second pulse load.
Determining cell pulse suitability for high-C discharge requires evaluating resistance at the maximum expected load duration rather than relying on short-duration AC perturbation.
State of charge and ambient temperature radically amplify these discrepancies. Below 20% state of charge, charge-transfer kinetics slow significantly, causing ten-second direct current resistance to surge by up to 300% while high-frequency alternating current impedance shows minimal variation. Cold temperatures amplify impedance.
Cold temperature testing exposes electrochemical bottlenecks that room temperature excitation completely fails to register.

Screening
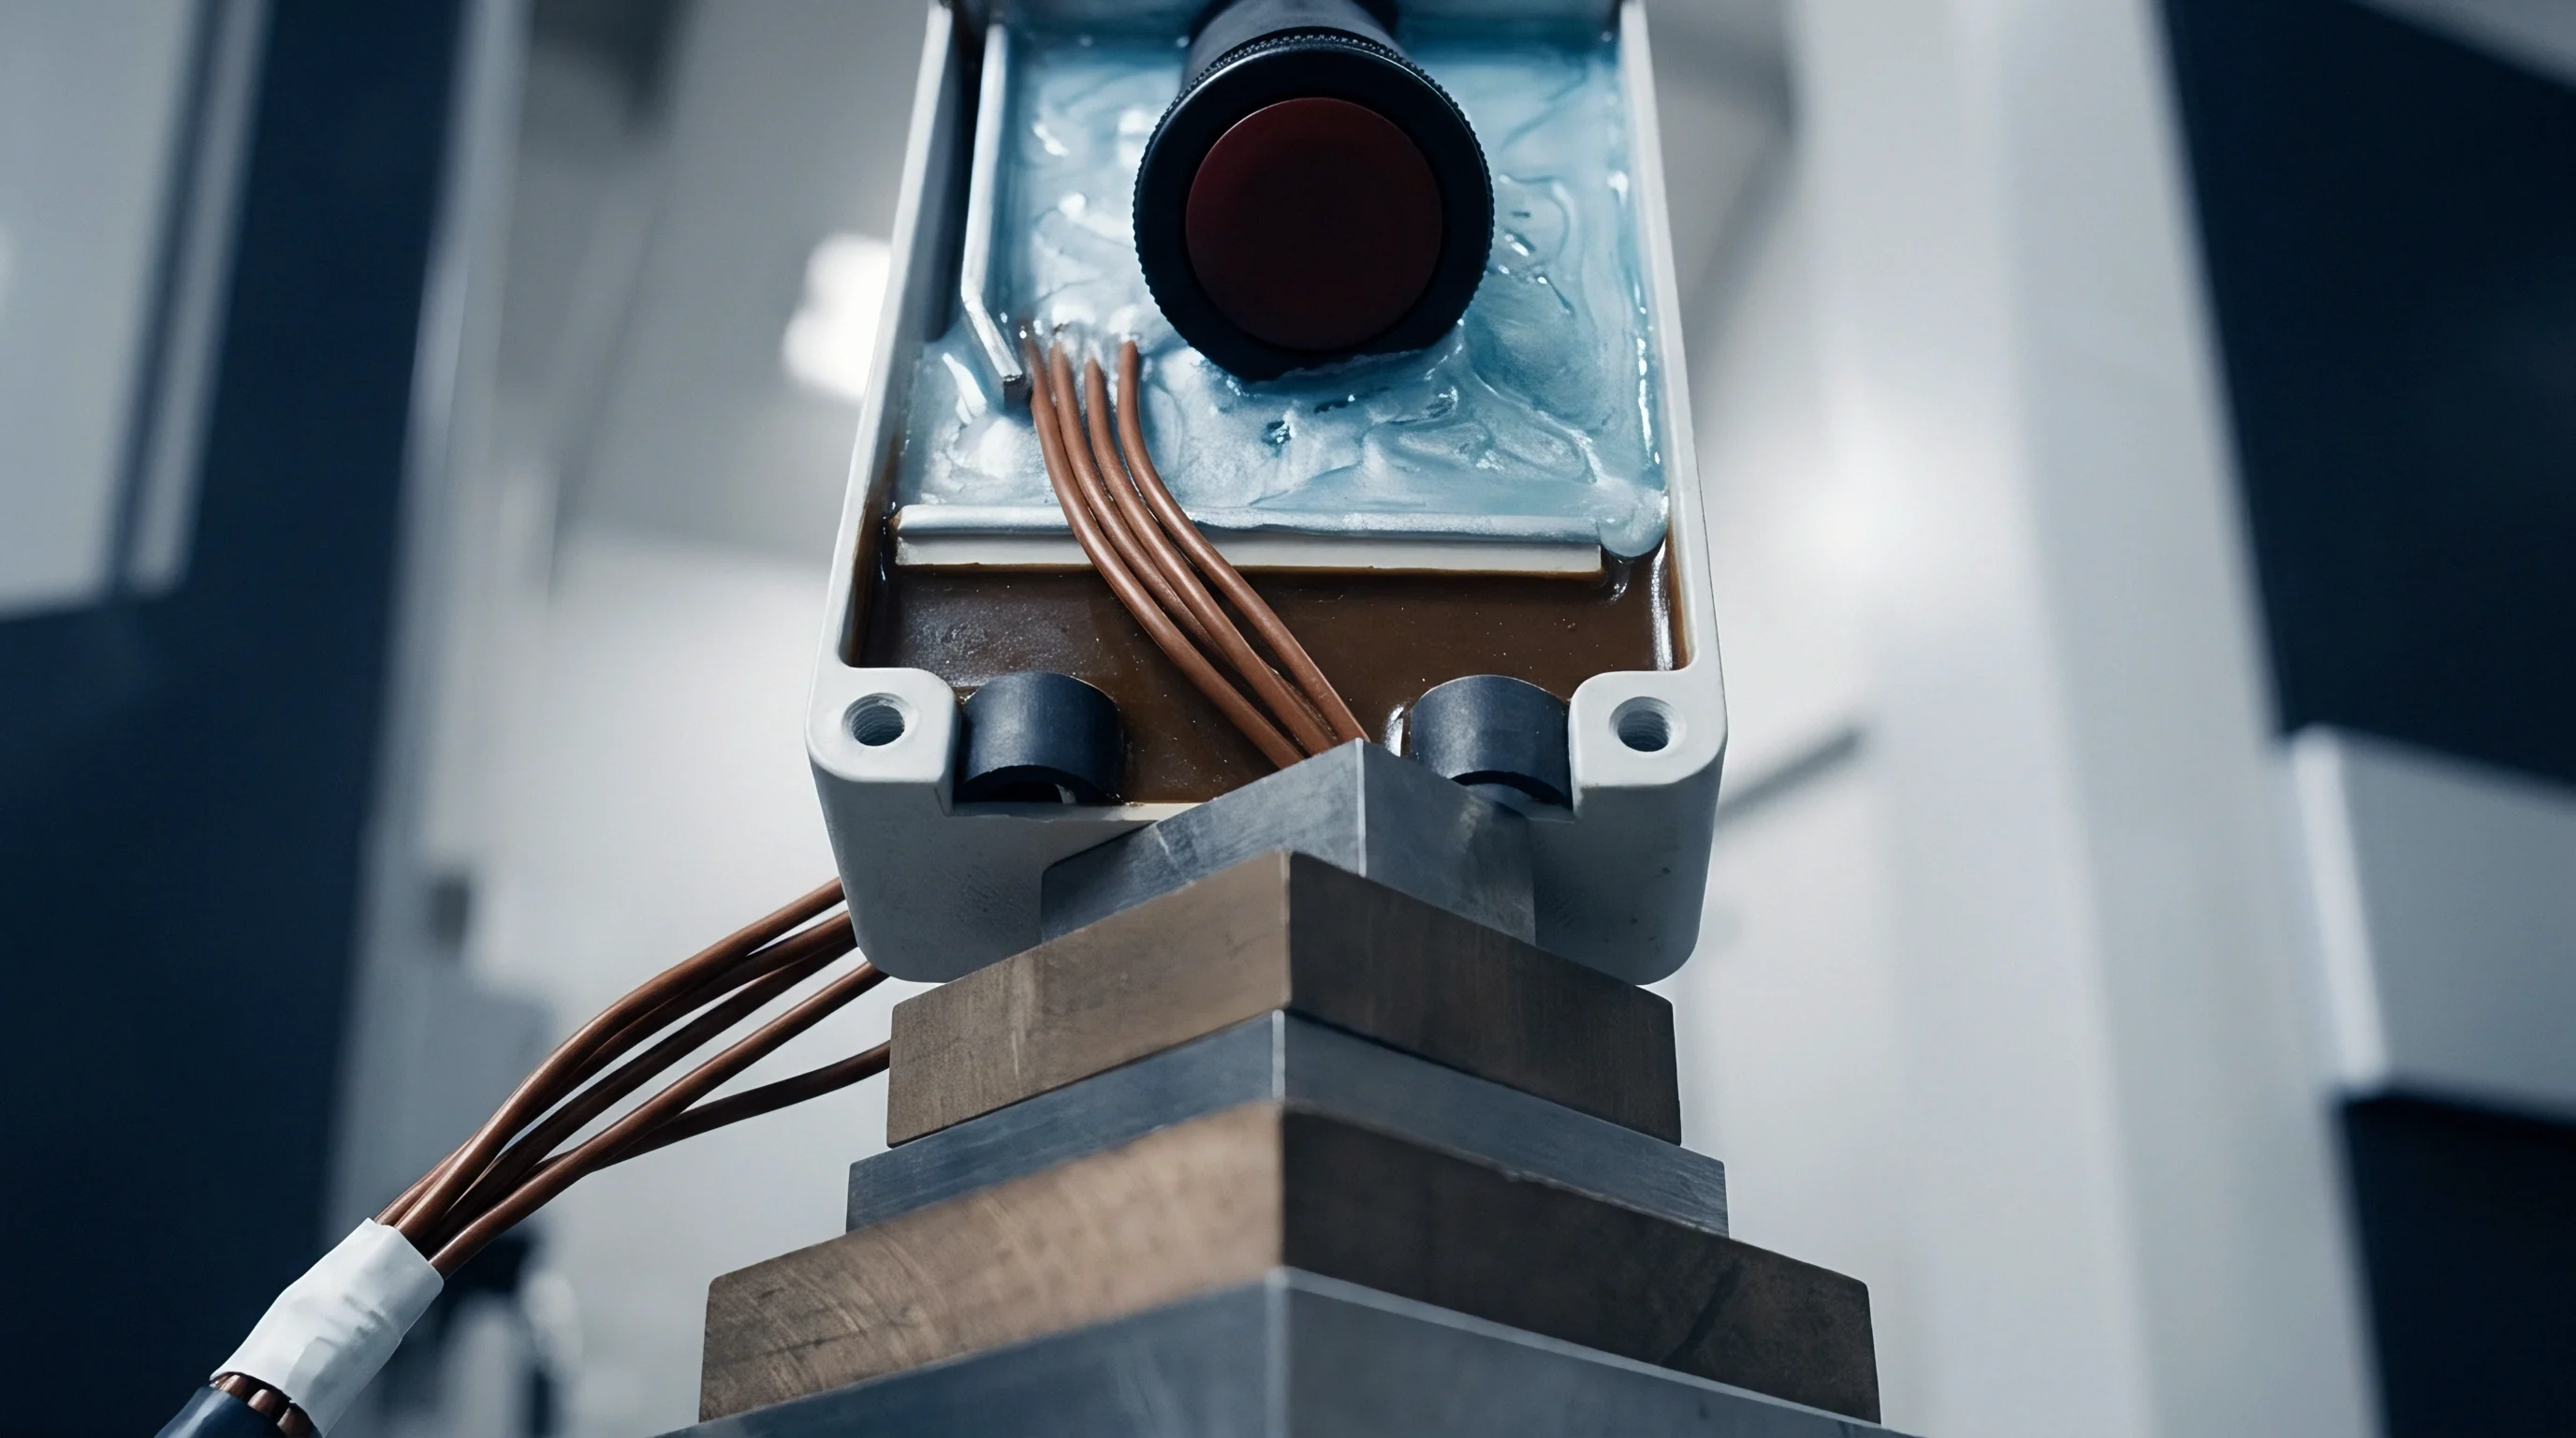
Production line sorting relies on high-speed meter readings to process thousands of prismatic units daily. Yield loss reduces margin. Cell tabs carry load.
Why Does Low AC Resistance Fail High Current Loads?
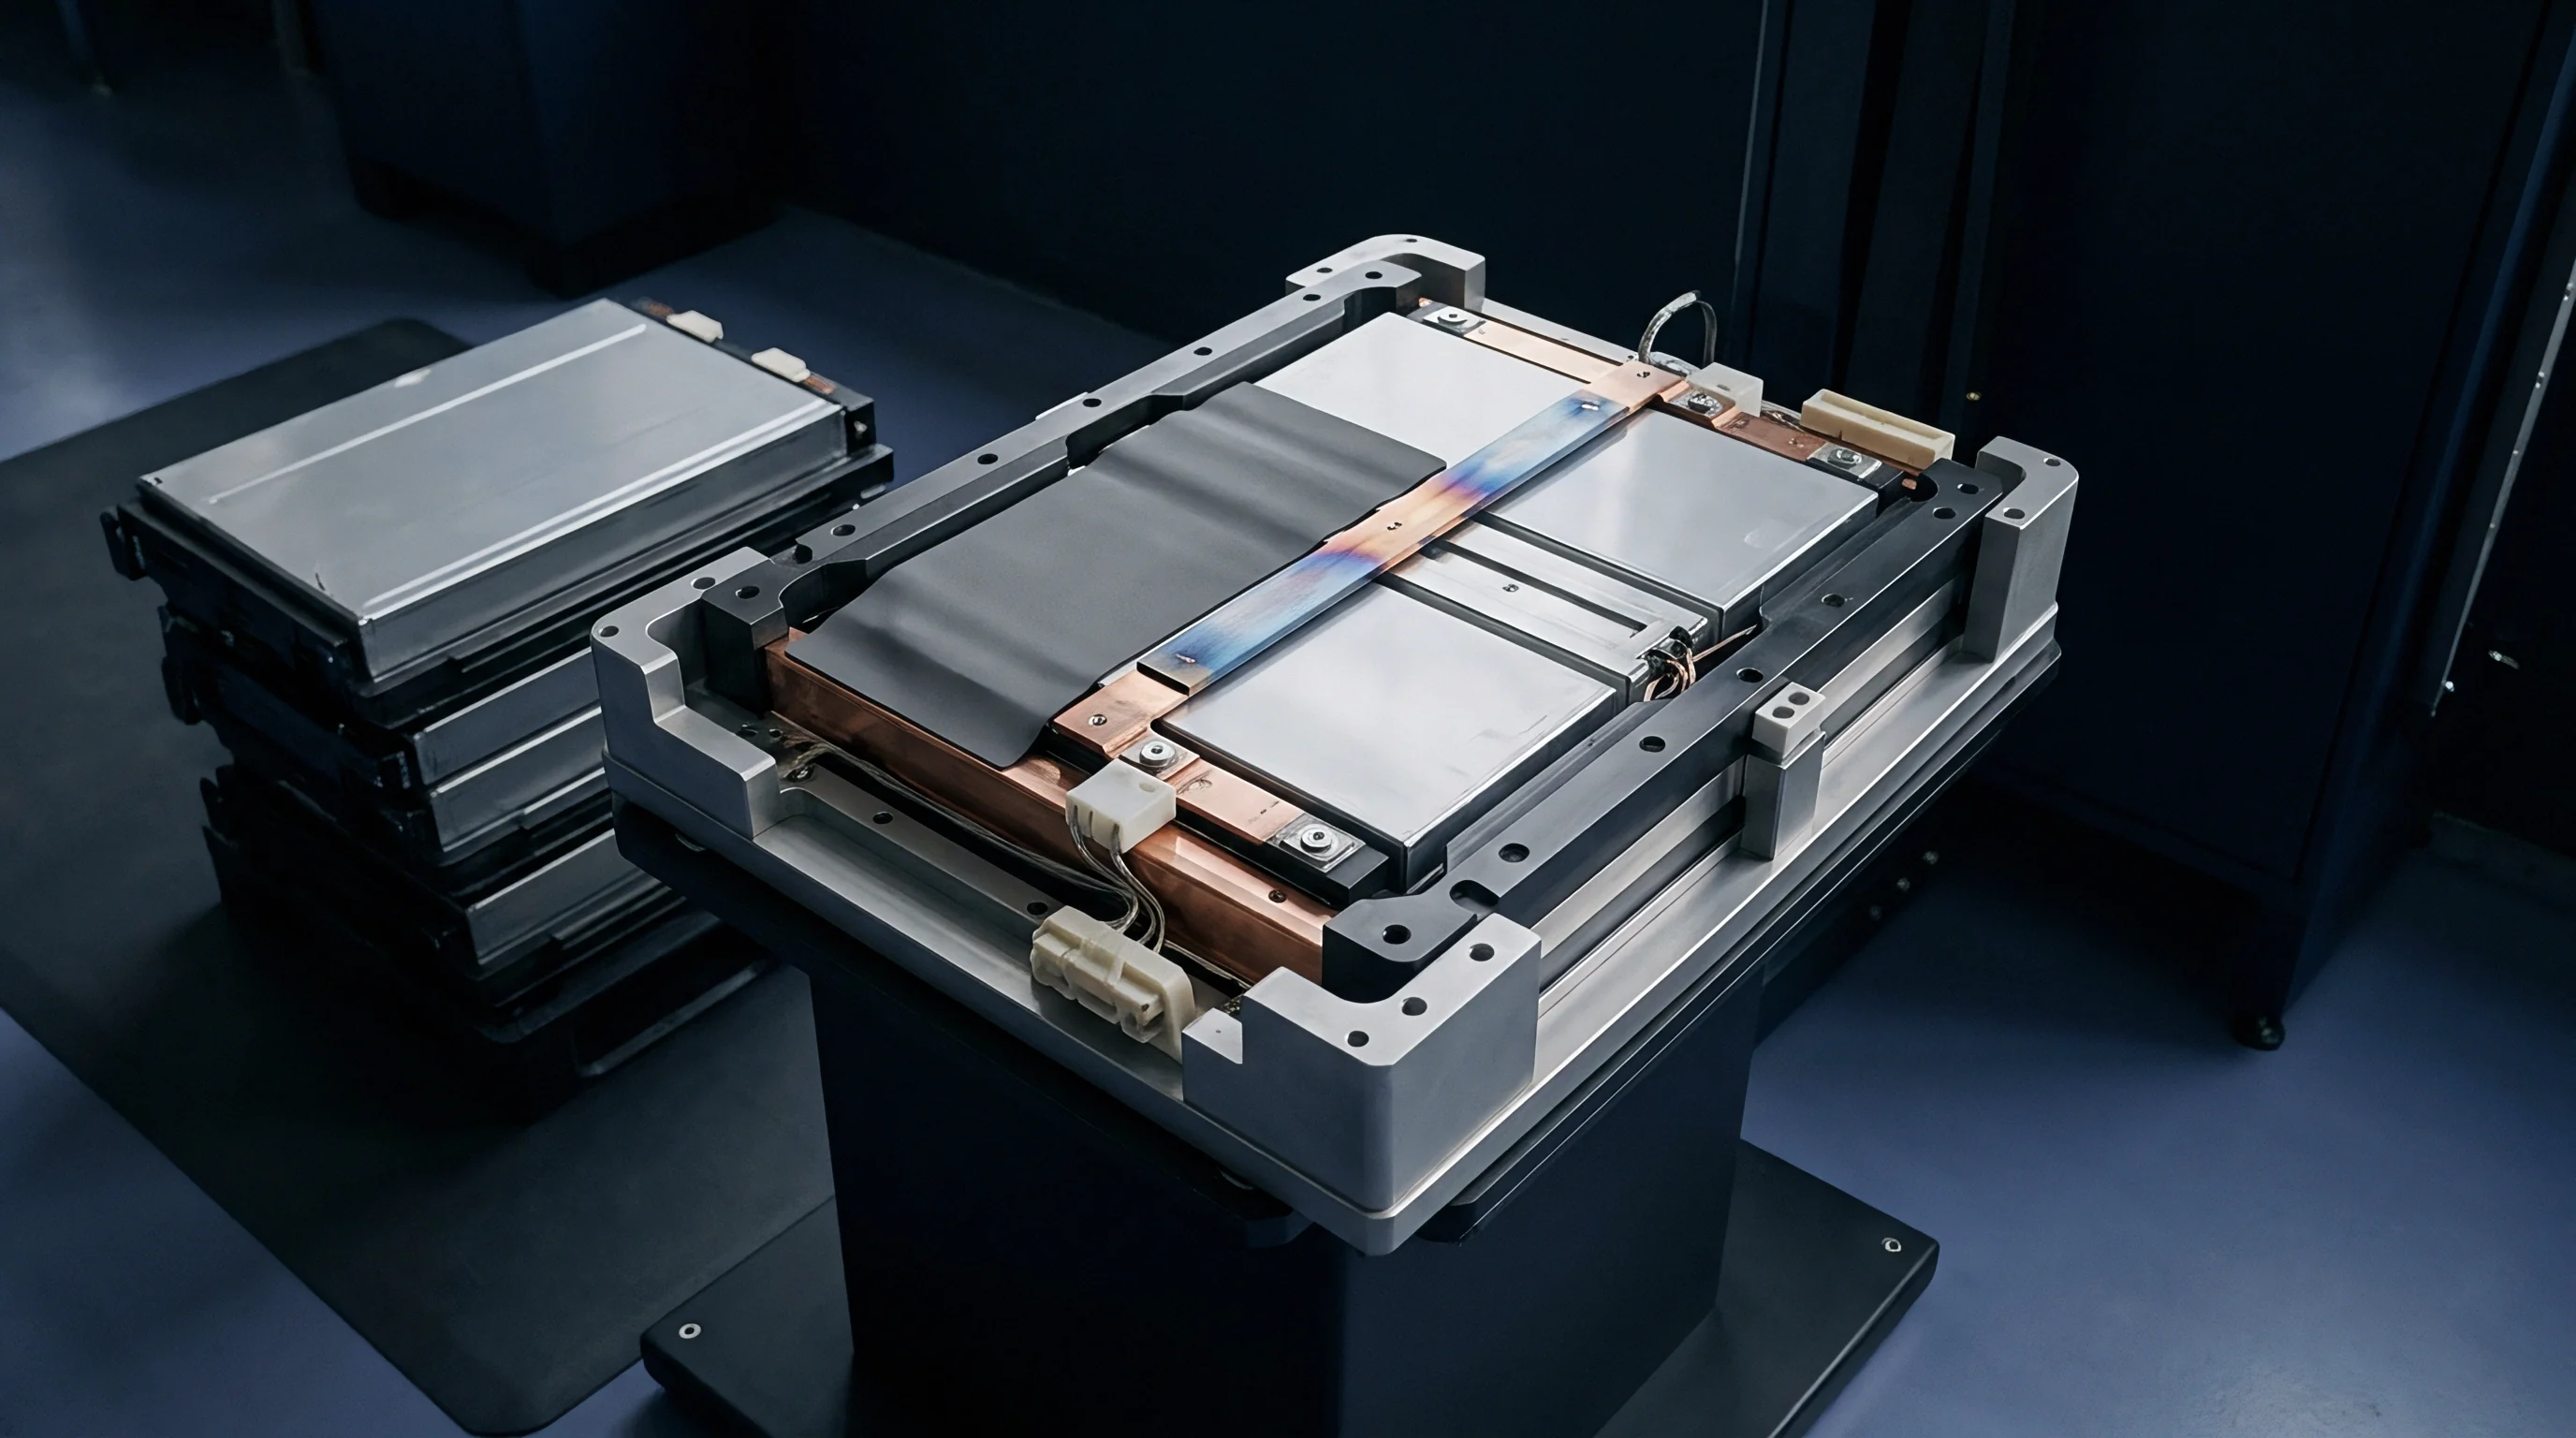
Cell internal architecture contains localized physical bottlenecks that remain invisible during small signal excitation. Alternating current meters inject small perturbations, often around 100 mA RMS. At these micro-current levels, delicate physical contacts, thin interfacial films, and partially wetted porous structures pass signal excitation without thermal or kinetic saturation.
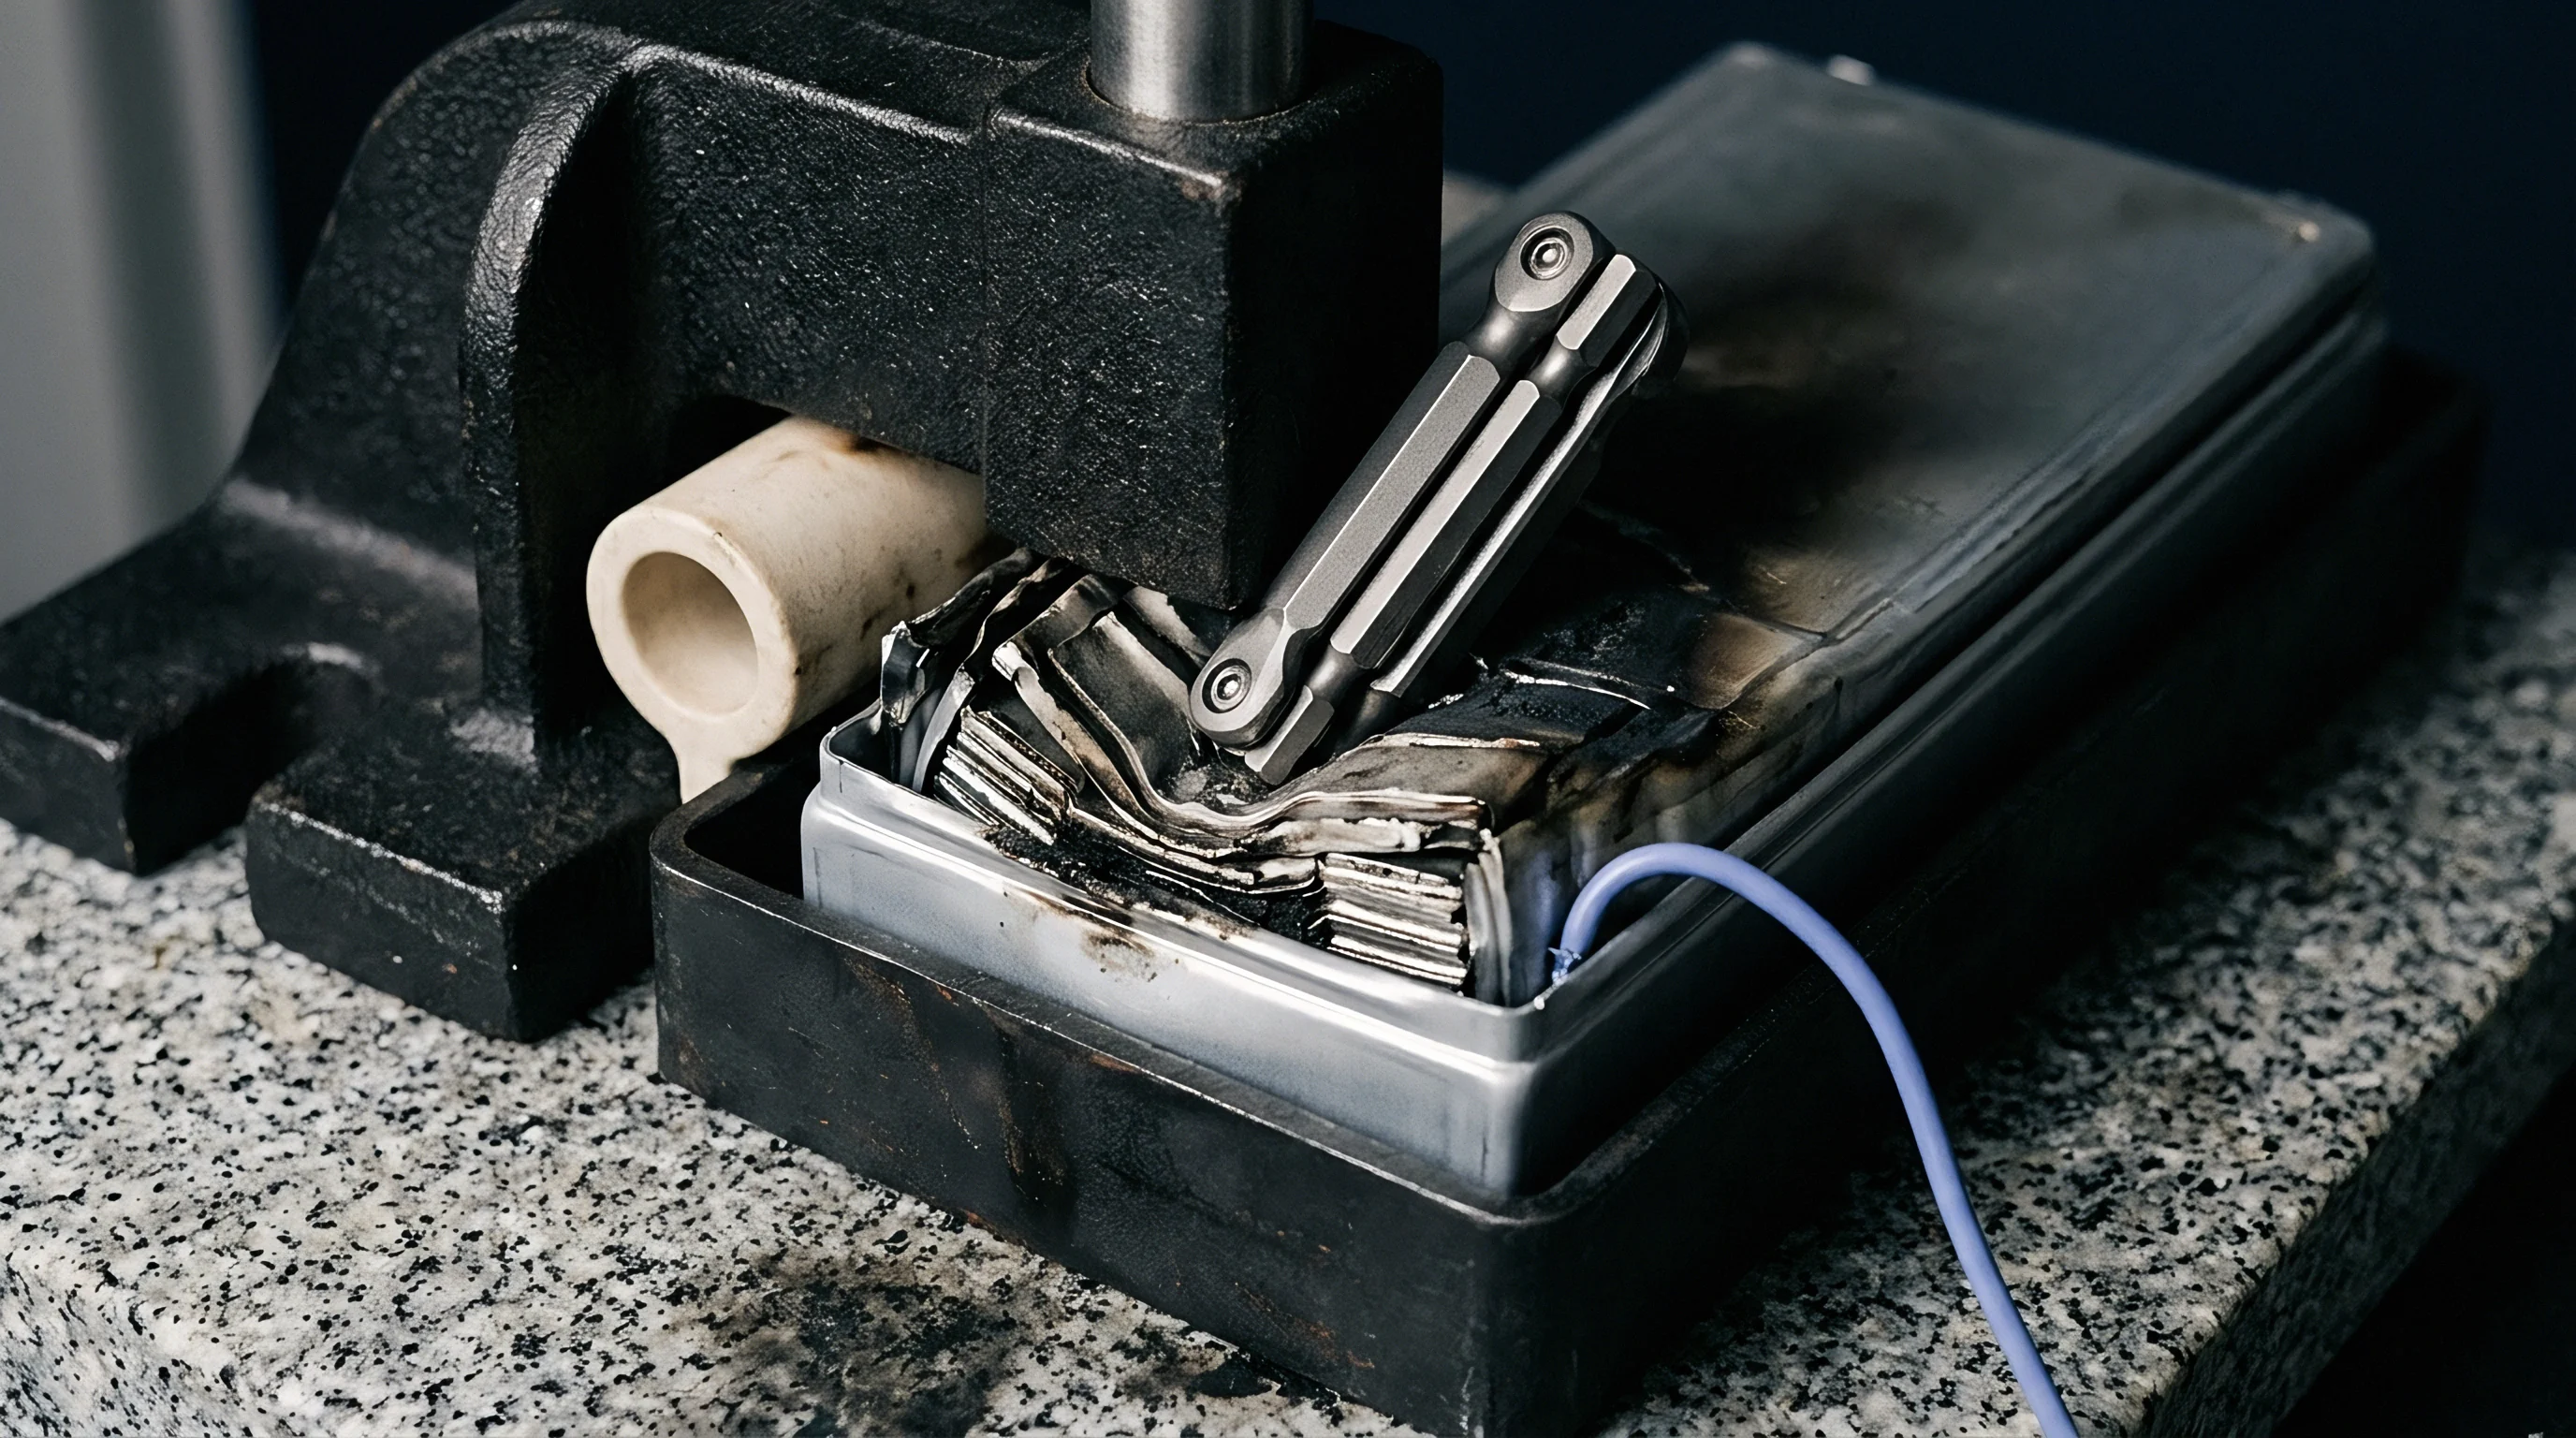
Under a 150 A direct current load, internal current distribution changes dramatically. Microscopic contact points between cathode current collectors and internal busbars experience high current density, inducing localized heating and non-linear constriction resistance. A cell displaying an exemplary 0.15 mΩ high-frequency alternating current reading can experience immediate terminal voltage collapse under heavy direct current load if internal tab welds contain micro-voids or structural fracturing.

Manufacturing Defect Signatures in Cell Grading
Unintended variances during electrode slurry coating and tab ultrasonic welding alter internal resistance paths distinctly. High-speed inline automated test stations catch specific manufacturing defects by pairing high-frequency alternating current metrics with targeted direct current pulse evaluations.
- Active Material Passivation increases interfacial charge transfer resistance significantly while leaving 1 kHz metallic and bulk electrolyte paths completely unaffected.
- Incomplete Electrolyte Wetting starves dry internal pore channels, severely limiting ionic diffusion flux under direct current pulses without altering high-conduction bulk liquid paths.
- Ultrasonic Tab Weld Fracture creates localized micro-gaps that easily transmit low-current alternating excitation but induce severe voltage drops and thermal spikes under high direct current load.
- Cathode Coating Delamination reduces active interfacial contact surface area, driving up pulse charge-transfer resistance while current collector foils retain full metallic conductivity.
Cell acceptance testing under standard delivery contracts enforces a dual-parameter gate requiring both 1 kHz AC impedance and 10-second DC pulse resistance verification.
Inspection catches assembly flaws. Automated cell sorting systems that rely exclusively on one-kilohertz measurements regularly pass cells carrying severe wetting deficiencies or cathode passivation. These defective units pass initial incoming inspection, enter pack assembly, and fail prematurely during module validation or early operational life.
Relying on high frequency AC screening alone passes defective cell batches into production lines, causing accelerated pack degradation, severe thermal imbalance, and costly field recall liability.
Benchmark
Standardization documents establish precise operational parameters to remove measurement variability across testing facilities. Surface oxide skews readings. Contact resistance skews metrics.

Standardized Protocol Execution
International testing directives mandate explicit temperature controls and sampling rates during impedance characterization. IEC 61960-3 defines standard procedures for one-kilohertz alternating current resistance measurement, focusing on rapid sorting and basic contact verification. ISO 12405 and IEC 62660-1 define pulse-based direct current test protocols specifically designed to evaluate electric vehicle power delivery and heat generation.
| Test Parameter | 1 kHz AC Resistance (ACR) | 10s DC Pulse Resistance (DCR) | Applicable Standard Reference |
|---|---|---|---|
| Signal Form | 1 kHz sinusoidal AC current | Galvanostatic DC pulse step | IEC 61960-3 (ACR) / ISO 12405 (DCR) |
| Test Duration | 10 to 100 milliseconds | 10 to 30 seconds | IEC 62660-1 Section 6.2 |
| Physical Focus | Bulk ionic and metallic ohmic paths | Ohmic plus charge transfer and diffusion | UL 2580 Component Testing |
| Thermal Impact | Negligible temperature rise | Measurable Joule heating (I2 R) | UN 38.3 Transport Testing |
| Line Throughput | High speed (up to 60 cells/min) | Low speed (requires rest periods) | Factory Quality Control Protocols |

Mechanical Fixturing and Four Wire Measurement
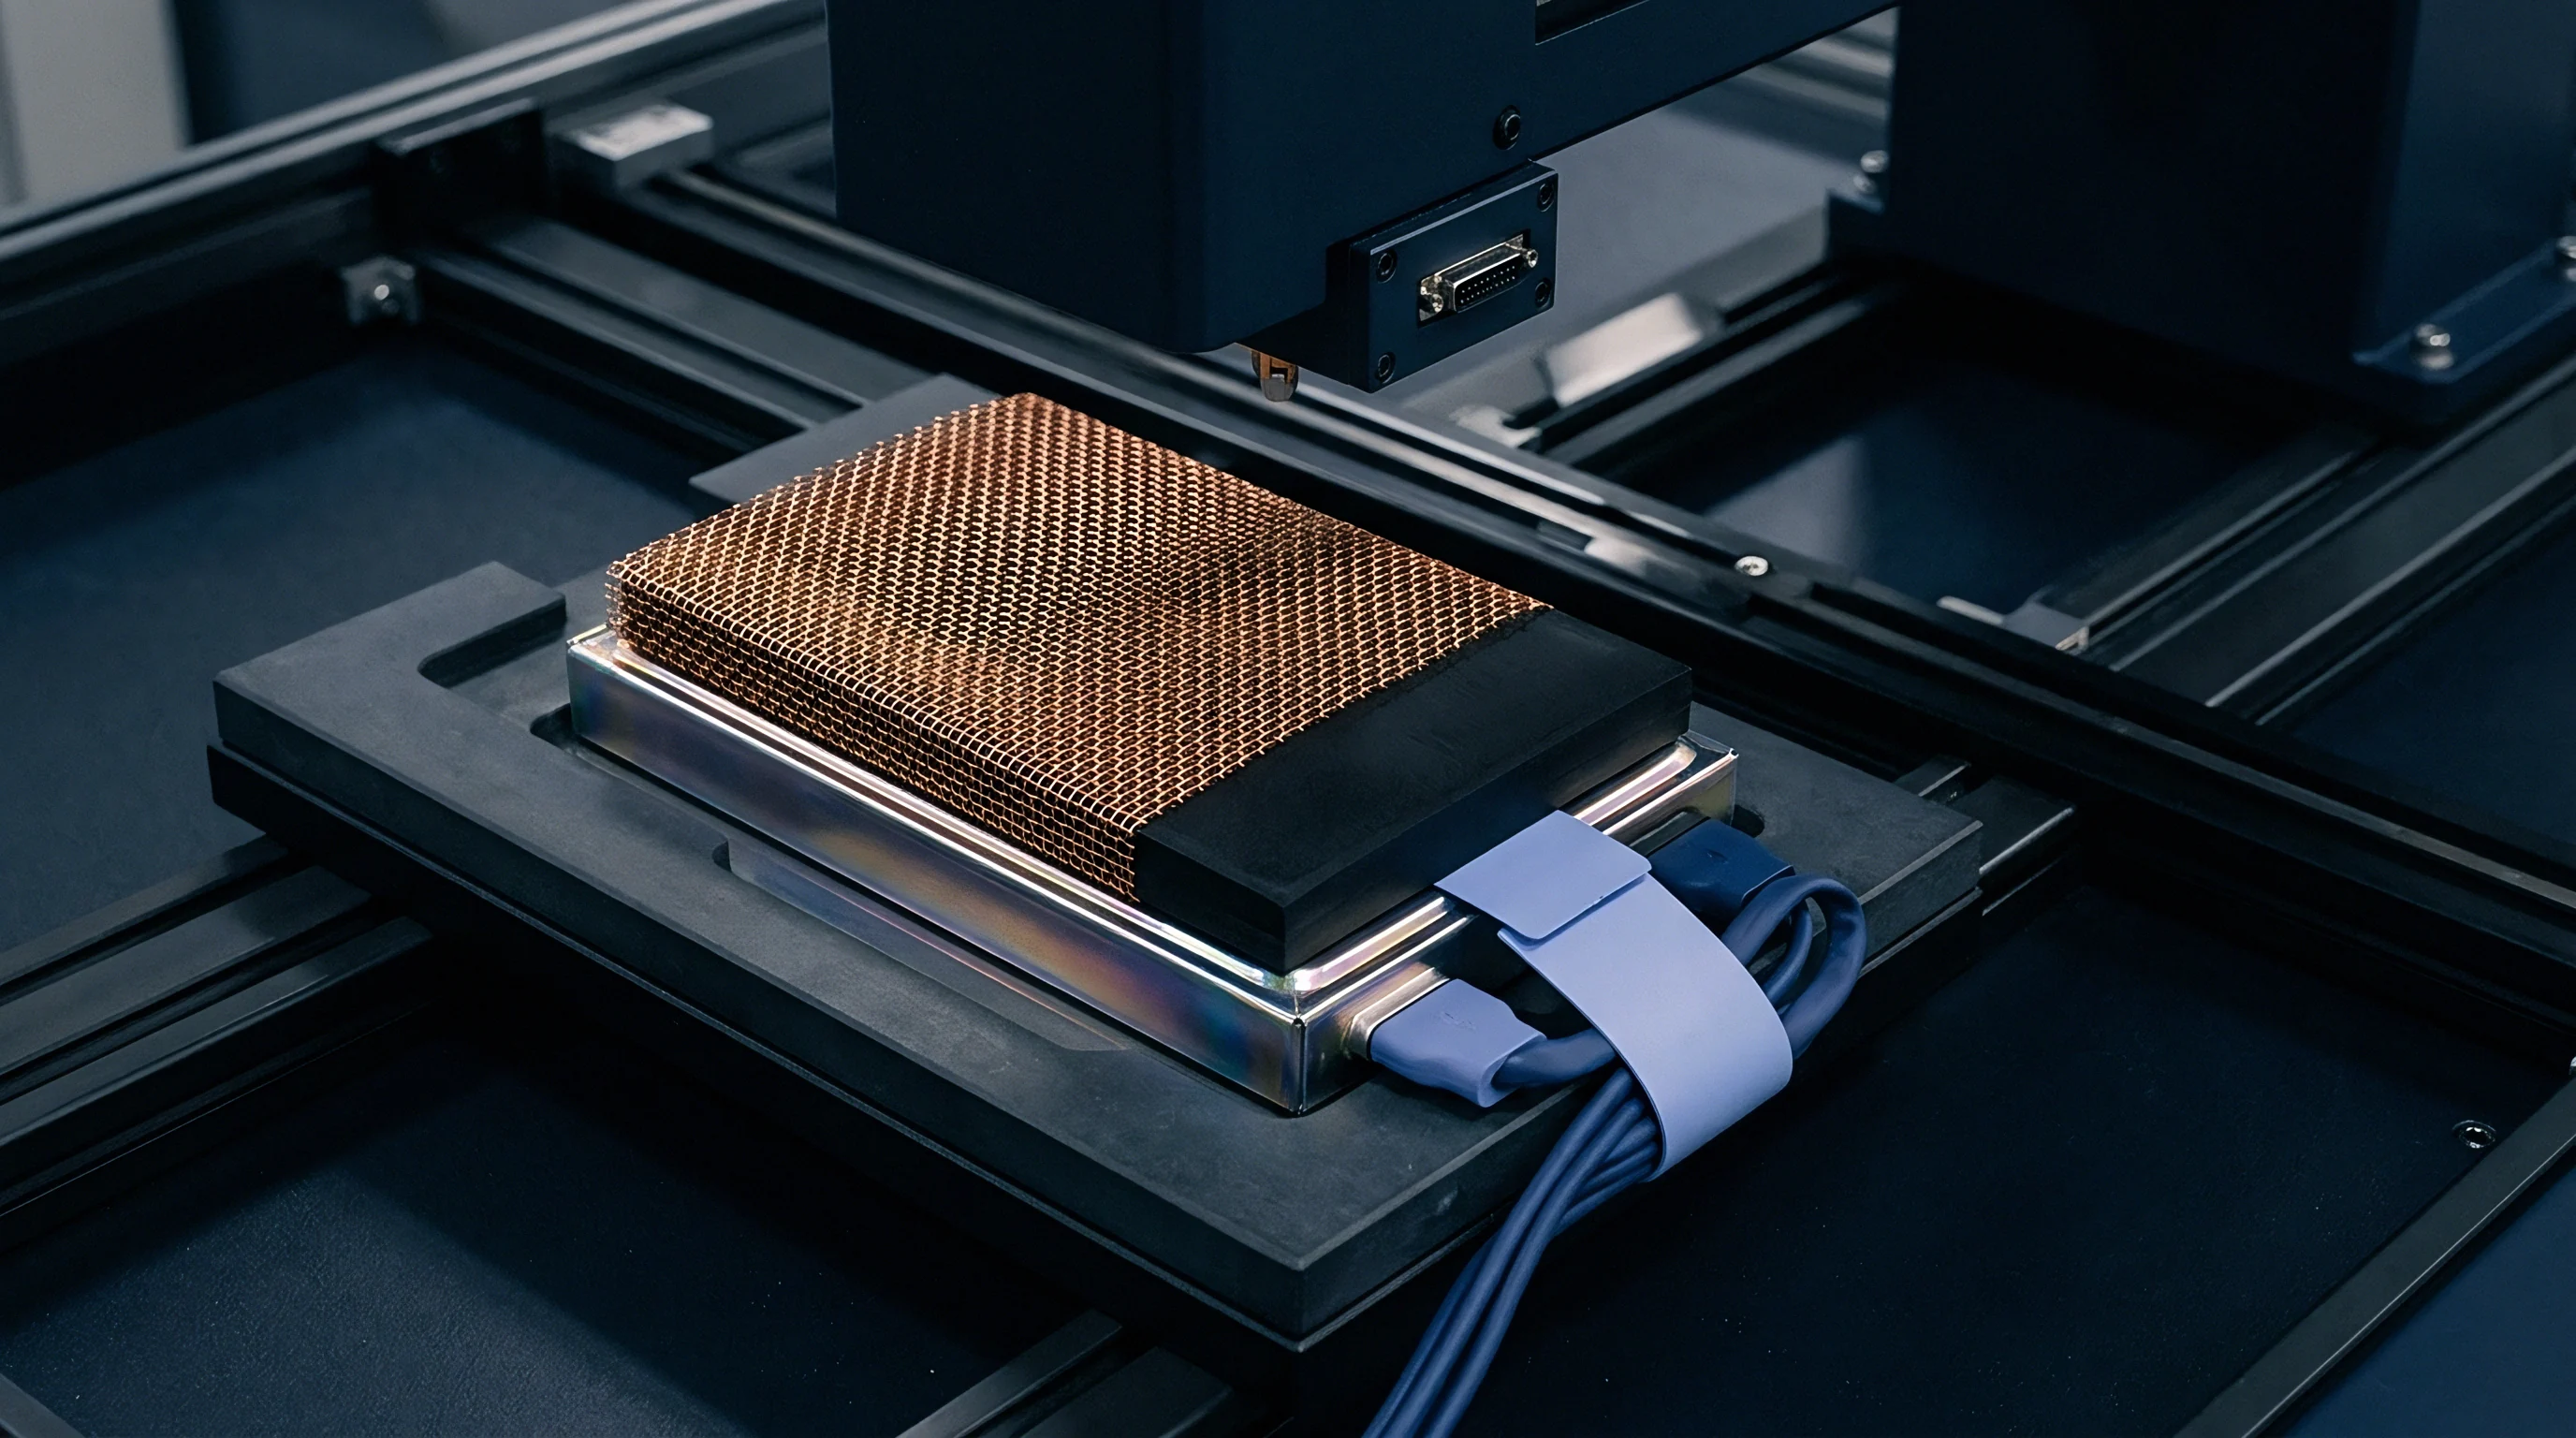
Terminal oxide layers on prismatic aluminum and copper contacts introduce severe measurement distortion unless Kelvin sensing isolates line losses. Four-wire sensing connects separate current-carrying leads and voltage-sensing leads directly to the cell terminal post, eliminating test lead resistance and contact resistance from the measurement circuit.
Clamping force stabilizes contact. Pressure alters stack contact. Prismatic cells contain stacked or wound electrode gel-rolls enclosed within aluminum cans.
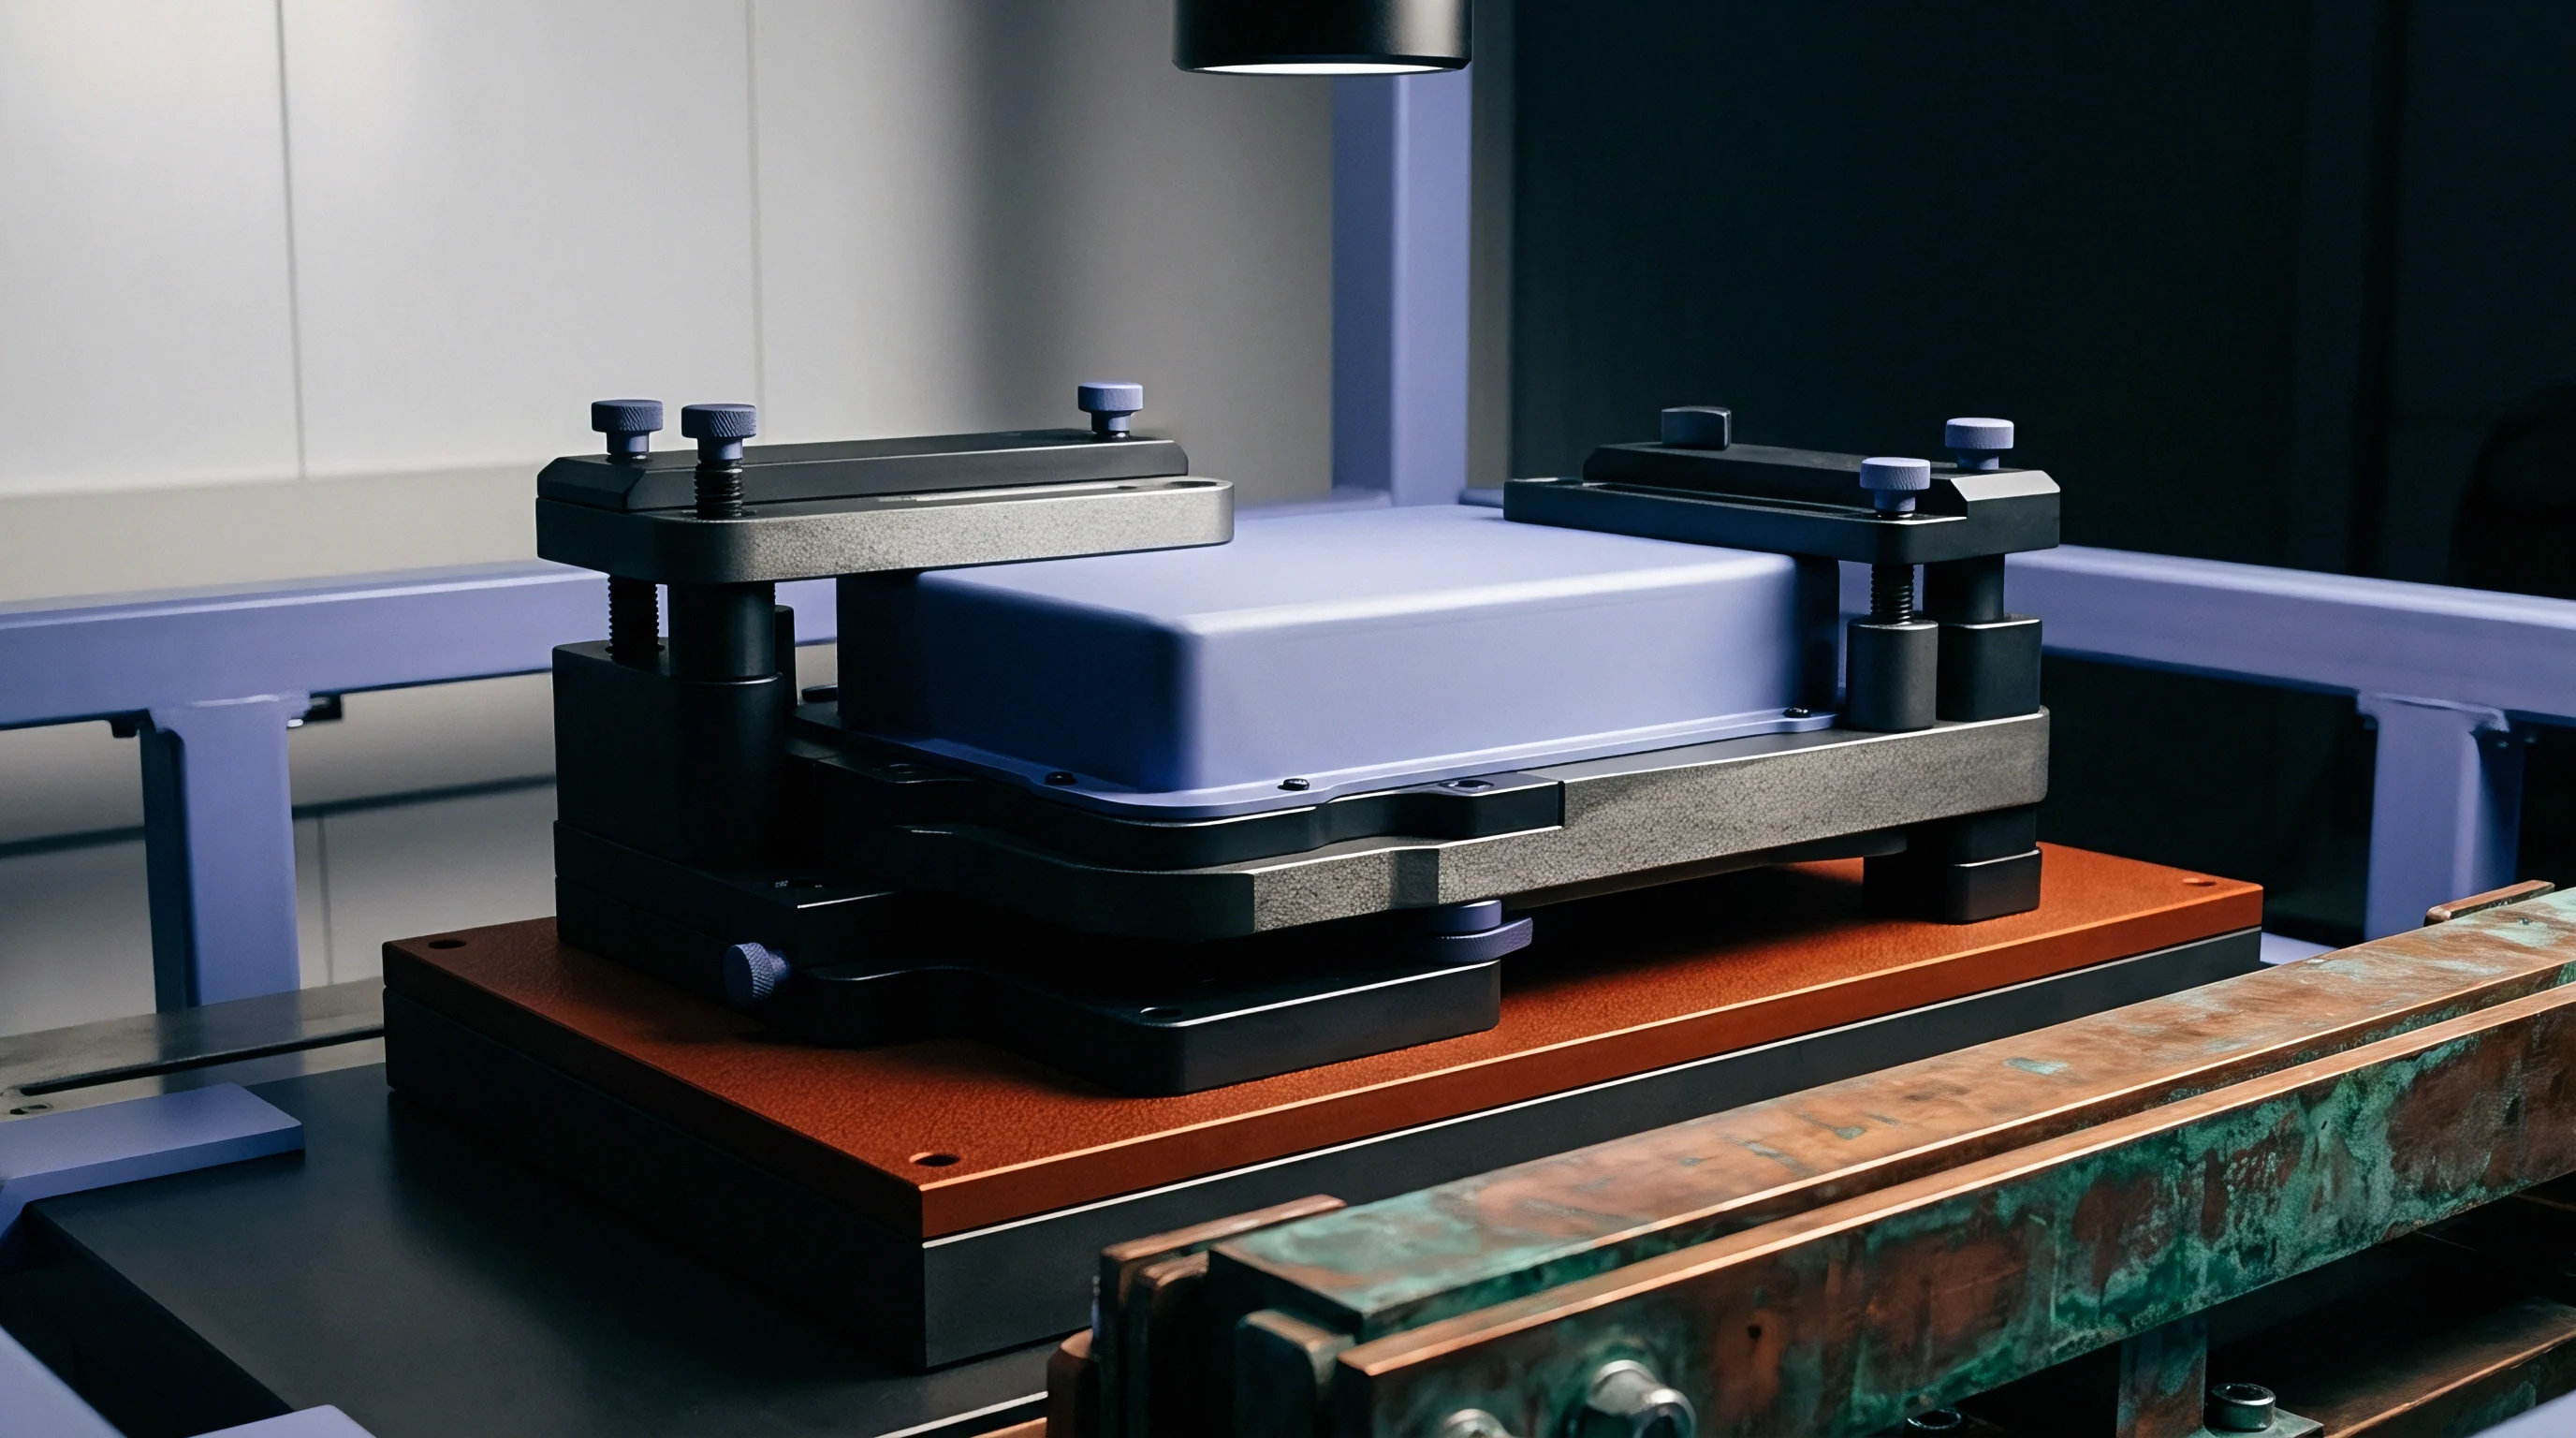
Applying precise mechanical compression across the broad faces of the prismatic cell enclosure stabilizes internal electrode contact and minimizes bulk electrolyte gap spacing.
| Control Variable | Nominal Test Window | Effect on 1 kHz ACR | Effect on 10s DCR |
|---|---|---|---|
| Ambient Temperature | 25°C ± 0.5°C | Low sensitivity ($sim$1%/°C) | High sensitivity ($sim$3% to 5%/°C) |
| State of Charge | 50% SOC ± 2% | Negligible (flat across 20-80%) | High non-linear rise below 20% SOC |
| Facial Compression | 300 kPa to 500 kPa | Moderate sensitivity | High sensitivity (stack contact) |
| Terminal Torque / Force | 6 Nm ± 0.2 Nm | High sensitivity (surface oxide) | High sensitivity (contact heating) |
- Terminal Surface Preparation removes atmospheric oxidation and anti-corrosion oils using isopropyl alcohol pads before making electrical contact with Kelvin probes.
- Compressive Fixture Application loads the prismatic cell faces to specified factory pressure using calibrated pneumatic plates to ensure uniform internal electrode stack contact.
- Thermal Equilibration Soaking rests the cell lot in a temperature-controlled chamber at 25°C plus or minus 0.5°C for four hours prior to taking baseline measurements.
- High-Frequency AC Screening applies a 1 kHz sinusoidal excitation to verify basic contact integrity and tab weld connection within two seconds.
- Galvanostatic Pulse Qualification executes a 10-second discharge pulse at 0.5C current, recording high-speed voltage response data at 100 Hz sampling frequency to derive charge transfer impedance.
Cell vendors frequently claim that low AC impedance values satisfy baseline specification sheets, maintaining that elevated DC pulse resistance measurements originate entirely from customer fixture clamping discrepancies.

Discrepancy
Unresolved technical variance between datasheet claims and delivered cell performance creates immediate commercial exposure for battery pack integrators. Unbalanced cells degrade fast.

Contractual Tolerances and Landed Cost Mechanics
Procurement agreements explicitly link acceptable impedance windows to specific discharge durations and temperatures. Sourcing specifications that quote a single bare resistance figure without defining signal frequency, pulse duration, state of charge, and test temperature leave buyers completely unprotected against degraded incoming lots.
When a cell shipment arrives displaying acceptable 1 kHz alternating current resistance but excessive 10-second direct current pulse resistance, pack assembly lines face immediate disruption. Rejecting incoming lots requires unambiguous contractual definitions. A robust technical specification defines dual threshold boundaries, establishing maximum acceptable variance bands for both high-frequency alternating current metrics and low-frequency direct current pulse measurements.
A production lot displaying uniform high-frequency AC impedance can still exhibit up to thirty percent variance in pulse DC resistance.
Thermal System Sizing and Pack Balancing
Excess heat generation from elevated internal cell resistance forces engineers to expand active liquid cooling infrastructure. Internal heat generation scales strictly with the square of operating current multiplied by direct current resistance (P = I2 RDC). Using 1 kHz alternating current resistance values to calculate thermal loading underestimates operational heat dissipation by 40% to 100%, causing thermal management systems to undersize cold plates and chillers.
Parallel string current distribution relies directly on matched direct current resistance paths. In large energy storage blocks where prismatic cells connect in parallel-series configurations, a cell with elevated direct current resistance draws less current during initial pulse steps, shifting current load onto adjacent lower-resistance cells. This uneven current distribution accelerates degradation in low-resistance cells, inducing thermal gradients across the module and driving premature system-level capacity fade.
- Dual Threshold Assignment establishes maximum acceptable limits for both 1 kHz AC resistance and 10-second DC pulse resistance on incoming quality inspection dossiers.
- Standard Test Temperature Mandate fixes baseline inspection temperature at exactly 25 degrees Celsius with required thermal soak duration recorded on the factory inspection log.
- State of Charge Calibration Clause stipulates testing at 50% state of charge to prevent low SOC diffusion skew from masking baseline electrochemical variance.
- Clamping Pressure Definition quantifies required mechanical constraint force on prismatic cell faces during testing to ensure reproducible measurement geometry.
Incorporating IEC 62660-1 pulse characterization conditions directly into procurement annexes reassigns financial responsibility for internal cell heat losses back to the manufacturer.