Sodium Ion Cathode Crystal Structures and Hard Carbon Intercalation Mechanics
Sodium-ion cells require d002 interplanar spacing above 0.37 nm in hard carbon and stabilized O3/P2 cathode lattices to deliver low-cost zero-volt transport.

Lattice
Sodium-ion cathode materials rely on crystal frameworks that can accommodate an ionic radius of 1.02 Angstroms ~ roughly 34 percent larger than lithium at 0.76 Angstroms. That volumetric penalty governs host architecture, lattice strain tolerance, and phase transition behavior during cycling. Commercial development centers on three crystallographic families: layered transition metal oxides, Prussian blue analogues, and polyanionic frameworks.
Each route presents distinct diffusion bottlenecks, expansion profiles, and thermal thresholds that determine cell-level energy density and service life.
Layered transition metal oxides with the general formula Na_x MO_2 (where M represents one or more metals such as manganese, iron, nickel, or cobalt) form sheets of edge-sharing MO_6 octahedra separated by sodium planes. These are classified under Delmas notation according to the oxygen coordination around the sodium ion (O for octahedral, P for prismatic) and the stacking repeat unit of the transition metal layers. While O3 and P2 phases dominate high-density development, their structural paths diverge sharply under sodiation and desodiation.

Phase Stability and Crystallographic Space Groups
In O3-type cathodes, sodium ions occupy octahedral sites between transition metal slabs in a rhombohedral space group (R-3m). Extracting sodium during charging increases electrostatic repulsion between adjacent oxygen layers, triggering sequential phase shifts from O3 to P3, monoclinic P3′, and eventually OP4 or O”3 configurations above 4.0 V vs Na/Na+. These transitions introduce anisotropic lattice strain that opens microcracks along grain boundaries in polycrystalline particles.
Synthesizing O3 materials as single crystals curbs this strain, allowing capacity retention past 1500 cycles at a 1C rate.
P2-type layered oxides crystallize in a hexagonal space group (P6_3/mmc) with sodium residing in trigonal prismatic sites. Because prismatic sites have wider interstitial apertures than octahedral geometries, they offer lower activation barriers for ion transport. P2 frameworks generally remain stable down to a sodium stoichiometry around x = 0.33.
Deeper extraction causes transition metal planes to glide into an O2 phase, an irreversible shearing that drives up internal cell impedance.
These open prismatic pathways give P2 cathodes strong high-rate performance. However, because their pristine state holds less sodium per formula unit than O3 equivalents, full cells typically need sacrificial sodium additives or pre-sodiated hard carbon anodes to balance total capacity.

Sodium Diffusion Kinetics and Ionic Radius Effects
Lattice diffusion rates depend directly on the geometry of the bottleneck connecting adjacent interstitial sites. In octahedral O3 networks, sodium ions squeeze through a narrow triangular oxygen face to hop between voids, resulting in an activation energy barrier of 0.35 eV to 0.55 eV depending on transition metal valence and composition. Prismatic P2 structures allow direct diffusion through shared rectangular faces, cutting that barrier to between 0.15 eV and 0.25 eV.
O3-type single-crystal samples show roughly a 12 percent volume change across a 2.0 V to 4.2 V operating window. Severe lattice strain fractures particles over time, exposing unpassivated surfaces to parasitic reactions with liquid electrolytes. Dissolved transition metal ions migrate across the separator to foul the hard carbon solid electrolyte interphase, accelerating capacity fade.
Substituting iron or manganese with electrochemically inactive magnesium, aluminum, or titanium stabilizes the metal slabs and keeps unit cell volume variation below 4 percent throughout cycling.
Jahn-Teller Distortions in Manganese Layered Phases
Manganese-rich layered oxides deliver high theoretical capacity from inexpensive precursors, but they are vulnerable to structural degradation driven by cooperative Jahn-Teller distortions. High-spin trivalent manganese (Mn3+, d4) possesses degenerate orbital configurations that stretch surrounding MnO_6 octahedra into asymmetric tetragonal shapes. Discharging below 2.5 V vs Na/Na+ raises Mn3+ concentrations enough to trigger a bulk phase transition from hexagonal or rhombohedral symmetry into a distorted monoclinic phase (C2/m).
This lattice distortion generates shear stress across active grains. Extended cycling degrades internal conductive pathways and accelerates manganese dissolution into the carbonate electrolyte. Doping lattice sites with copper, nickel, or zinc disrupts long-range Mn3+ ordering, suppressing the structural shift without sacrificing usable redox capacity.

Prussian Blue Analogues and Coordination Water Defects
Prussian Blue Analogues (PBAs) form an open cubic framework with the general formula A_x M1 _1-y v_y. z H_2 O, where A is an alkali ion such as sodium, M1 and M2 are transition metals coordinated to nitrogen and carbon, and v represents hexacyanoferrate vacancies housing coordinated water. The face-centered cubic lattice (Fm-3m) provides wide interstitial voids and continuous 3D transport channels broader than 3.2 Angstroms. This open network allows rapid ion migration while holding unit cell volume changes under 2 percent across full cycles.
The primary barrier to commercial PBA deployment lies in structural vacancies that trap coordinated and interstitial water. Under operating voltages, this residual water reacts with salts like NaPF_6 to generate hydrofluoric acid, attacking current collectors and dissolving the host lattice. High-purity Prussian White materials ~ crystallized under controlled conditions to restrict vacancies below 2 percent and coordination water under 0.1 moles per formula unit ~ deliver specific capacities of 150 mAh/g with initial coulombic efficiencies above 97 percent.
The steric activation energy of sodium diffusion through prismatic P2 lattice bottlenecks remains lower than octahedral O3 networks across all state-of-charge windows.
Polyanionic structures such as NASICON-type Na_3 V_2 (PO_4)_3 rely on robust corner-sharing PO_4 tetrahedra and VO_6 octahedra within a trigonal space group (R-3c). These covalent frameworks provide flat discharge profiles and thermal stability up to 450 degrees Celsius. However, native electronic conductivity remains below 10^-9 S/cm, necessitating conductive carbon networks and reduced particle sizes to sustain high discharge rates.
| Cathode Architecture | Space Group | Theoretical Capacity (mAh/g) | Volumetric Density (Wh/L) | Upper Cutoff (V vs Na/Na+) | Volume Change (%) | Primary Failure Mode |
|---|---|---|---|---|---|---|
| Layered O3-NaNaNiMnCoO2 | R-3m | 170 | 380 | 4.15 | 8.5 to 12.0 | Phase transition microcracking |
| Layered P2-NaNaFeMnNiO2 | P6_3/mmc | 140 | 320 | 4.00 | 3.0 to 5.5 | P2-O2 phase sliding at high SOC |
| Prussian White Na2FeFe(CN)6 | Fm-3m | 170 | 260 | 3.80 | 1.2 to 2.5 | Proton generation from vacancy water |
| NASICON Na3V2(PO4)3 | R-3c | 117 | 220 | 3.60 | 1.0 to 1.8 | Electronic conductivity bottlenecks |
High-voltage capacity decay is often treated as electrolyte breakdown rather than surface phase collapse, yet chemical profiling shows surface oxygen loss at single-crystal interfaces forms an insulating rock-salt phase well before bulk solvent decomposition begins.

Pores
Hard carbon serves as the standard anode for sodium-ion cells. Unlike graphite, which intercalates lithium cleanly between ordered sheets, hard carbon contains short, randomly oriented turbostratic graphene domains interspersed with amorphous carbon and closed nanopores. This disordered architecture resists graphitization even past 2500 degrees Celsius.
The resulting interplanar spacing (d_002) of 0.37 to 0.40 nanometers readily accepts the 1.02 Angstrom sodium ion, whereas graphite (d_002 of 0.335 nanometers) demonstrates negligible sodium uptake at ambient pressure.
Sodium insertion into hard carbon occurs across two distinct voltage profiles: a sloping region from 1.2 V down to 0.1 V vs Na/Na+, followed by a flat plateau from 0.1 V down to 0.0 V vs Na/Na+. The balance between these mechanisms governs rate capability, plating margins, and gravimetric energy density.
Turbostratic Graphite Stacks and Interplanar Spacing
Turbostratic graphene domains consist of small, imperfectly stacked aromatic sheets containing vacancies, edge defects, and precursor-derived heteroatoms like oxygen or nitrogen. Lateral domain sizes (L_a) generally span 1 to 3 nanometers, with stacking heights (L_c) limited to 2 to 5 graphene layers. This short-range order exposes an abundance of edge sites and defect zones.
The interplanar d_002 spacing controls whether sodium can insert between parallel sheets. Below 0.36 nanometers, steric constraints and electronic repulsion sharply increase insertion overpotentials. Once d_002 widens beyond 0.37 nanometers, sodium intercalates smoothly at minimal overpotential, forming dilute sodium-graphite intercalation compounds without delaminating the host structure.

Sloping Voltage Domains and Surface Adsorption Mechanics
The sloping segment between 1.2 V and 0.1 V vs Na/Na+ corresponds to capacitive adsorption onto accessible defect sites, edge vacancies, and surface functional groups. Ion transport in this region features low charge-transfer resistance, enabling fast charging and high power output.
While adsorption capacity scales with defect density, excessive surface area compromises initial coulombic efficiency (ICE) by promoting uncontrolled solid electrolyte interphase (SEI) growth. Solvent and salt reduction on defective surfaces irreversibly traps sodium from the cathode. Modifying surface chemistry ~ through chemical vapor deposition or controlled thermal etching ~ limits excess porosity to balance sloping capacity against production ICE targets.
Closed Nanopore Filling and Condensation Thermodynamics
The low-potential plateau below 0.1 V vs Na/Na+ provides the bulk of hard carbon’s reversible capacity and determines cell energy density. While adsorption versus intercalation mechanisms remain a subject of discussion, experimental evidence shows sodium ions condensing into metallic-like quasi-atomic clusters within enclosed internal nanopores in this low-voltage window.
These internal voids develop along boundary intersections during high-temperature carbonization, yielding isolated cavities between 0.5 and 2.0 nanometers wide. Near 0.0 V vs Na/Na+, desolvated sodium ions migrate through sheet defects into the cavities. The physical confinement alters local reduction thermodynamics, allowing sodium clusters to condense just above the potential for bulk plating.
Nanopore volume and neck dimensions dictate the reversibility of this process. Tight entrance apertures exclude bulky solvent molecules, keeping internal surfaces clear of passivating SEI films so metallic clusters can form and dissolve reversibly. However, heavy reliance on plateau capacity increases operational risk: rapid charging near 0.0 V vs Na/Na+ can drive local overpotentials negative, plating metallic sodium onto external surfaces instead of filling interior pores.

Which Hard Carbon Precursor Prevents Sodium Plating?
Precursor selection sets the baseline pore network, d_002 spacing, and particle morphology of hard carbons. Feedstocks fall into three main classes: biomass (such as coconut shells or wood flour), synthetic resins (including novolac and polyacrylonitrile), and pitch residues from petroleum or coal processing. Each develops distinct structural features when carbonized between 1000 degrees Celsius and 1400 degrees Celsius.
Biomass precursors preserve natural transport channels and abundant oxygen functional groups, pyrolyzing into disordered carbon matrices with wide d_002 spacing (0.375 nm to 0.385 nm) and extensive closed porosity. Coconut shell carbons treated at 1200 degrees Celsius reach reversible capacities above 330 mAh/g, with the low-voltage plateau contributing over 60 percent of total storage. However, raw biomass contains inorganic ash (silica, iron, potassium) that accelerates electrolyte decomposition and local plating, requiring acid washing to bring ash content below 0.05 weight percent.
Synthetic phenolic resins produce pure, structural hard carbons with uniform spherical morphology. Carbonization at 1300 degrees Celsius yields narrow pore networks centered near 1.1 nanometers and smooth surfaces that restrict SEI growth, achieving initial coulombic efficiencies above 88 percent. Higher feedstock costs limit resin-derived carbons largely to premium high-drain applications.
Pitch residues pass through a liquid mesophase during thermal breakdown, which naturally aligns graphene sheets. Preventing graphitization requires an oxidative stabilization step between 250 degrees Celsius and 350 degrees Celsius prior to carbonization. This cross-linking locks in structural disorder, yielding dense particles with low surface area (under 5 m^2/g) and minimal formation losses, though tighter turbostratic stacks slightly constrain high-rate ion transport relative to biomass carbons.
A d_002 interplanar spacing below 0.36 nanometers increases sodium insertion overpotentials, triggering surface sodium deposition during high-rate charging steps.
Metallic dendrites formed during overpotential plating can penetrate polyolefin separators, creating internal short circuits. Cell engineering counters this by maintaining an anode-to-cathode capacity (N/P) ratio between 1.10 and 1.25, ensuring adequate anode capacity to prevent surface deposition during fast charging.
The primary manufacturing challenge is expanding internal closed pore volumes to maximize plateau capacity without thinning pore walls or opening external channels that invite electrolyte ingress during long-term cycling.
Bench
Characterizing sodium-ion performance requires dedicated test channels, stable reference electrodes, and precise temperature regulation. Protocols adapted directly from lithium-ion testing often yield skewed data. For instance, metallic sodium reference electrodes degrade rapidly in standard alkyl carbonate electrolytes, generating potential drift that distorts measured overpotentials and phase transitions.
Initial Coulombic Efficiency serves as the primary benchmark for electrode components. Hard carbon anodes deliver ICE values between 75 and 88 percent, trailing the 90 to 94 percent typical of lithium graphite. This loss stems from irreversible sodium consumption during initial formation, where cathode-derived ions decompose solvent and salt to build the anode SEI.
Initial Coulombic Efficiency and Solid Electrolyte Interphase Formation
The composition and mechanical stability of the SEI layer control capacity retention, storage life, and cell resistance. In sodium systems, the interphase forms a stratified film: an inner inorganic layer of reduction products (NaF, Na_2 CO_3, Na_2 O) adjacent to the carbon surface, beneath an outer matrix of sodium alkyl carbonates (ROCO_2 Na) and alkoxides (RONa).
These sodium species dissolve more readily in conventional carbonate solvents (EC, DMC, DEC) than their lithium counterparts. Ongoing dissolution exposes bare carbon to continuous electrolyte reduction during calendar storage and elevated-temperature cycling. Incorporating 2 to 5 weight percent fluoroethylene carbonate (FEC) builds a dense, NaF-rich inorganic SEI that resists solvent dissolution and passivates the interface.
Solvation Shell Structure and Electrolyte Additive Selection
Ion mobility in liquid electrolytes depends on the configuration of the primary solvation shell around Na+ cations. Owing to its larger radius and lower charge density, sodium exerts a weaker electrostatic field on solvent dipoles than lithium, forming a more dynamic, loosely coordinated shell.
This lower desolvation energy facilitates interfacial charge transfer, enabling operation down to -40 degrees Celsius. Standard electrolytes use 1.0 M to 1.5 M NaPF_6 or NaFSI in mixed carbonate solvents. NaFSI provides higher conductivity (up to 10 mS/cm at 25 degrees Celsius) and greater thermal stability than NaPF_6, but uncoordinated FSI- anions pit aluminum cathode current collectors above 3.5 V vs Na/Na+.
Preventing corrosion requires high-purity salts, fluorinated co-solvents, or passivating additives like sodium phosphates.
Ether solvents, such as diglyme or tetraglyme with NaFSI, allow sodium ions to co-intercalate into carbon hosts as solvated Na+-ether complexes without desolvation. This mechanism operates rapidly with minimal first-cycle capacity loss, pushing ICE above 98 percent. However, ethers oxidize below 3.8 V vs Na/Na+, restricting their use in high-voltage layered oxide configurations.

Electrochemical Impedance Growth and Reference Electrode Protocols
Tracking cell degradation relies on Electrochemical Impedance Spectroscopy (EIS). Nyquist spectra resolve high-frequency bulk electrolyte resistance (R_b), mid-frequency SEI transport resistance (R_sei), lower-frequency charge-transfer resistance (R_ct), and a low-frequency Warburg tail (W_o) reflecting solid-state diffusion.
In aged hard carbon anodes cycled through 2000 deep discharges, charge-transfer resistance R_ct emerges as the primary driver of power fade. The combination of SEI growth and transition metal contamination increases R_ct by 200 to 400 percent. Isolating individual electrode contributions requires three-electrode cells with sodium-bismuth or sodium-tin alloy reference pins, which hold potential drift within +/- 0.5 mV over extended cycling.
Validating full cells requires uniform control over voltage cutoffs, C-rates, and testing ambient. Standard lifecycle qualification runs at 25 degrees Celsius +/- 2 degrees Celsius under constant-current constant-voltage (CCCV) charging followed by constant-current (CC) discharge down to 1.5 V or 1.0 V, depending on the active chemistry.
Testing protocols for sodium-ion cells mandate specific qualification criteria to isolate real chemical degradation from baseline measurement noise:
- Thermal Stabilization Window rests cells in environmental chambers for at least 4 hours at target temperatures before electrical testing begins.
- Three-Electrode Reference Setup uses calibrated sodium-alloy reference pins to separate single-electrode potential shifts from total cell impedance growth.
- High-Precision Coulombic Efficiency tracks cycle-by-cycle charge retention using calibrated current sources with stability tolerances below 0.005 percent.
- Differential Capacity Analysis processes dQ/dV plots from ultra-low C-rate cycles (0.05C) to identify phase transitions and active material loss mechanisms.
- Zero-Volt Storage Hold subjects fully discharged cells to a 0.0 V short-circuit condition for 14 days to verify current collector stability.
Standardized quality control clauses in battery supply agreements mandate cell capacity testing under a constant-current 0.33C rate at 25 degrees Celsius with voltage boundaries defined from 1.5 V to 4.0 V.
Cell testing shows that storage at 55 degrees Celsius accelerates ester exchange in organic carbonate electrolytes, speeding up gas generation and capacity loss.
Reliable bench assessments require consistent execution across all channels to prevent temperature variations from obscuring degradation mechanisms.
Yield
Scaling sodium-ion manufacturing involves adapting lithium-ion lines to accommodate the distinct moisture sensitivity, reactivity, and mechanical properties of sodium materials. Factory yield hinges on strict atmospheric control across mixing, coating, dry rooms, and formation suites to prevent line-specific defect modes.
Moisture ingress during cathode slurry preparation is a primary cause of line downtime. Manganese-rich layered oxides (such as Na_0.67 Ni_0.33 Mn_0.67 O_2 or NaNi_0.3 Fe_0.4 Mn_0.3 O_2) are strongly hygroscopic. In environments exceeding 10 percent relative humidity, lattice sodium leaches to particle surfaces, reacting with ambient water and carbon dioxide to yield sodium hydroxide (NaOH) and sodium carbonate (Na_2 CO_3).

Atmospheric Water Absorption and Slurry Rheology Shifts
Surface base accumulation drives NMP slurry pH past 12, initiating base-catalyzed dehydrofluorination and gelation of PVDF binders during mixing. Viscosity climbs from normal processing targets (3000 to 6000 mPa s) into unpumpable gels exceeding 25000 mPa s, causing severe coating weight variations on slot-die lines.
Precursor exposure during material transfers can ruin cathode slurry batches within 45 minutes of mixing. Vacuum-baking active powders at 200 degrees Celsius and introducing organic acids (oxalic or citric acid) into the NMP solvent neutralizes surface alkalinity, stabilizing slurry rheology over 24-hour production shifts.
Prussian Blue Analogues require stricter atmospheric controls. Coordinated water held within the framework cannot be removed by standard convective drying; it demands inline vacuum treatment at 180 degrees Celsius for 12 hours prior to slurry mixing, alongside dry room dew points maintained below -50 degrees Celsius (under 0.05 percent relative humidity).
Co-Solvent Evaporation and Binder Migration during Drying
Hard carbon anodes generally process using aqueous binders (CMC and SBR). Although water-based slurries eliminate solvent recovery costs, hard carbon surfaces are naturally hydrophobic and wet poorly in pure water. Slurry stability requires non-ionic surfactants or alcohol co-solvents to ensure homogeneous dispersion.
During oven drying, fast water evaporation pulls soluble binder toward the coating surface. This binder segregation weakens interfacial adhesion to the current collector, causing micro-delamination during calendering and winding. Zoned drying profiles ~ starting at 60 degrees Celsius to limit convection before stepping to 110 degrees Celsius for final drying ~ maintain uniform binder distribution through the electrode thickness and ensure peel strengths above 15 N/m.
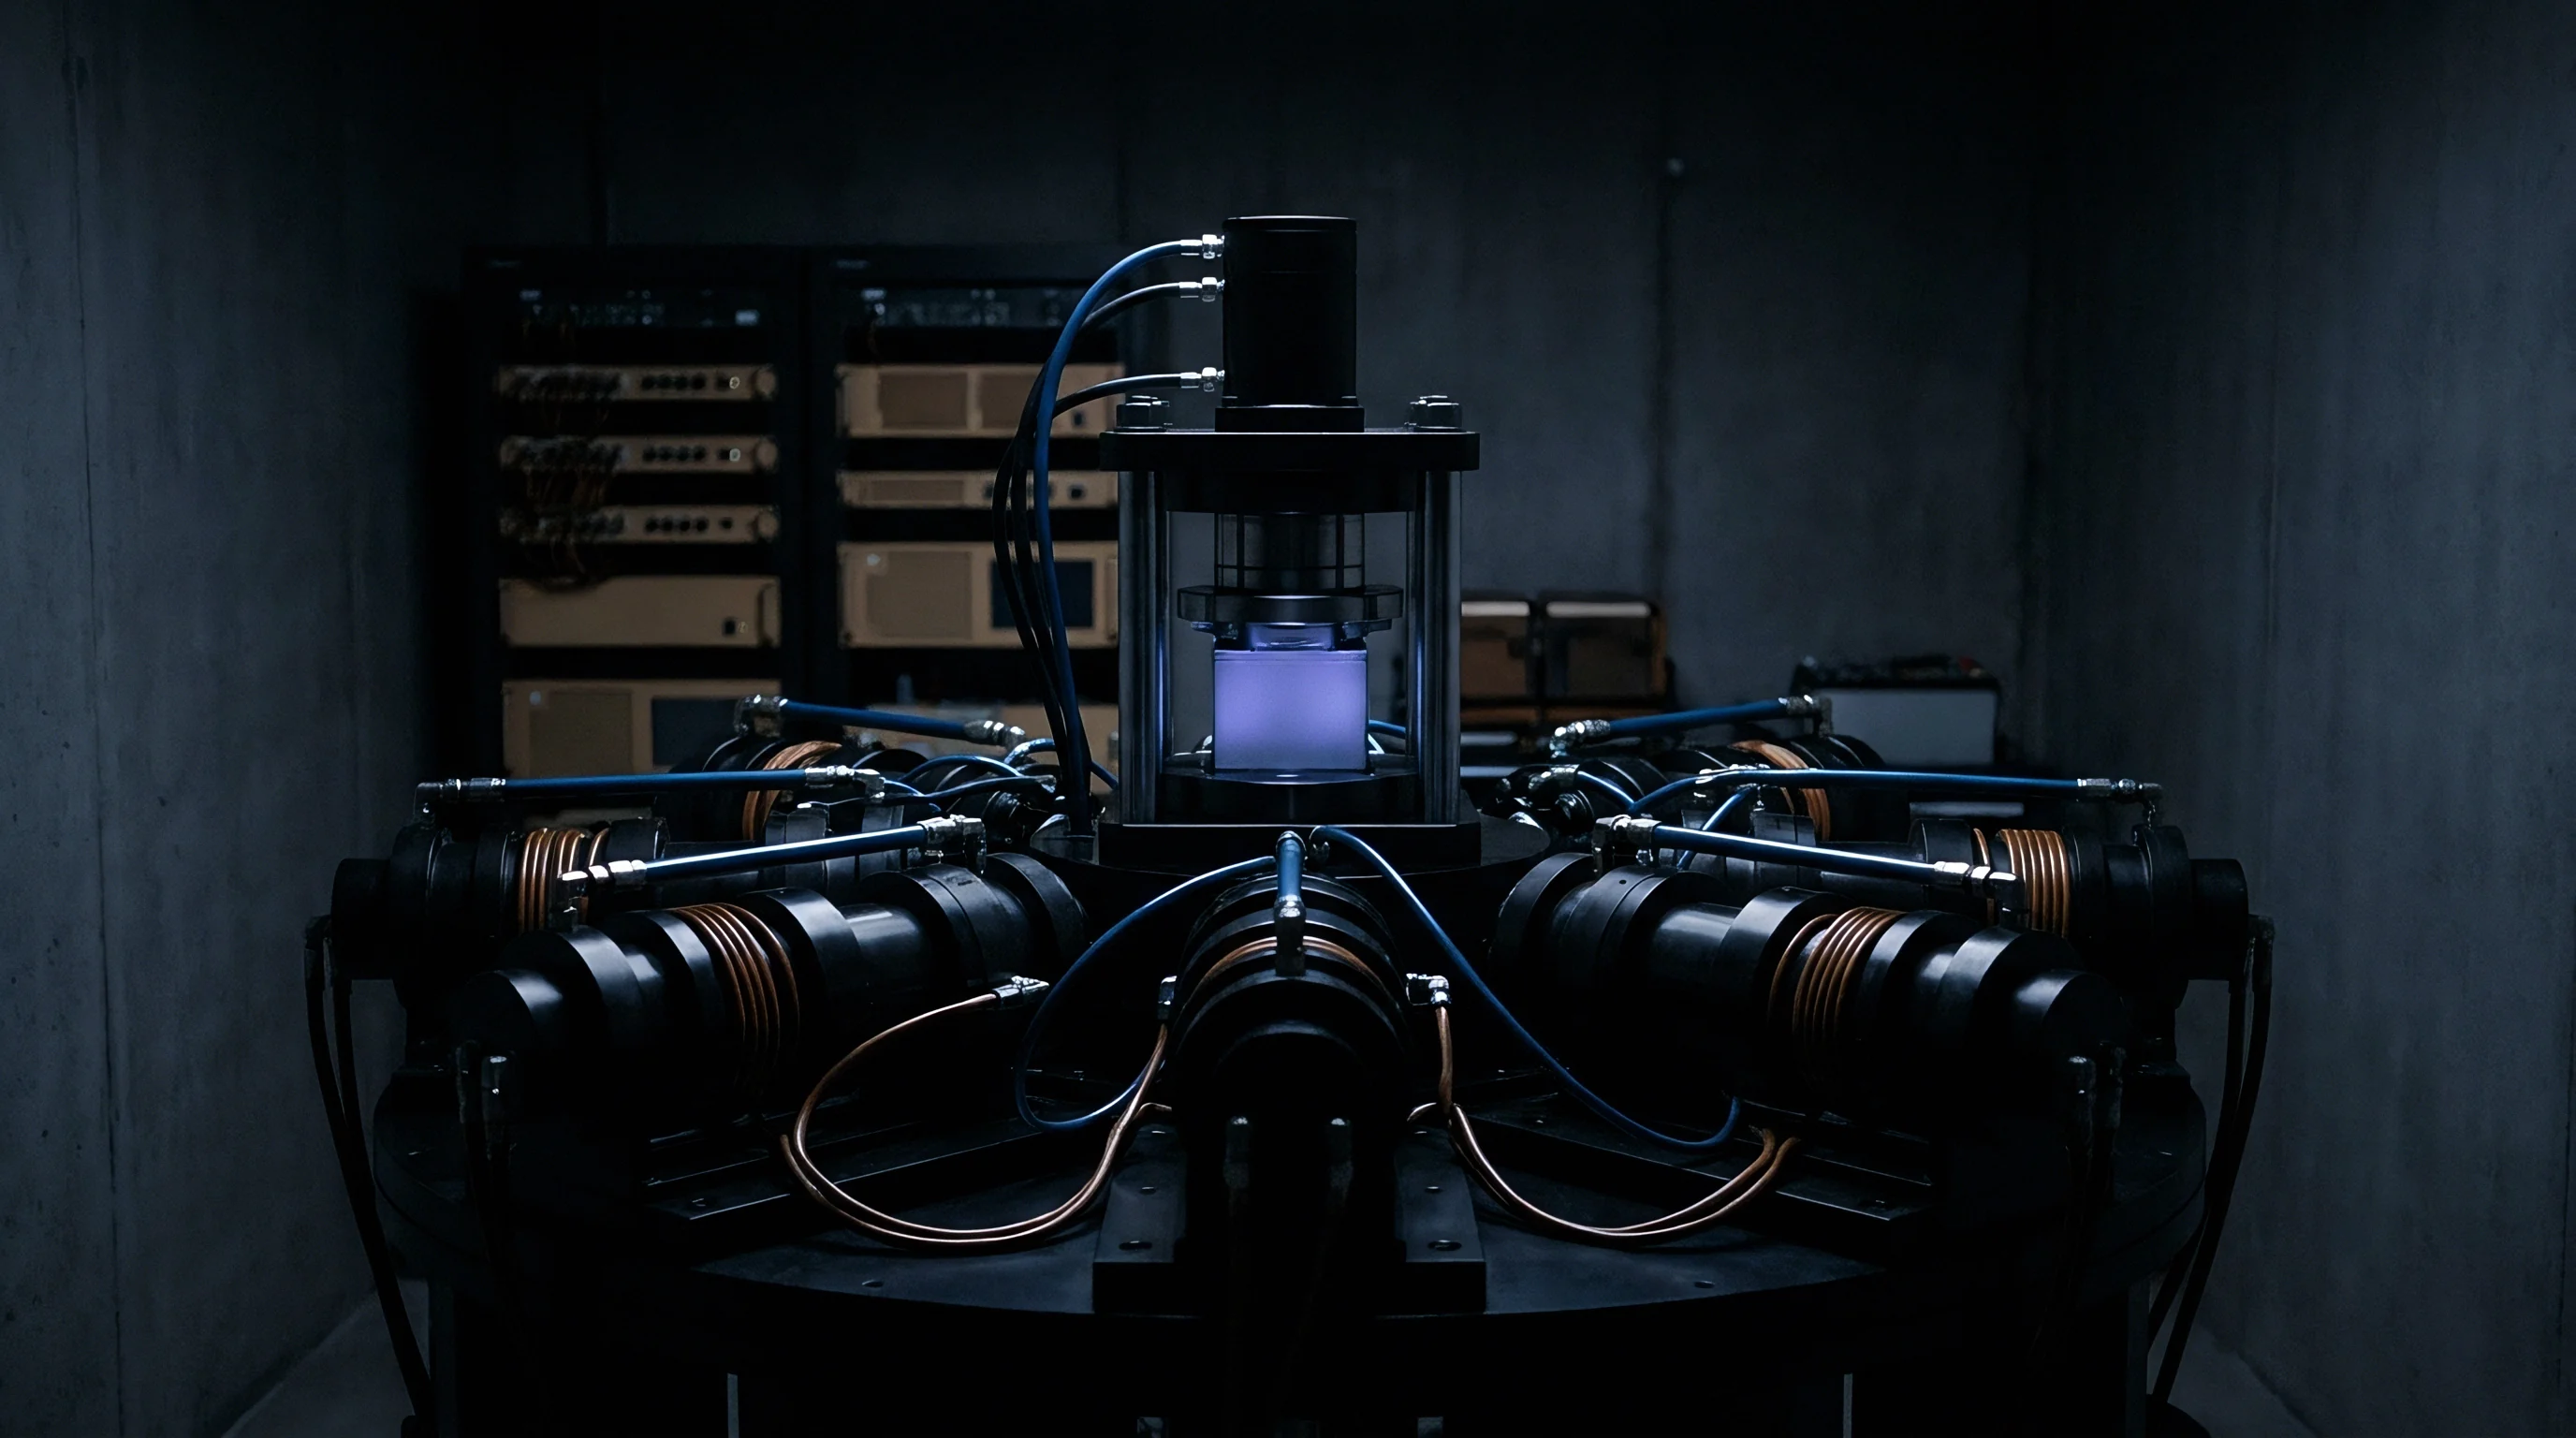
Formation Profiles and Interfacial Degassing Protocols
Formation cycling passivates the active surfaces and converts dry components into working cells. Because hard carbon exhibits lower ICE, initial reduction of carbonate solvents between 0.8 V and 0.2 V vs Na/Na+ evolves substantial gas volumes, primarily carbon monoxide (CO), carbon dioxide (CO_2), ethylene (C_2 H_4), and hydrogen (H_2).
Pouch cell lines control gas buildup via two-stage formation paired with inline degassing. Cells are charged to 30 percent state-of-charge under mechanical platens at 0.3 MPa to 0.6 MPa, driving gas into an attached collection pocket. A puncture tool evacuates the pocket in a vacuum chamber (-95 kPa) before final secondary heat-sealing.
Pouch cell line operators follow a strict sequence of execution steps to verify batch quality and isolate defective units prior to final boxing:
- Electrode foil moisture measurement via Karl Fischer coulometric titration, enforcing upper limits of 150 ppm for hard carbon anodes and 200 ppm for layered oxide cathodes.
- Inline coat weight inspection using beta-ray transmission gauges, rejecting roll segments that deviate beyond +/- 1.5 percent from target mass loading specifications.
- Separator pinhole and dielectric testing during winding or stacking, applying a high-voltage impulse (500 V DC) to flag internal micro-shorts before electrolyte filling.
- Precision vacuum dosing of electrolyte, tracking absorbed mass per cell to within +/- 0.1 grams.
- High-temperature formation aging for 48 hours at 45 degrees Celsius with continuous open-circuit voltage (OCV) tracking to log self-discharge rates (K-value).
- Final capacity grading across three complete cycles, sorting cells into matched capacity bands within +/- 1.0 percent of nominal rating.
| Production Stage | Key Control Parameter | Standard Industry Tolerance | Sodium-Ion Tightened Window | Yield Consequence of Exceedance |
|---|---|---|---|---|
| Cathode Slurry Mixing | Slurry pH Level | 8.5 to 10.0 | 7.5 to 9.2 | PVDF gelation, mass loading defects |
| Coating & Drying Enclosure | Enclosure Dew-Point | -40 degrees C | -55 degrees C | Phase breakdown, crystal degradation |
| Anode Edge Slitting | Burr Height Threshold | under 12 micrometers | under 8 micrometers | Separator puncture, micro-shorting |
| Electrolyte Injection | Water Content in Salt/Solvent | under 20 ppm | under 10 ppm | Hydrofluoric acid formation, gas generation |
| Formation Degassing | Residual Gas Volume | under 0.5 mL per Ah | under 0.2 mL per Ah | Interfacial dry spots, rapid capacity decay |
An undetected dew-point excursion inside an unsealed mixing room degraded a 10,000-cell production run, resulting in 42,000 USD of scrapped active materials and spent processing solvent.

Dock
International shipping of sodium-ion cells requires adherence to specific dangerous goods regulations. Global transport bodies established dedicated classifications reflecting the distinct properties of sodium systems ~ a framework that directly impacts freight rates, transit handling, and port clearance timelines.
A core logistical advantage of sodium-ion chemistry is its tolerance for zero-volt storage. Discharging lithium-ion cells below 1.5 V causes the copper anode foil to dissolve into the electrolyte as Cu2+ ions, which later plate out as dendrites during recharge and induce internal short circuits. Lithium cells must therefore ship at 30 to 50 percent state-of-charge (SOC) to prevent overdischarge during transit.
Zero Volt Discharge Mechanics and Collector Foil Integrity
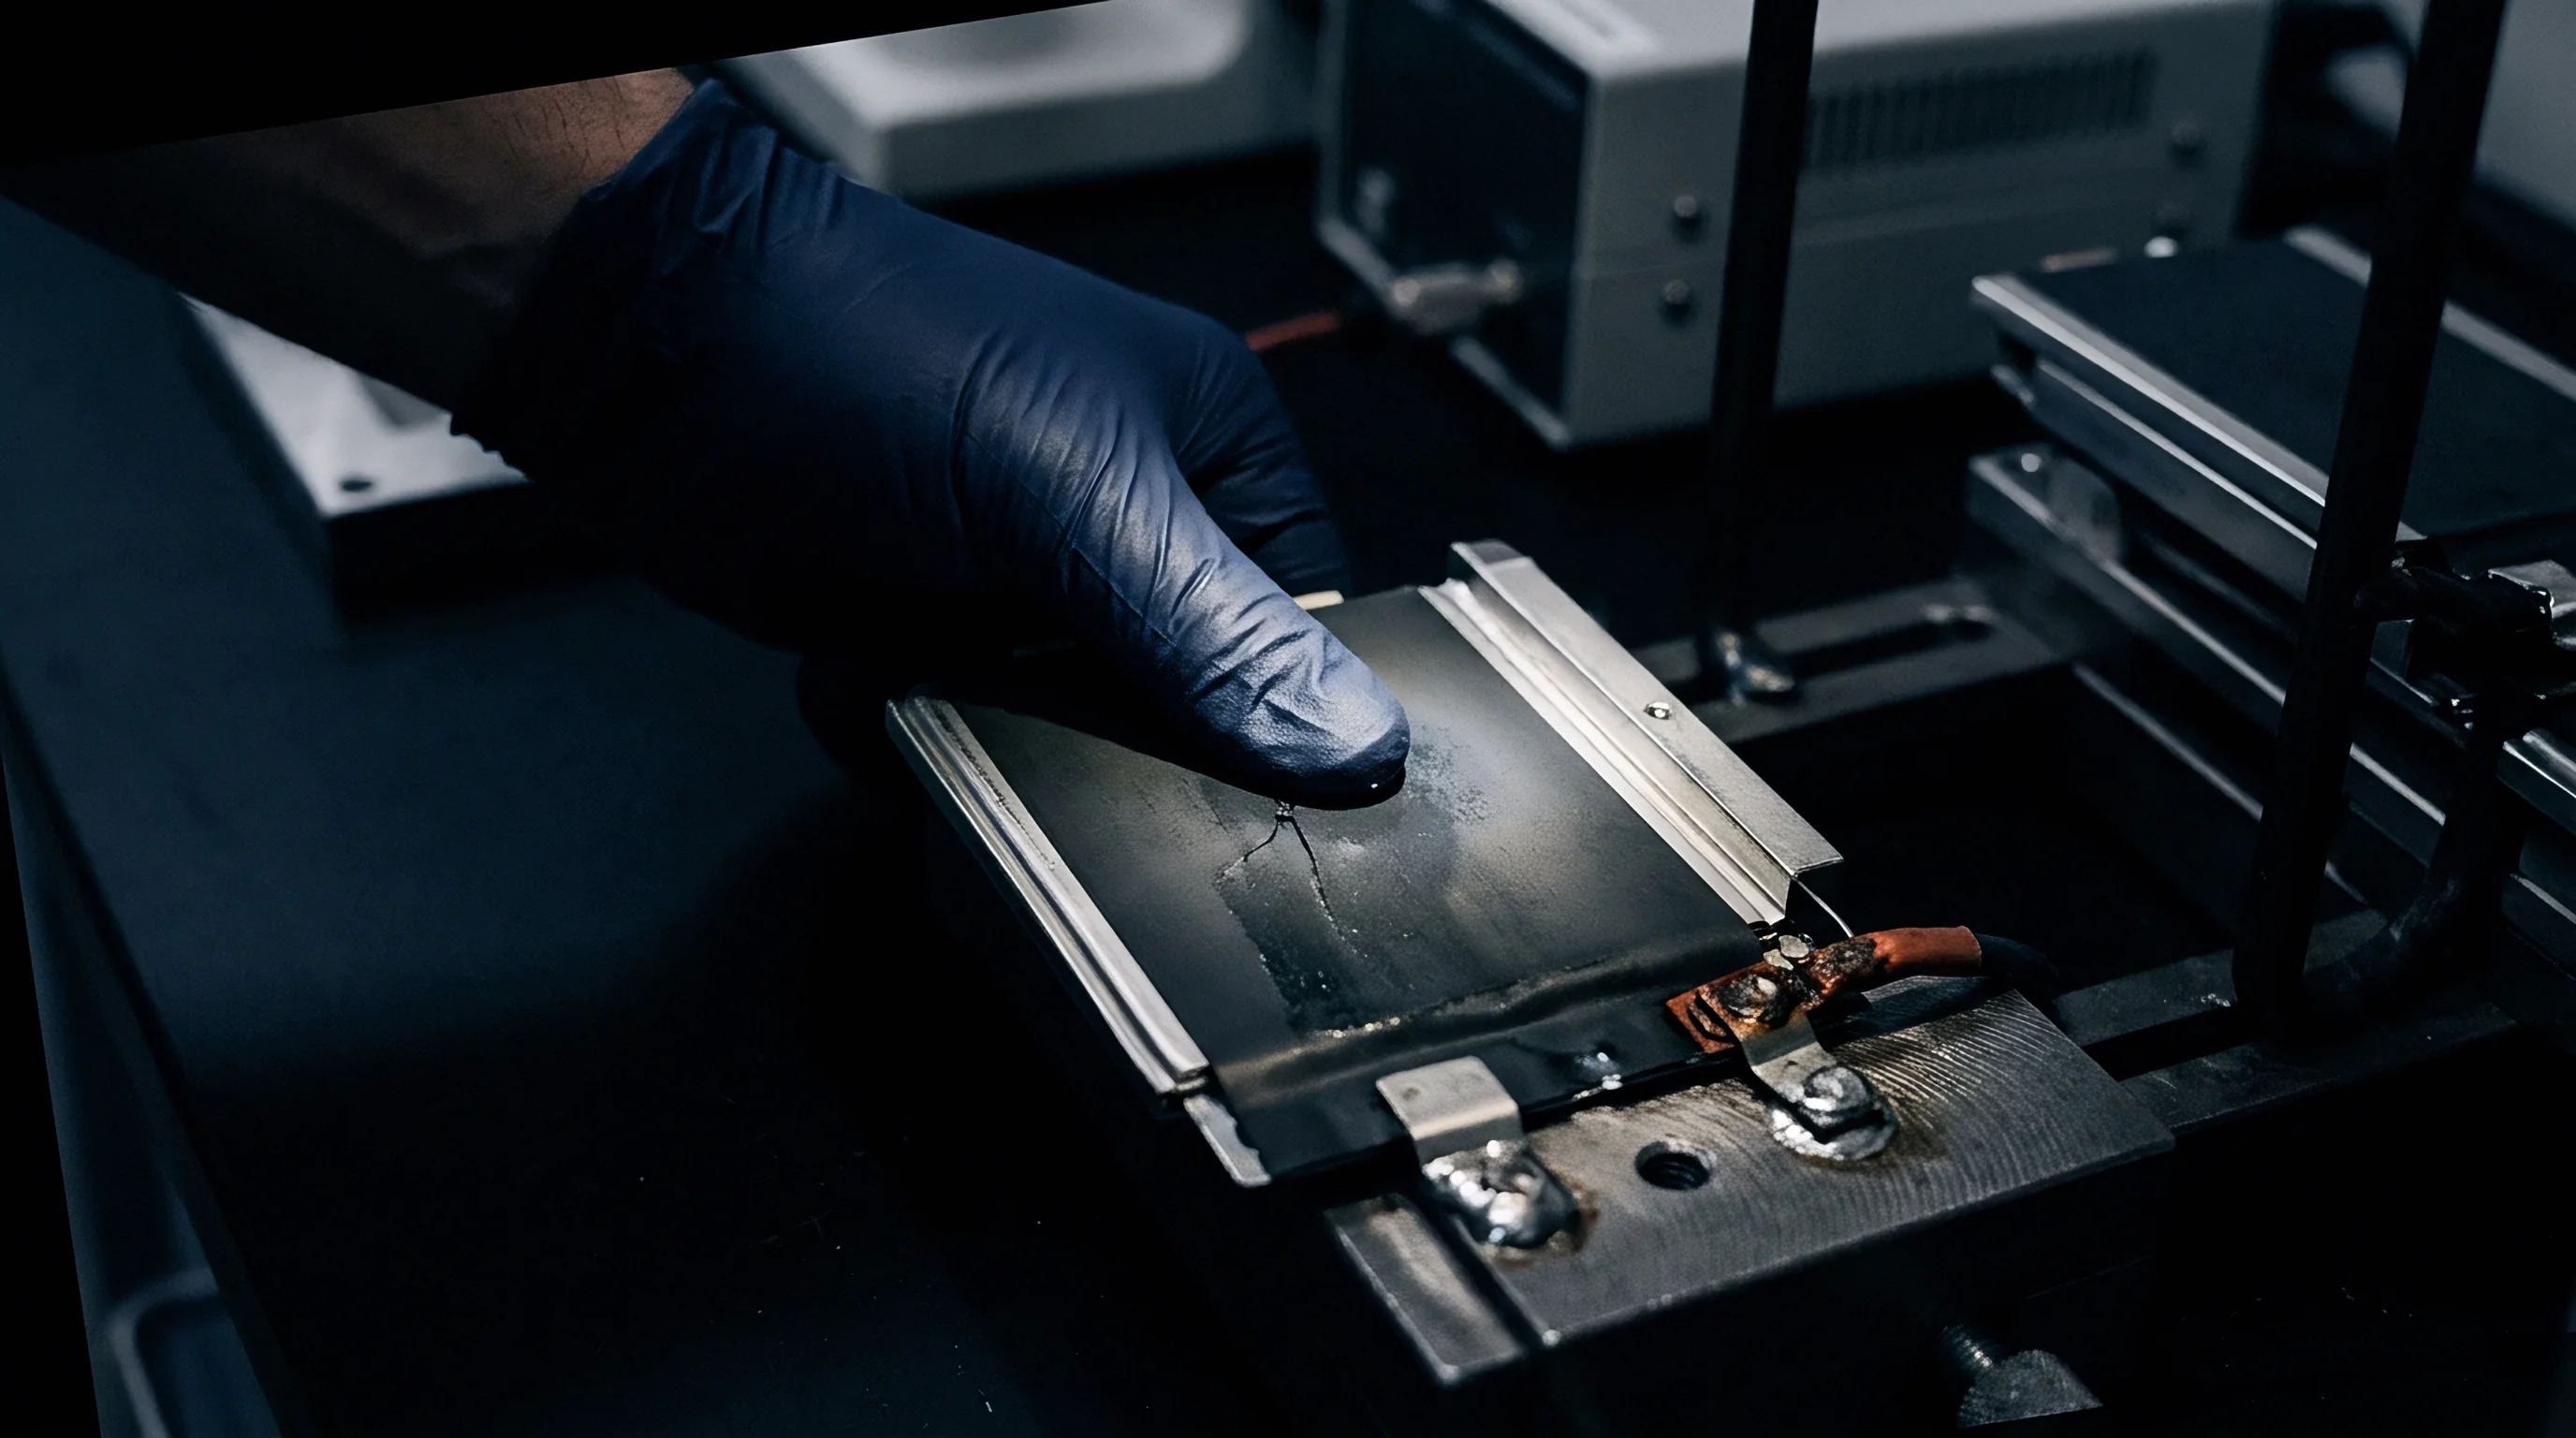
Sodium does not alloy with aluminum at low operating potentials, whereas lithium alloys below 0.6 V vs Li/Li+. Sodium-ion cells can therefore replace heavy copper anode collectors with aluminum foil on both electrodes. Because aluminum remains stable at 0.0 V vs Na/Na+, sodium cells can be stored or shipped at zero volts with external shorting clips bridging the terminals.
At 0.00 V, the cell contains zero stored electrochemical energy, eliminating risks of thermal runaway, arcing, or self-sustaining fires from puncture or crushing during transport. Certified zero-volt sodium shipments bypass the 30 percent SOC air freight restriction mandated for lithium batteries.
Thermal Runaway Propagation Rates and Gas Vent Composition
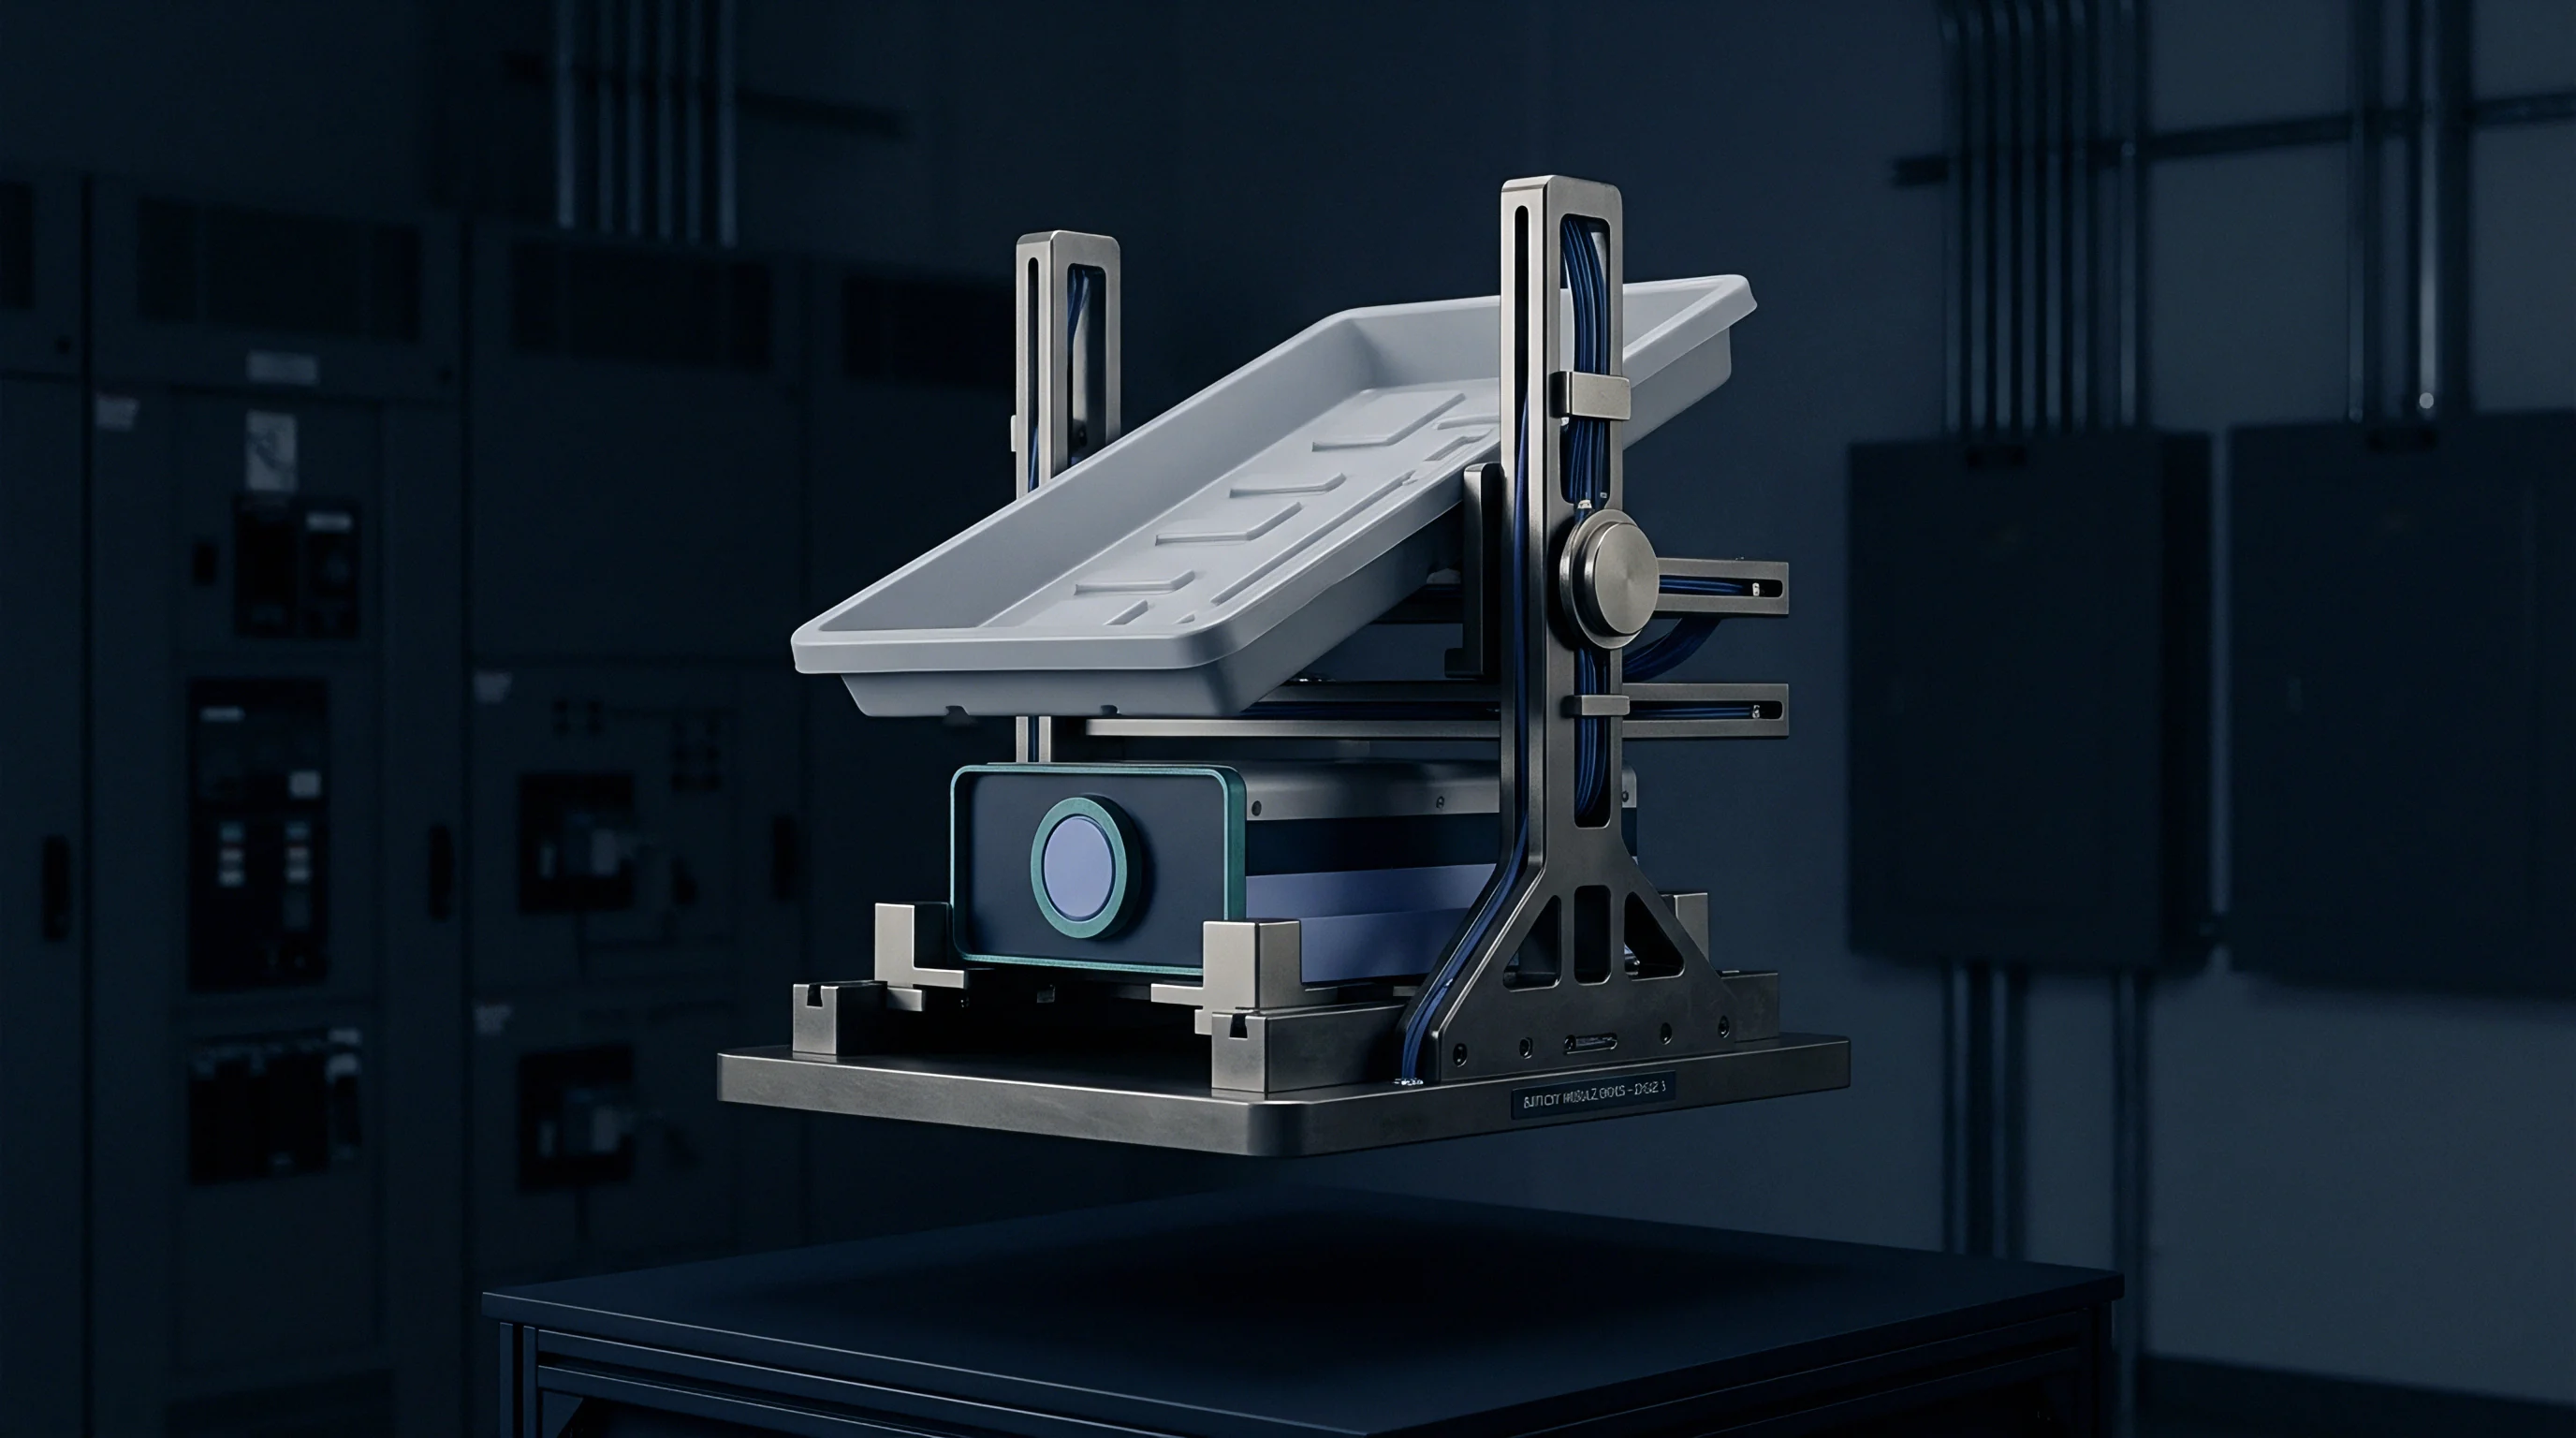
In a charged state, sodium-ion batteries remain classified as hazardous cargo. Accelerated Rate Calorimetry (ARC) data shows that sodium cells exhibit self-heating onset temperatures (T_onset) higher than high-nickel NMC, performing closer to lithium iron phosphate (LFP).
Under thermal runaway conditions above 170 degrees Celsius, cathode decomposition releases oxygen that oxidizes the flammable solvent. Gas analysis detects carbon monoxide, methane, hydrogen, and volatile carbonates. However, lower gravimetric energy density keeps peak flame temperatures and thermal propagation rates (dT/dt) lower than in nickel-rich lithium cells, reducing the likelihood of module-level cascade failure.

Dangerous Goods Transport Classification and UN Certification
The United Nations Committee of Experts on the Transport of Dangerous Goods introduced dedicated UN shipping numbers for sodium-ion batteries to establish clear regulatory criteria:
- UN 3551 designates Sodium-Ion Batteries containing organic liquid electrolyte (Class 9).
- UN 3552 covers Sodium-Ion Batteries packed with or installed in equipment under Class 9 rules.
- UN 3292 covers legacy thermal Sodium-Beta batteries containing metallic sodium or sodium alloy cores (Class 4.3, dangerous when wet).
- UN 38.3 Testing Manual specifies mandatory shock, vibration, thermal impact, altitude simulation, short circuit, and overcharge testing for transport approval.
Securing UN 3551 certification requires completing the destructive testing suite outlined in Section 38.3 of the UN Manual of Tests and Criteria at an accredited testing facility.
International procurement agreements require full verification of all logistics declarations and dangerous goods documentation:
- Dangerous Goods Declaration Form specifying UN shipping names, Class 9 designation, net chemical weight, and packing group codes.
- UN 38.3 Test Summary Report from an accredited lab detailing test completion dates and pass metrics for altitude, thermal, vibration, shock, short-circuit, impact, overcharge, and forced discharge.
- Material Safety Data Sheet (MSDS) listing CAS numbers, spill containment, PPE requirements, and fire extinguishing rules (Class D dry powder versus water deluge).
- Zero-Volt Shorting Certification signed by plant quality managers, confirming zero-energy cells maintain shorting bridges across terminals with open-circuit potentials under 0.05 V upon packing.
Special Provision 188 under maritime codes permits small cells under 20 Wh and modules under 100 Wh to travel under simplified cargo classifications, provided the packaging survives a 1.2-meter drop test without internal damage or electrolyte leakage.

Ledger
Commercial adoption of sodium-ion technology depends on beating the landed cost of lithium iron phosphate (LFP). While sodium cell energy density (130 Wh/kg to 170 Wh/kg) sits below LFP (160 Wh/kg to 210 Wh/kg) and NMC (230 Wh/kg to 300 Wh/kg), its supply base avoids tight geographic concentration and extreme mineral price volatility. Translating raw material advantages into delivered cost improvements requires balancing cell bill of materials, processing costs, trade duties, and cycle life expectations.
Raw sodium carbonate (Na_2 CO_3) trades globally between 200 USD and 400 USD per metric ton, compared to battery-grade lithium carbonate (Li_2 CO_3), which has historically fluctuated between 12,000 USD and 70,000 USD per metric ton. This precursor delta directly reduces active cathode costs.

Raw Material Bill of Materials Variance Breakdown
Cell bill of materials (BOM) consists of active electrode materials, collector foils, separators, electrolyte salts, solvents, binders, and cell hardware. In LFP cells, lithium carbonate accounts for 20 to 35 percent of total BOM cost depending on market conditions. In sodium cells, sodium precursors represent less than 3 percent.
The cost dynamic reverses at the anode. Synthetic graphite for lithium cells ranges from 4,000 USD to 8,000 USD per metric ton, whereas commercial hard carbon commands 8,000 USD to 15,000 USD per metric ton due to smaller manufacturing volumes and multi-stage precursor preparation. As hard carbon production scales to gigawatt-hour volumes, improved precursor processing is projected to bring prices closer to 4,500 USD per metric ton.
Current Collector Replacement and Processing Economics
Switching from copper to aluminum anode foil yields immediate savings. Lithium cells require 4.5 to 8 micrometer copper foil on the anode, priced at 10 USD to 14 USD per kilogram (roughly 3.00 USD to 4.20 USD per square meter). Sodium cells utilize 12 to 15 micrometer aluminum foil on both electrodes, running 3.50 USD to 5.00 USD per kilogram (approximately 0.35 USD to 0.50 USD per square meter).
This change lowers total cell BOM cost by 8 to 12 percent. Dual-aluminum collector systems also simplify procurement, reduce inventory requirements, and cut scrap rates during slitter blade changeovers.

Cost per Delivered Cycle over Stationary Power Lifespans
For stationary energy storage (ESS), evaluation centers on Levelized Cost of Storage (LCOS) across operating lifespans rather than upfront pack capital expense ($/kWh) alone. Lifetime delivered energy reflects baseline pack density, depth of discharge (DOD), round-trip efficiency (RTE), and capacity degradation rates.
Structuring supply agreements around this lower material baseline caps price escalation against lithium spot indexes. High-quality sodium-ion cells with single-crystal layered oxides or polyanionic cathodes reach 3,000 to 6,000 deep discharge cycles at 80 percent depth-of-discharge while maintaining round-trip efficiencies above 91 percent. Lower active material costs, zero-volt transport advantages, and simpler thermal management deliver competitive LCOS numbers for grid storage, where volume is less critical than initial capital expenditure.
| Cost Component / Performance Metric | Sodium-Ion (Layered/Hard Carbon) | Lithium Iron Phosphate (LFP) | NMC-622 Lithium-Ion |
|---|---|---|---|
| Cathode Active Material Cost ($/kg) | 6.50 to 9.00 | 14.00 to 22.00 | 32.00 to 48.00 |
| Anode Active Material Cost ($/kg) | 8.00 to 12.00 | 4.50 to 7.50 | 5.00 to 8.00 |
| Anode Current Collector Material | Aluminum Foil ($0.40/m^2) | Copper Foil ($3.50/m^2) | Copper Foil ($3.50/m^2) |
| Cell Level Manufacturing BOM ($/kWh) | 42.00 to 52.00 | 62.00 to 78.00 | 88.00 to 115.00 |
| Import Tariff & Customs Rate (%) | 3.4 to 7.5 | 3.4 to 25.0 | 3.4 to 25.0 |
| Landed Pack Cost ($/kWh) | 68.00 to 82.00 | 95.00 to 120.00 | 135.00 to 175.00 |
| Cycle Life (Cycles to 80% SOH at 80% DOD) | 4000 | 6000 | 3000 |
| Levelized Cost per Delivered MWh ($) | 28.50 to 36.00 | 24.00 to 31.00 | 55.00 to 72.00 |
Procurement terms in Master Services Agreements (MSAs) should link warranty obligations directly to empirical electrical metrics rather than nominal catalog ratings. Effective agreements define three primary technical thresholds: minimum discharge capacity verified at 0.33C and 25 degrees Celsius; an upper limit restricting R_ct impedance growth to under 50 percent through 1000 cycles; and a lot rejection clause triggered if incoming cell testing shows average initial coulombic efficiency dropping more than 1.5 percentage points below certified baseline specifications.