Automotive Cell Incoming Quality Inspection Procedures for Cell Resistance
Automotive cell incoming resistance inspection relies on strict thermal equilibration, isolated 4-wire Kelvin probing, and clear AC-IR vs DC-IR correlation protocols.
Frequency
High-precision electrochemical characterization separates total internal resistance into distinct transport mechanisms occurring across different time domains. Incoming quality control on automotive battery cells requires unambiguous distinction between high-frequency ohmic response and low-frequency polarization effects. High-frequency measurements capture purely electronic and ionic conduction pathways through current collectors, active materials, and electrolyte liquid phase.
Low-frequency measurements incorporate charge transfer resistance at the electrode interfaces and solid electrolyte interphase layers, alongside solid-state diffusion kinetics.
Cell specifications issued by manufacturers frequently cite a single AC internal resistance figure measured at 1 kHz. This value offers a rapid indicator of cell assembly integrity and tab welding quality. Ohmic losses generate immediate heat.
However, a 1 kHz test completely bypasses the charge transfer and diffusion impedances that dominate under sustained vehicle acceleration or fast-charging profiles. Incoming inspection routines must align the test frequency and pulse duration with the specific stress modes experienced during battery pack operation.

Electrochemical Impedance Breakdown
Frequency-domain analysis maps the complex impedance spectrum across milli-Hertz to kilo-Hertz regimes. The high-frequency real-axis intercept on a Nyquist plot defines the pure ohmic resistance, comprising metallic foils, ultrasonic or laser tab welds, external terminals, and bulk electrolyte solution resistance. Moving down the frequency spectrum into the hundreds of Hertz region reveals the solid electrolyte interphase resistance, which reflects passivating film quality and chemical stability on the anode surface.
Interfacial charge transfer kinetics dictate short-duration current response, whereas concentration gradients govern multi-second voltage drops.
Mid-frequency arcs, typically spanning 1 Hz to 100 Hz, represent the double-layer capacitance coupled with interfacial charge transfer resistance across active material particle boundaries. Below 1 Hz, mass transport limitations dominate, creating the characteristic Warburg diffusion tail. Inspection routines focused on high-voltage power applications demand precise low-frequency direct current pulse evaluation, while continuous high-power discharge monitoring relies on tight high-frequency resistance distributions across incoming cell lots.

Alternating and Direct Current Resistance Discrepancies
Disagreements between incoming test benches and supplier certificate of analysis documents stem primarily from mixing alternating current milliohm meter readings with direct current discharge pulse calculations. A standard 1 kHz AC measurement exposes the cell to a sinusoidal current for one millisecond. The short perturbation period prevents mass transfer polarization from developing, yielding a minimum impedance value that reflects physical contact quality rather than chemical power capability.
Direct current resistance testing applies sustained discharge or charge pulses lasting from 100 milliseconds to 10 seconds. The resulting voltage drop reflects the cumulative sum of ohmic drop, charge transfer polarization, and concentration gradient buildup. A 10-second direct current discharge pulse on an high-energy nickel-manganese-cobalt cell routinely yields a resistance value 1.5 to 2.5 times higher than the 1 kHz alternating current reading on the exact same physical cell.
| Format and Chemistry | Nominal Capacity (Ah) | 1 kHz AC-IR Range (mΩ) | 1 s DC-IR Range (mΩ) | 10 s DC-IR Range (mΩ) |
|---|---|---|---|---|
| Prismatic NMC811 | 120.0 | 0.22 to 0.28 | 0.41 to 0.52 | 0.68 to 0.85 |
| Prismatic LFP | 280.0 | 0.14 to 0.18 | 0.28 to 0.35 | 0.45 to 0.58 |
| Cylindrical 21700 NCA | 5.0 | 11.50 to 13.50 | 18.20 to 22.00 | 26.50 to 31.00 |
| Pouch NMC622 | 65.0 | 0.42 to 0.50 | 0.75 to 0.90 | 1.15 to 1.38 |
Receiving inspection protocols definition mandates explicit recording of test parameters including pulse duration, current magnitude, state of charge, and ambient temperature. Comparing a 1-second pulse measurement against a supplier specification based on a 100-millisecond pulse creates false rejection events. Establishing precise mathematical correlation factors between AC-IR and DC-IR for each specific cell chemistry and tab geometry allows rapid screening using high-throughput AC instruments while maintaining statistical control over true direct current electrochemical performance.


Soak
Incoming inspection lines balance thermal and electrochemical conditions to prevent external environmental factors from corrupting cell resistance measurements. Temperature alters electrolyte viscosity. Ionic mobility inside the porous electrode structure follows an Arrhenius relationship, where small temperature variations induce substantial changes in bulk electrolyte resistance and charge transfer kinetics.
A cell tested at 18 degrees Celsius exhibits noticeably higher internal resistance than the same cell evaluated at 25 degrees Celsius.
State of charge exerts an equally decisive influence on internal resistance readings. Lithium-iron-phosphate chemistries demonstrate relatively flat resistance profiles across middle state-of-charge regions, but display sharp resistance increases below 10 percent and above 90 percent state of charge. High-nickel layered oxide chemistries exhibit continuous resistance variation across their full operating voltage range due to structural phase transitions within the cathode material during lithium intercalation and deintercalation.
Thermal Stabilization Windows
Automotive lithium-ion cells arriving at a receiving dock carry thermal history from transit containers, air freight holds, or climate-controlled trucks. Placing cold or unevenly warmed cells directly onto a test fixture introduces massive measurement drift. Surface temperature sensors fail to capture internal core thermal gradients, as the outer aluminum casing or pouch foil equilibrates with ambient air significantly faster than the dense internal electrode roll.
Thermal equilibrium across the cell core requires significantly more time than surface temperature stabilization indicates.
Data logs confirm thermal stability. Large-format prismatic cells require extended chamber rest periods to equalize internal core temperatures with external inspection ambient environments. Thermal imaging checks verify surface uniformity across incoming pallets before individual cell handling begins.
Inspection procedures mandate placing packed trays into temperature-controlled stabilization rooms maintained strictly at 25.0 degrees Celsius plus or minus 0.5 degrees Celsius prior to contact testing.

State of Charge Equalization Protocols
Shipping regulations under United Nations dangerous goods rules enforce a maximum state of charge threshold of 30 percent for bulk cell air transport. Suppliers typically ship cells within a broad state-of-charge band ranging between 27 percent and 33 percent. Receiving inspection protocols must account for this variability or execute controlled state-of-charge adjustment cycles before recording baseline resistance figures.
- Unpack incoming cell pallets into designated ESD-safe climate stabilization chambers set to 25.0 degrees Celsius.
- Hold large-format prismatic cells for a minimum of 12 hours to eliminate internal thermal gradients between the core and terminal posts.
- Verify ambient room temperature using calibrated thermistors positioned at fixture level.
- Measure open-circuit voltage across cell terminals using a calibrated 6.5-digit digital multimeter to confirm state-of-charge consistency across the lot.
- Apply temperature correction math if cell surface temperatures deviate from the 25.0 degree reference point by more than 0.2 degrees.
- Execute automated 4-wire resistance measurement using gold-plated Kelvin contacts applying specified spring compression force.
Executing incoming inspection without strict state-of-charge control compromises statistical process capability calculations. Small state-of-charge variations within an incoming batch expand the apparent resistance distribution, disguising genuine manufacturing defects such as sub-standard tab welds or electrolyte filling variations. Testing must occur at the contractually specified shipping state of charge or undergo active conditioning on automated cycler channels.
Thermal stabilization controls remove environment-induced variance from the quality audit ledger.
As a practical rule of thumb for receiving dock operations, cell core thermal stabilization time scales with the square of the shortest external dimensions of the cell casing.

Probe
Four-point sensing configurations eliminate fixture wire resistance from the measurement loop by separating current supply paths from sense leads. Generating repeatable micro-ohm level resistance readings on high-capacity automotive cells requires extreme precision at the physical interface between test probes and cell terminals. Terminal surface oxidation, dust, protective shipping tape residue, and mechanical misalignment introduce parasitic contact resistances that obscure small differences in internal cell performance.
Automated high-throughput incoming inspection rigs utilize spring-loaded pogo pins or pneumatic contact blades. Contact force must penetrate surface oxide layers without dimpling, scratching, or deforming the soft aluminum positive or copper negative terminal faces. Terminal damage impairs downstream ultrasonic or laser busbar welding processes during module assembly.
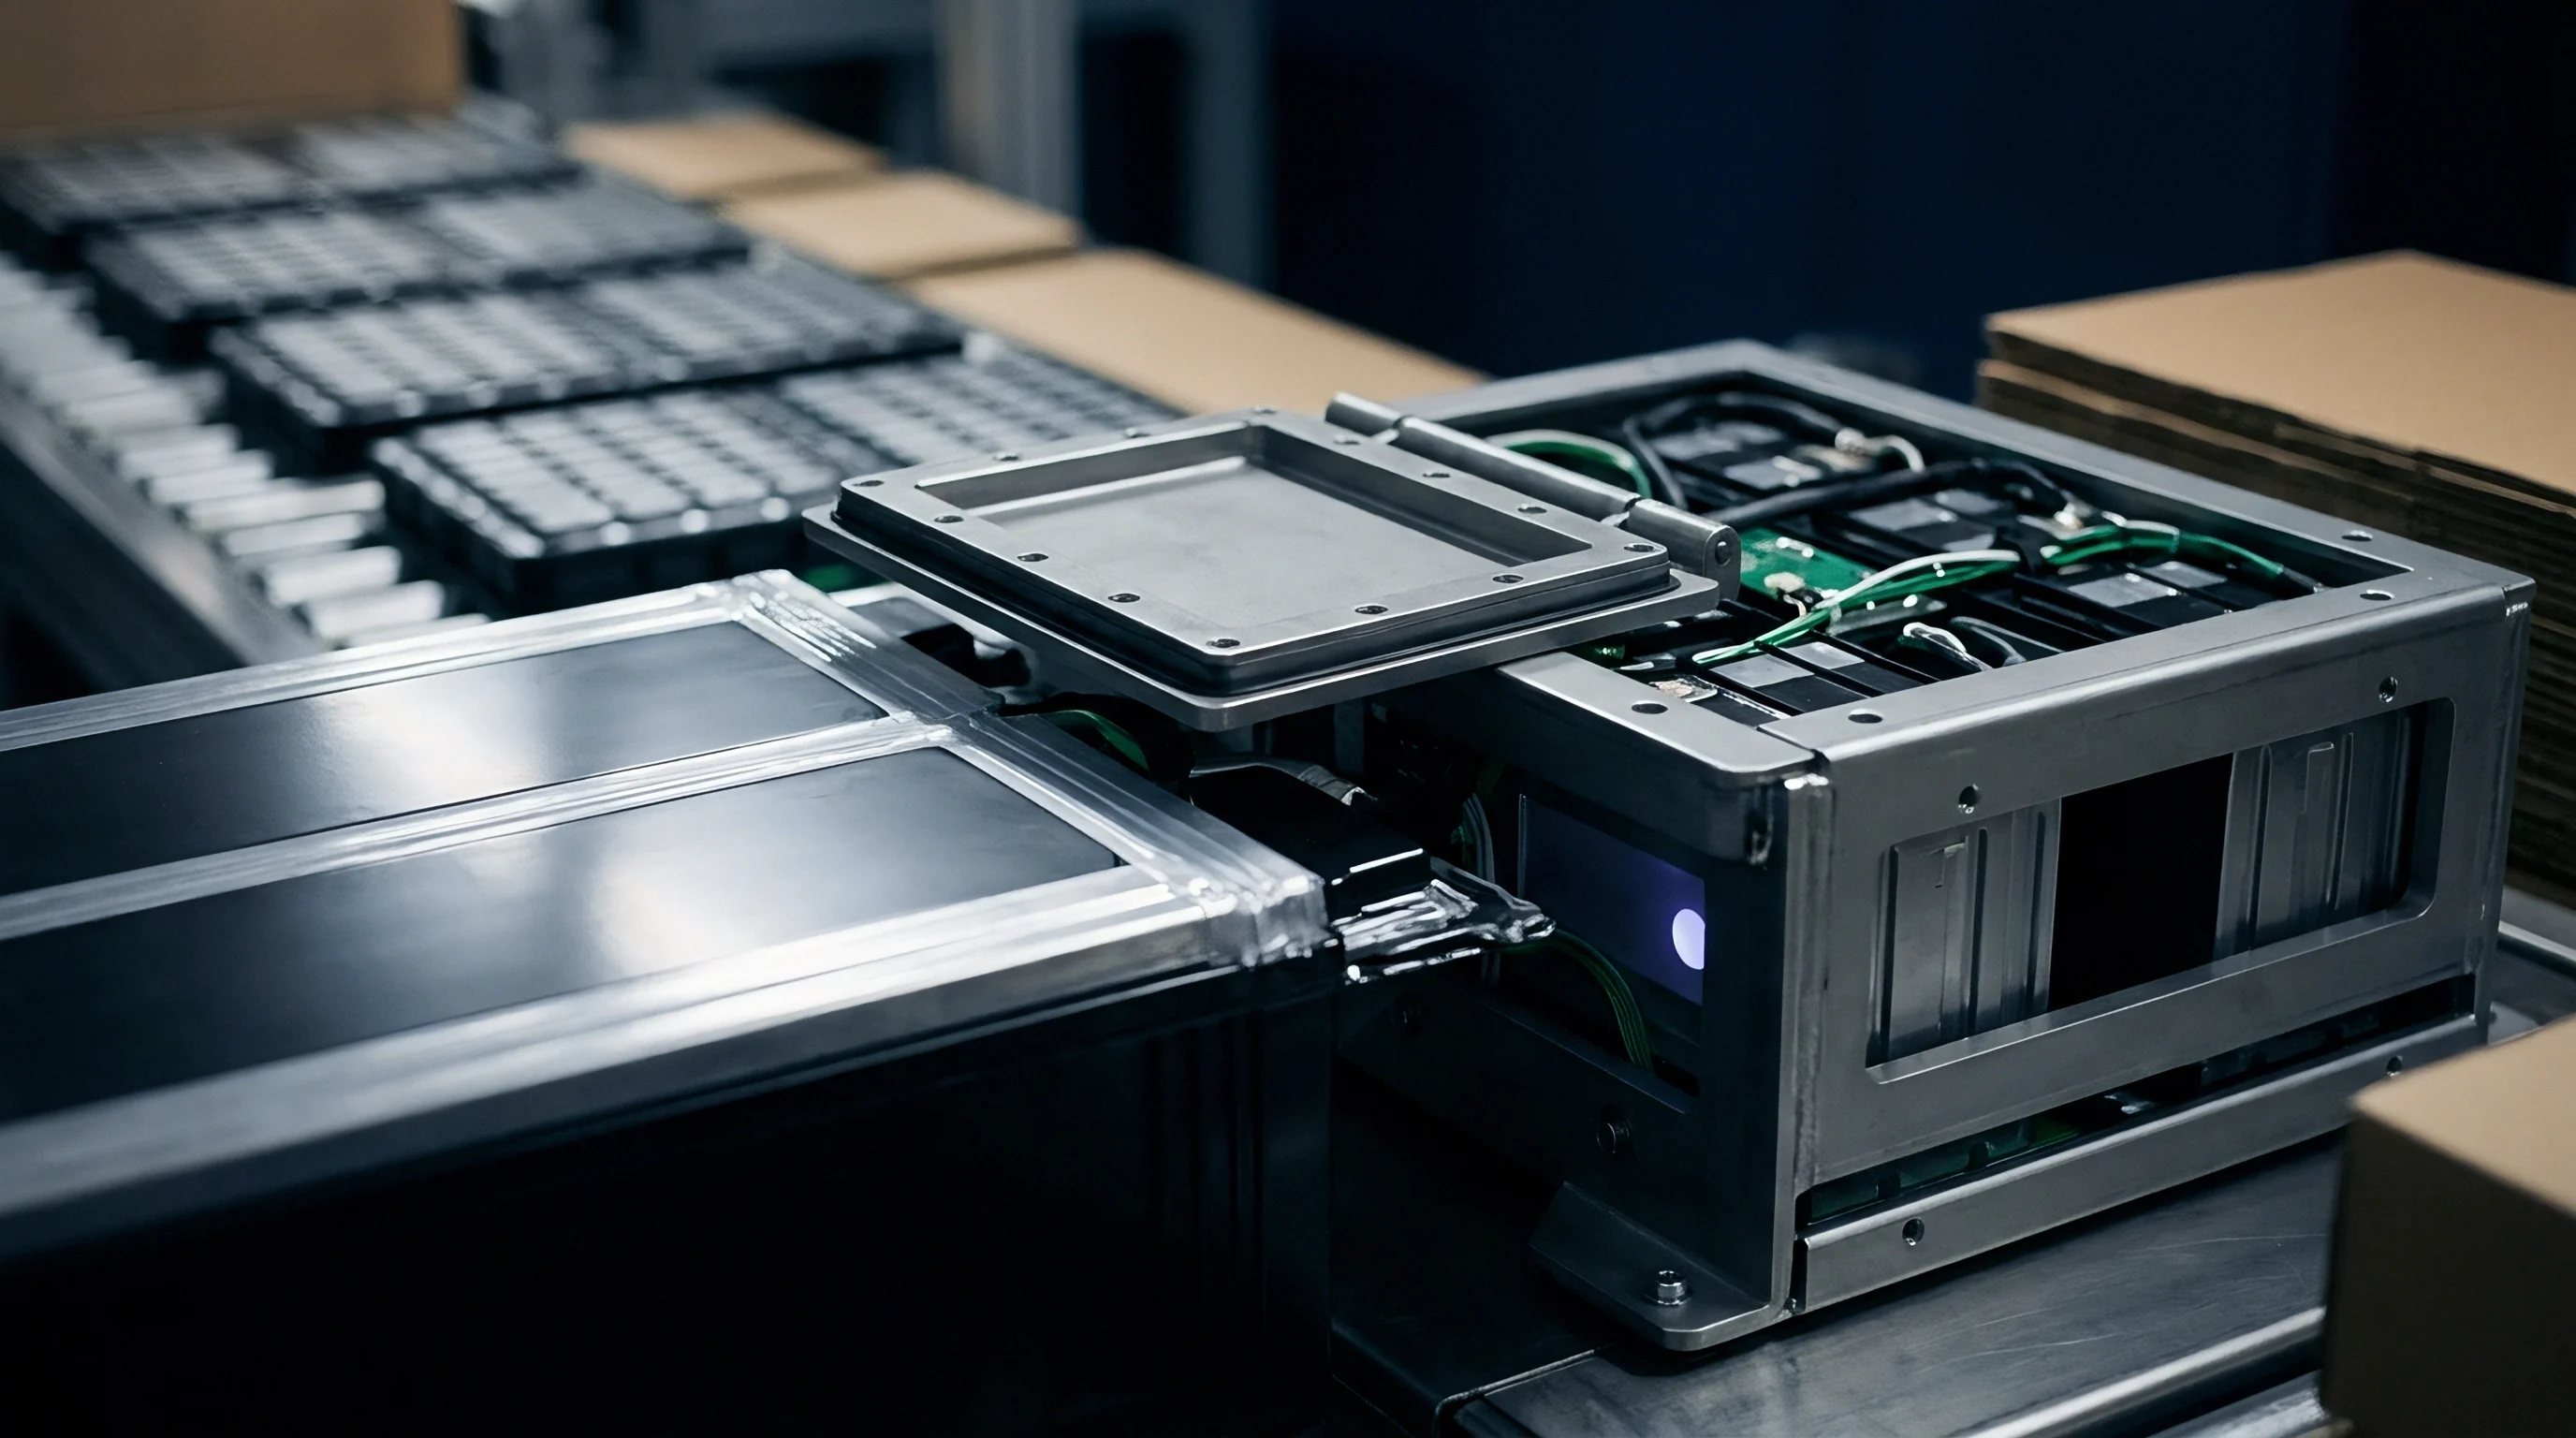
Why Do Four Wire Kelvin Measurements Suffer Contact Errors?
Parasitic current paths develop when current leads and voltage sensing leads short-circuit at the contact pin head rather than on the cell terminal surface itself. Clean interfaces reduce voltage noise. If the current-carrying pin creates a localized voltage drop across the terminal surface material, sense pins located inside that voltage gradient pick up parasitic resistive signals.
Plating wear increases resistance variance. Oxidation on nickel or gold contacts degrades signal-to-noise ratios during high-frequency AC measurements. Fixture design must ensure complete galvanic isolation between current excitation circuits and high-impedance voltage sense channels up to the exact point of mechanical interface with the cell terminal plane.
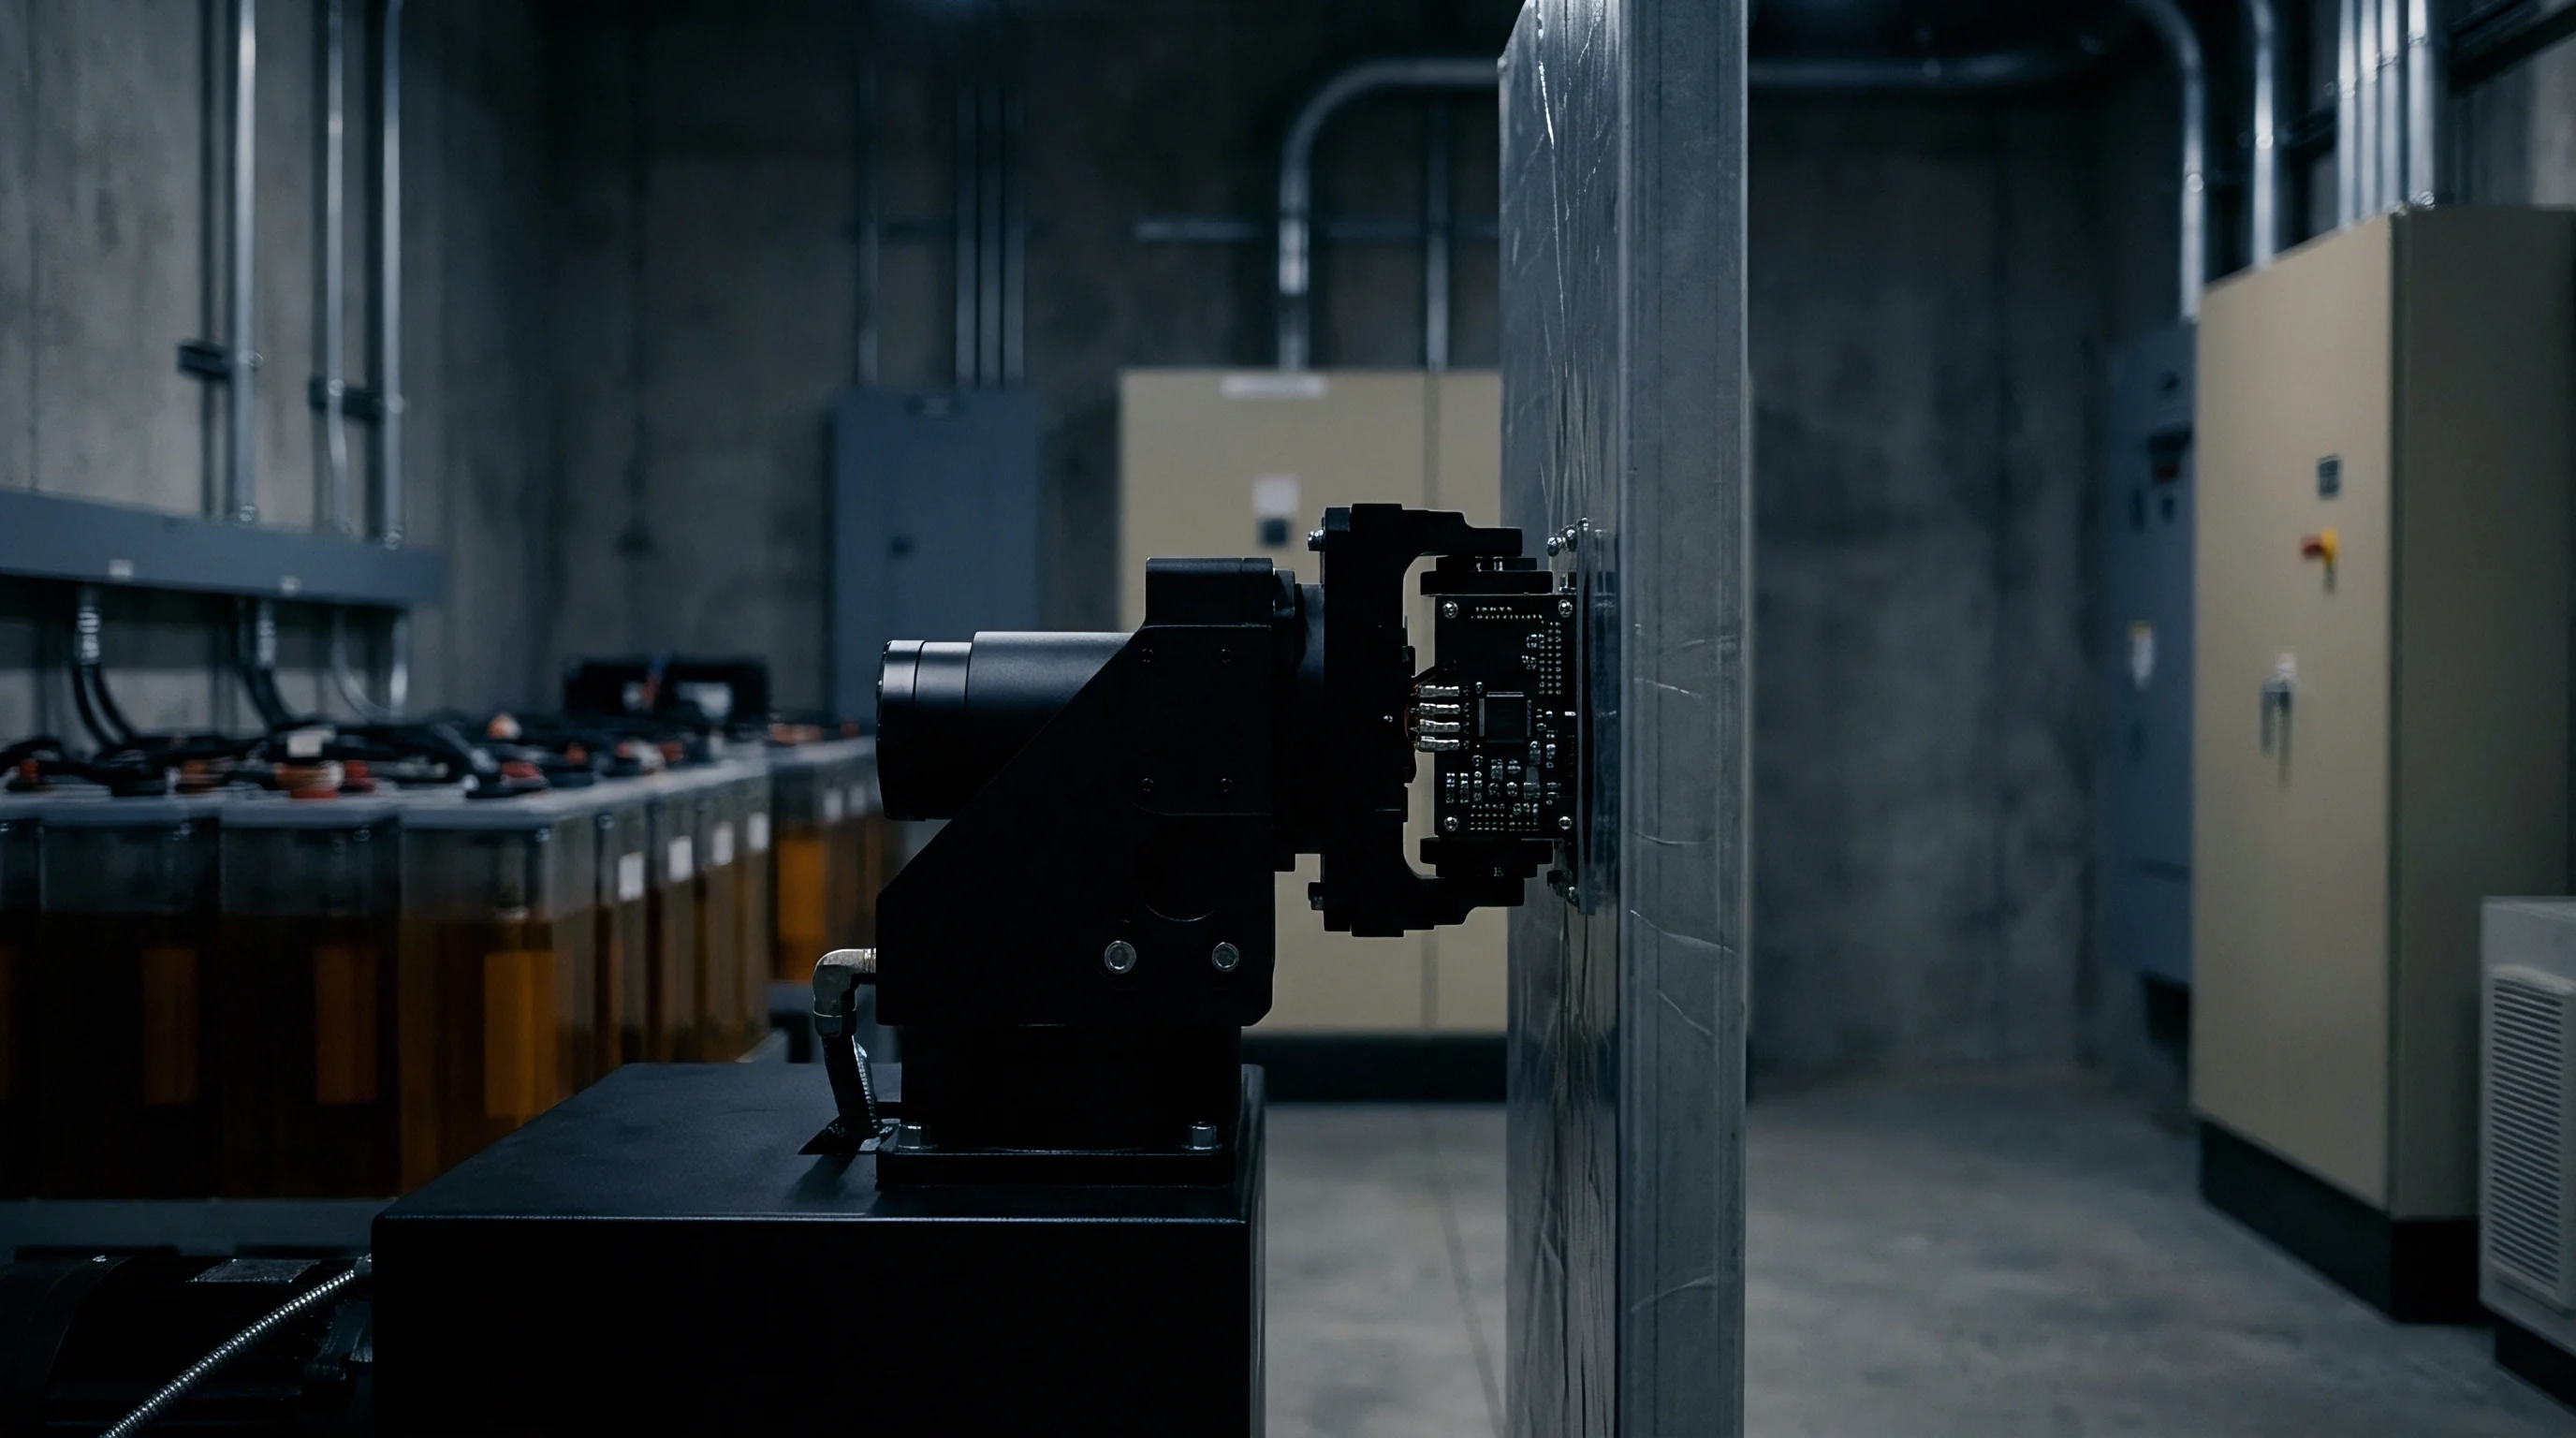
Fixture Design and Pin Pressure Tolerances
Automotive cell testing fixtures demand robust mechanical alignment tolerances. Contact pins must engage terminal surfaces with orthogonal precision to prevent lateral scrubbing forces that remove terminal plating materials. Pneumatic actuation systems provide controlled, repeatable contact forces across millions of inspection cycles.
Contact pressure below two megapascals introduces micro-ohm level interface fluctuations during rapid automated indexing.
Consider a test bench evaluating a 200 Ah prismatic cell with a specification baseline AC resistance of 0.180 mΩ (180 µΩ) and an upper control limit of 0.200 mΩ (200 µΩ). Poor fixture contact adds a parasitic contact resistance error of 0.025 mΩ (25 µΩ) due to pin oxidation and inadequate contact force. Assume an incoming cell batch possesses a true physical mean resistance of 0.185 mΩ with a standard deviation of 0.003 mΩ.
Without fixture correction, the measured mean shifts to 0.210 mΩ, causing the automated inspection station to reject 100 percent of a perfectly conforming cell lot. Inspecting cell contact surfaces with automated optical cameras prior to contact engagement prevents false failures driven by interface contamination.
Inadequate pin force or worn probe tips lead directly to erroneous lot rejections, expensive secondary manual re-testing, and improper vendor debit actions that fail under joint audit verification.


Batch
Statistical quality control establishes receiving inspection sample sizes based on lot size, acceptable quality limit, and lot tolerance percent defective. Automotive cell incoming quality procedures cannot economically perform 100 percent direct current pulse testing on high-volume cell deliveries due to line takt times and equipment costs. Automated 1 kHz AC-IR screening runs on 100 percent of incoming units, while comprehensive DC-IR and electrochemical impedance spectroscopy protocols execute on a statistically representative sample size.
Sample selection must follow random sampling rules across multiple pallets and crate locations within a shipment. Selecting cells exclusively from the top layer of the first pallet introduces sampling bias that masks transit damage or thermal gradients present in inner packaging layers. Acceptance sampling protocols define strict rules for transitioning between normal, tightened, and reduced inspection levels based on historical vendor quality performance.

Acceptance Sampling Mechanics
Statistical sampling plans defined under ISO 2859-1 and ANSI/ASQ Z1.4 govern incoming inspection lot decision frameworks. Sampling plans establish the precise sample count required for a given batch size alongside the maximum allowable count of non-conforming units. A single non-conforming cell in a critical resistance parameter can trigger complete lot rejection and quarantine procedures.
Process capability indices quantify vendor manufacturing control. Calculating Cpk requires comparing the statistical distribution of measured cell resistance against upper and lower specification limits. A minimum Cpk threshold of 1.33 represents standard industry acceptance, while critical automotive safety programs demand Cpk values equal to or exceeding 1.67.
| Lot Size Range (Units) | Sample Size Code Letter | Sample Size (Units) | Acceptance Number (AQL 0.25) | Rejection Number (AQL 0.25) |
|---|---|---|---|---|
| 501 to 1,200 | J | 80 | 0 | 1 |
| 1,201 to 3,200 | K | 125 | 0 | 1 |
| 3,201 to 10,000 | L | 200 | 1 | 2 |
| 10,001 to 35,000 | M | 315 | 1 | 2 |
| 35,001 to 500,000 | N | 500 | 2 | 3 |

Statistical Thresholds and Lot Rejection Limits
Quality engineers calculate population statistics immediately upon completing batch testing. Resistance data must exhibit a normal distribution curve. Bimodal or skewed distributions signal mixed production lots, variable electrolyte filling quantities, or inconsistent tab welding runs within a single vendor shipment batch.
Compliance with ISO 2859-1 normal single sampling plans defines the baseline statistical threshold for incoming lot acceptance.
- Mean Resistance Shift exceeding three standard deviations from historical baseline triggers immediate quarantine regardless of absolute specification limit margins.
- Standard Deviation Expansion greater than 15 percent above supplier certificate of analysis values indicates unstable sub-tier manufacturing processes.
- Outlier Identification via Grubbs test isolates single cells exhibiting localized weld defects or internal structural anomalies.
- Process Capability Failure where calculated Cpk drops below 1.33 initiates mandatory 100 percent screening at the cell manufacturer expense.
Executing quality audits strictly according to ANSI/ASQ Z1.4 normal single sampling plans with an Acceptable Quality Limit of 0.25 converts incoming resistance data into legally binding lot acceptance or rejection documentation.


Shift
Internal cell resistance changes during transit due to solid electrolyte interphase growth, mechanical vibration relaxation, and temperature exposure histories. The solid electrolyte interphase layer on graphite anodes thickens continuously over time, drawing active lithium from the system and increasing ionic transport impedance. Ocean freight transport lasting four to six weeks introduces measurable resistance growth compared to baseline factory end-of-line test certificates.
Mechanical shock and continuous low-frequency vibration during road or rail freight induce physical relaxation across the jelly-roll or stack structure. Micro-movements at internal tab contact points or subtle shifts in electrolyte distribution alter local current density distributions, manifesting as small modifications in measured internal resistance upon initial receipt at the battery pack manufacturing facility.

Transit Relaxation Dynamics
Freshly manufactured cells undergo complex electrochemical relaxation processes during the first two to four weeks post-formation. Solid electrolyte interphase layers re-passivate as residual electrolyte species react with active materials. This stabilization phase causes internal resistance to fluctuate before reaching a stable plateau.
Storage temperature accelerates internal growth. Transporting cells through tropical shipping routes where freight container internal temperatures reach 45 degrees Celsius doubles or triples SEI growth rates. Incoming quality procedures must compare dock measurements against transit-aware baseline models rather than pristine factory end-of-line data.
Temperature Coefficient Correction Factors
Measuring incoming cells at dock ambient temperatures requires mathematical normalization back to the standard reference temperature of 25.0 degrees Celsius. Applying temperature correction formulas prevents false non-conformance reports caused by seasonal ambient temperature variations within receiving facilities.
Elevated transit temperatures convert salt complexes into resistive interface films that persist after cooling.
- Arrhenius Temperature Compensation adjusts measured DC resistance using chemistry-specific activation energy coefficients derived from laboratory calibration.
- Linear Thermal Coefficients provide rapid AC-IR correction across narrow temperature windows between 20 and 30 degrees Celsius.
- State of Charge Shift Correction compensates for minor self-discharge losses that occur during long-distance transit voyages.
- Viscosity Normalization Models account for electrolyte conductivity changes across wide receiving dock temperature ranges.
When dock readings diverge from factory certificates of analysis, supplier technical representatives often assert that elevated readings merely reflect temporary electrode polarization caused by transport vibration, promising that values will re-stabilize after several days of stationary warehouse rest.

Dispute
Commercial resolution of non-conforming resistance data relies on pre-agreed reference test methods, joint audits, and retained quarantine samples. Rejection of a multi-container cell delivery represents significant financial value and disrupts pack assembly master schedules. Legally binding supply contracts establish explicit rules for reporting defects, quarantine procedures, third-party laboratory arbitration, and financial debit notes.
Unstable readings delay line clearance. Defective cell resistance profiles identified during incoming inspection require immediate formal notification to the cell manufacturer within contractually specified timeframes, typically five to ten business days from dock arrival. Retaining original packaging and maintaining strict temperature-controlled storage during quarantine prevents cell degradation while commercial negotiations occur.

Commercial Rejection Protocol Mechanics
Formal rejection dossiers must contain comprehensive documentation including calibrated equipment asset numbers, ambient environmental logs, raw test data files, statistical Cpk calculations, and optical contact terminal inspection records. Suppliers retain the contractual right to send technical field engineers to perform joint verification testing using the buyer test fixtures and reference instruments.
Disagreements over test methodology are resolved by referring to the master technical specification agreement appended to the commercial purchase contract. The contract designates a certified independent testing laboratory to perform arbitration measurements if joint audits fail to produce consensus. Findings from the designated arbitration laboratory bind both parties commercially.
| Non-Conformance Root Cause | Primary Evidence Document | Financial Liability Owner | Contractual Remedy Mechanism |
|---|---|---|---|
| Out of Spec AC-IR Mean | Incoming Inspection Cpk Report | Cell Manufacturer | Full lot credit note or replacement |
| Transit High Temp Exposure | Container Temperature Logger | Logistics Carrier / Insurer | Freight insurance claim submission |
| Terminal Surface Oxidation | Automated Optical Inspection File | Cell Manufacturer | Rework allowance or vendor re-cleaning |
| Incorrect Test State of Charge | Open Circuit Voltage Log | Buyer Operations | Internal re-test at buyer cost |

Allocation of Liability for off Spec Lots
Contracts specify clear financial remedies when incoming lots fail resistance standards. Remedies extend beyond replacing defective cells to encompass freight expenses, custom clearance duties, quarantine storage fees, and line-stoppage indemnification charges. Tight tolerances prevent module imbalance.
Reject lots return to vendor. Clear title transfer terms defined under Incoterms rules establish exactly when risk of cell quality degradation passes from supplier to buyer. Delivered Duty Paid terms keep quality risk with the seller until physical delivery, whereas Free On Board terms shift transport degradation risk to the buyer once the vessel departs the export port.
What fundamental electrochemical boundary defines whether a transit-induced resistance shift represents reversible thermodynamic relaxation or permanent irreversible solid electrolyte interphase degradation?