Baseline Compression Fixture Calibration for Sulfide Solid State Battery Cells
Baseline compression calibration for sulfide solid-state cells demands platen deflection under 2 µm/100mm and temperature-compensated force sensing.
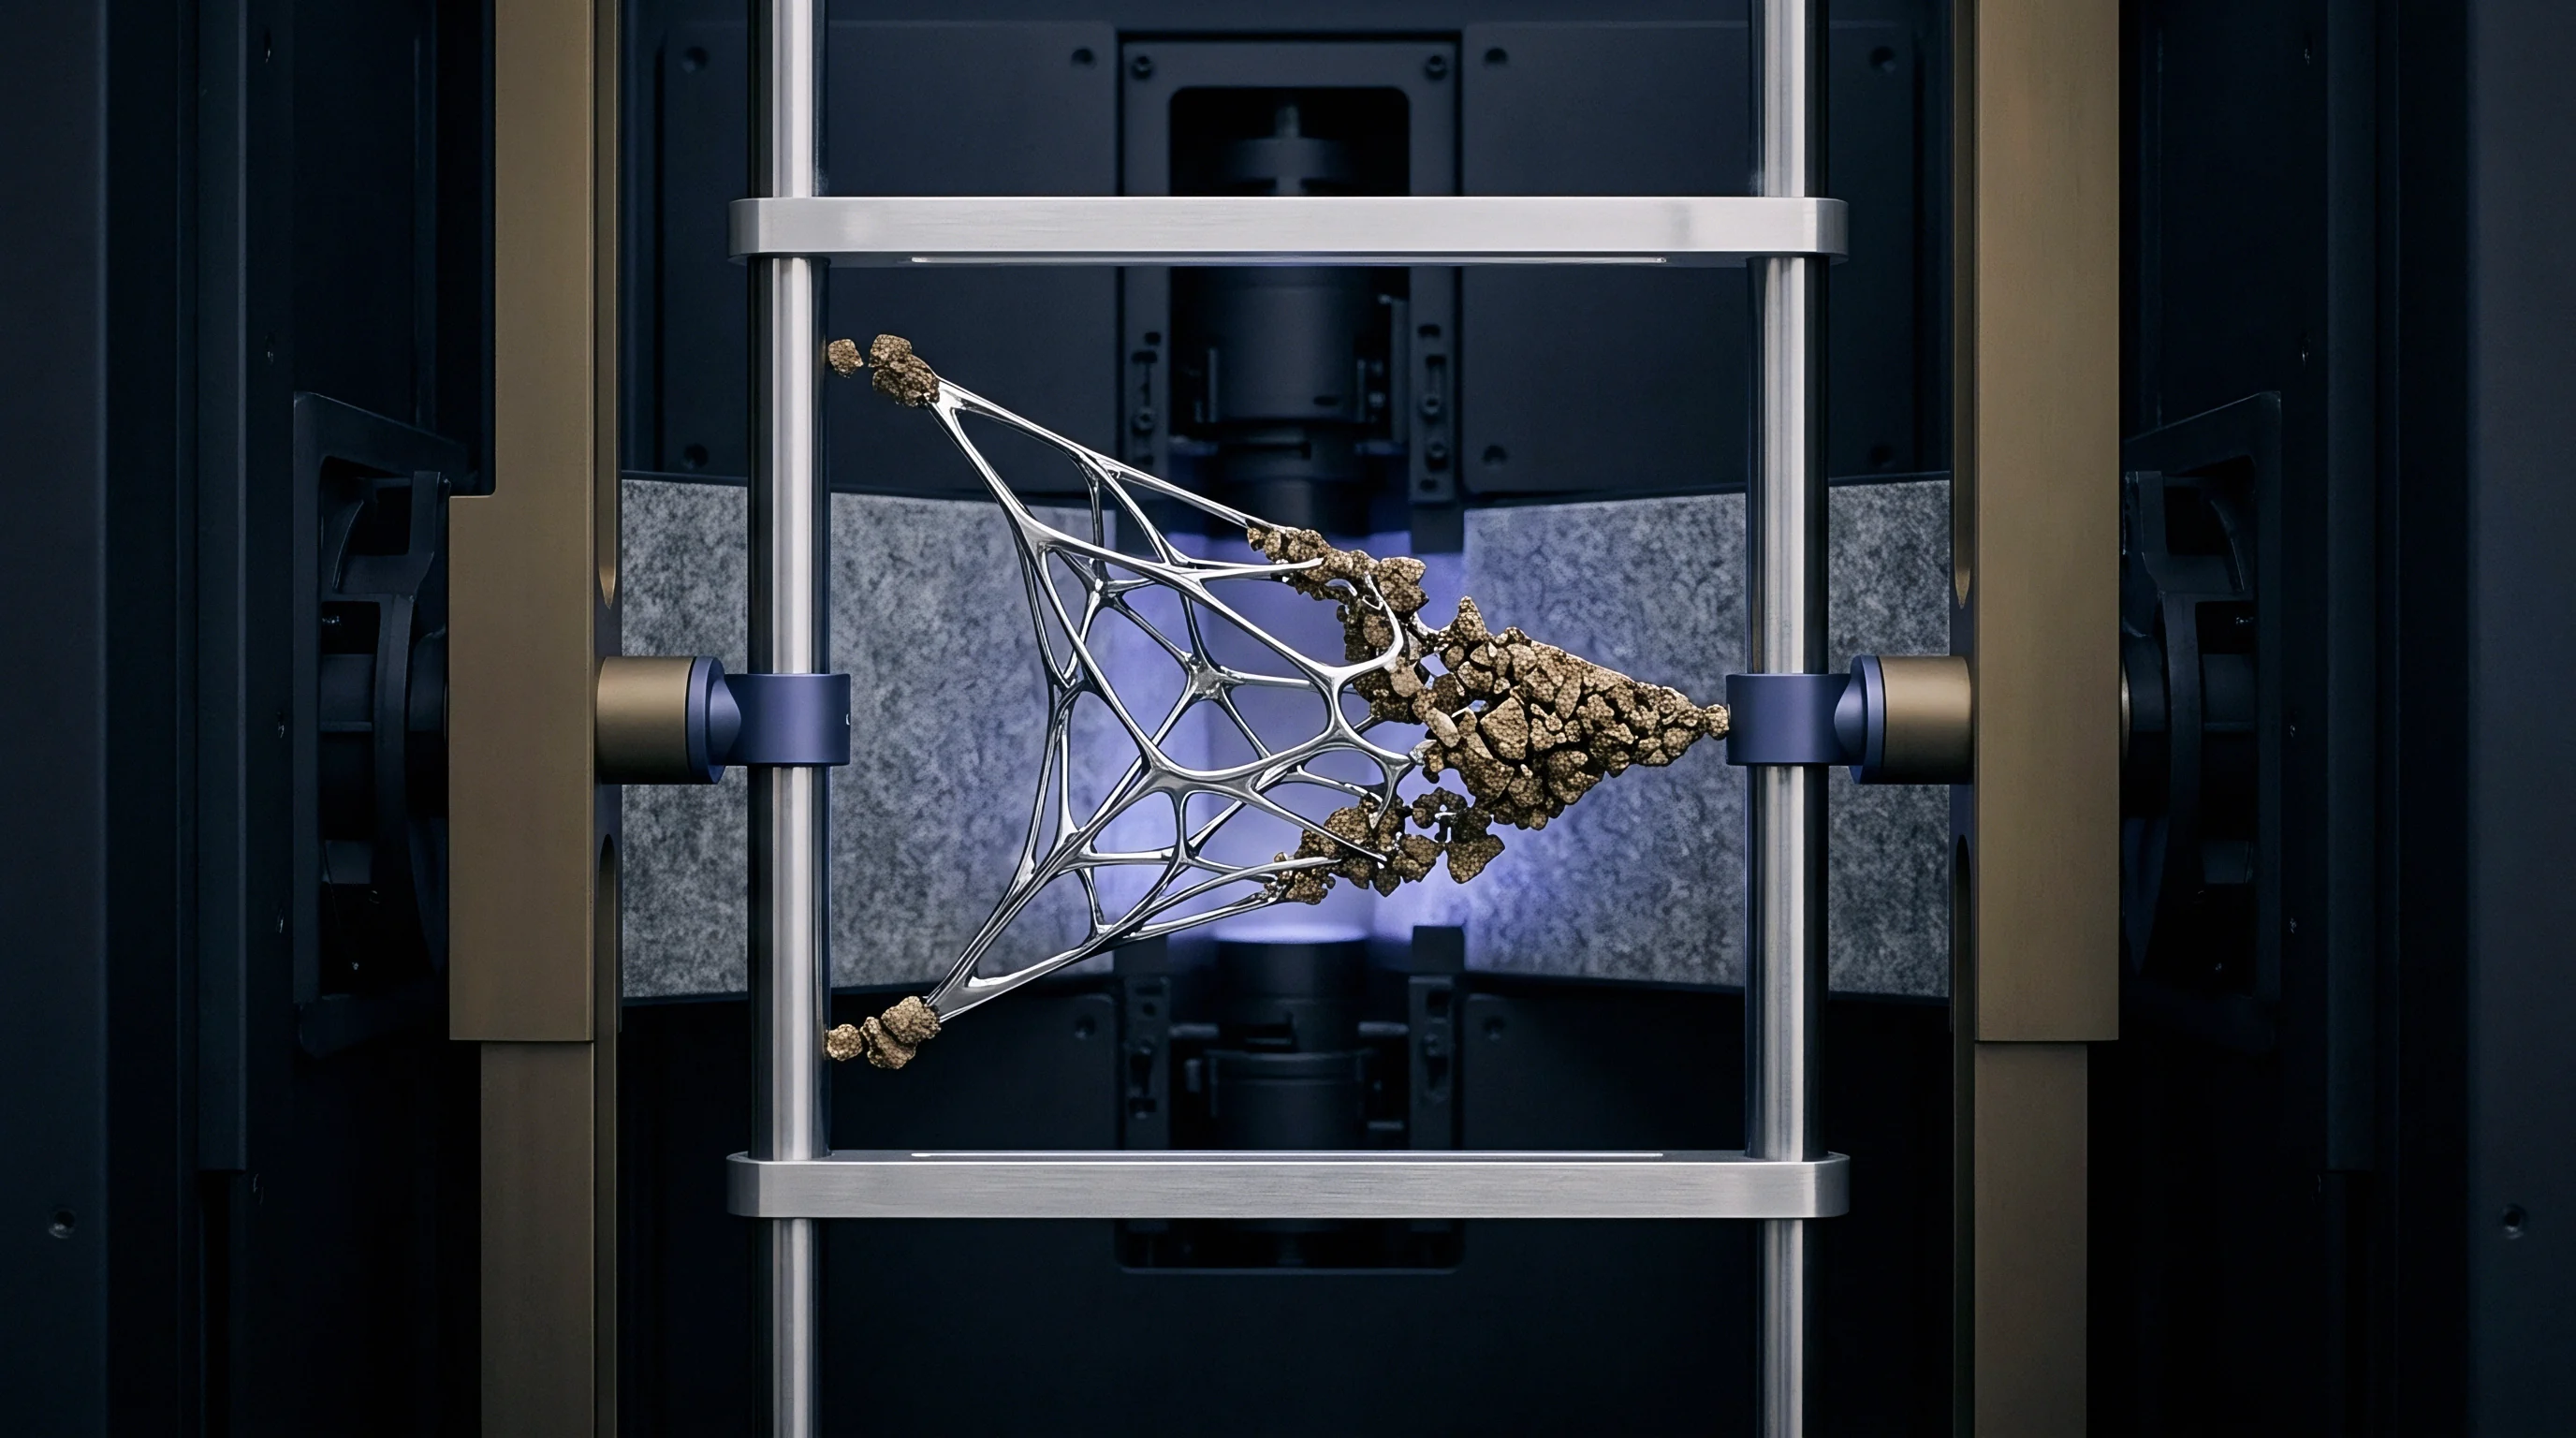
Platen
Rigid compression surfaces maintain constant mechanical pressure across sulfide solid-state cell interfaces during electrochemical cycling. Sulfide-based solid electrolytes, including lithium argyrodite (Li6PS5Cl) and lithium thiophosphate (Li3PS4), require sustained external stack pressure ranging from 1.0 MPa to 15.0 MPa to preserve interparticle contact and suppress interfacial void formation during lithium plating and stripping. Without uniform mechanical confinement, microscopic volume shifts during cycling degrade ionic conduction pathways, leading to rapid capacity fade and localized dendritic short-circuiting.
The design of load distribution plates dictates whether applied forces translate into uniform normal stress or destructive force gradients across the cell area.
Flatness and parallelism tolerances across contact interfaces directly influence electrochemical stability. Surface imperfections or angular misalignment create localized pressure spikes that breach thin sulfide separator layers, which often measure under 30 micrometers in thickness. Parallel surfaces prevent localized shearing.

Mechanical Stiffness Requirements and Deflection Tolerances
Achieving dynamic force equilibrium across argyrodite or thiophosphate electrolyte layers demands rigid load distribution plates with deflection limits under 2 micrometers per hundred millimeters at target loads of 15 megapascals. Solid electrolytes deform under load. Standard structural aluminum alloys prove insufficient under continuous elevated pressures, bending under load and concentrating stress along cell edges while starving the geometric center of required pressure.
Tool steel or hardened stainless steel plates with a minimum elastic modulus of 200 gigapascals prevent center bending.
Deflection modeling relies on beam bending formulas where platen thickness scales cubically with allowable strain. For a rectangular pouch cell format measuring 100 mm by 70 mm subjected to a 10 MPa baseline pressure, total compressive force equals 70 kilonewtons. Under this load, a 15 mm thick steel plate experiences structural bowing that shifts effective central contact pressure downward by up to 35 percent.
Increasing plate thickness to 25 mm reduces mechanical flexure below 1.2 micrometers, maintaining contact pressure uniformity within a 3 percent window across the active electrode surface.

Surface Topology and Parallelism Standard
Direct contact interfaces require a surface roughness Ra below 0.4 micrometers to prevent localized pressure points that puncture ultra-thin solid separator layers. Precision surface grinding followed by lapping eliminates machining ridges and burrs. Parallelism between opposing top and bottom compression surfaces must remain within 0.01 mm per 100 mm of span to prevent shear stresses across the electrolyte-electrode boundary during assembly clamping.
Platen stiffness governs pressure field uniformity across solid electrolyte separators more effectively than increasing total applied spring force.
When external clamping fixtures compress asymmetrical pouch cells, non-parallel load plates induce lateral force vectors. These lateral forces cause micro-fissures in cold-pressed sulfide powder beds, creating low-resistance pathways for metallic lithium growth. Incorporating self-aligning spherical seated washers or gimbaled load joints above the upper plate eliminates bending moments caused by minor thread machining inaccuracies in the load frame.
Failure to hold planar alignment across test surfaces generates localized stack pressure gradients exceeding 30 megapascals, driving dendritic growth through the sulfide matrix and inducing premature short circuits before cycle fifty.
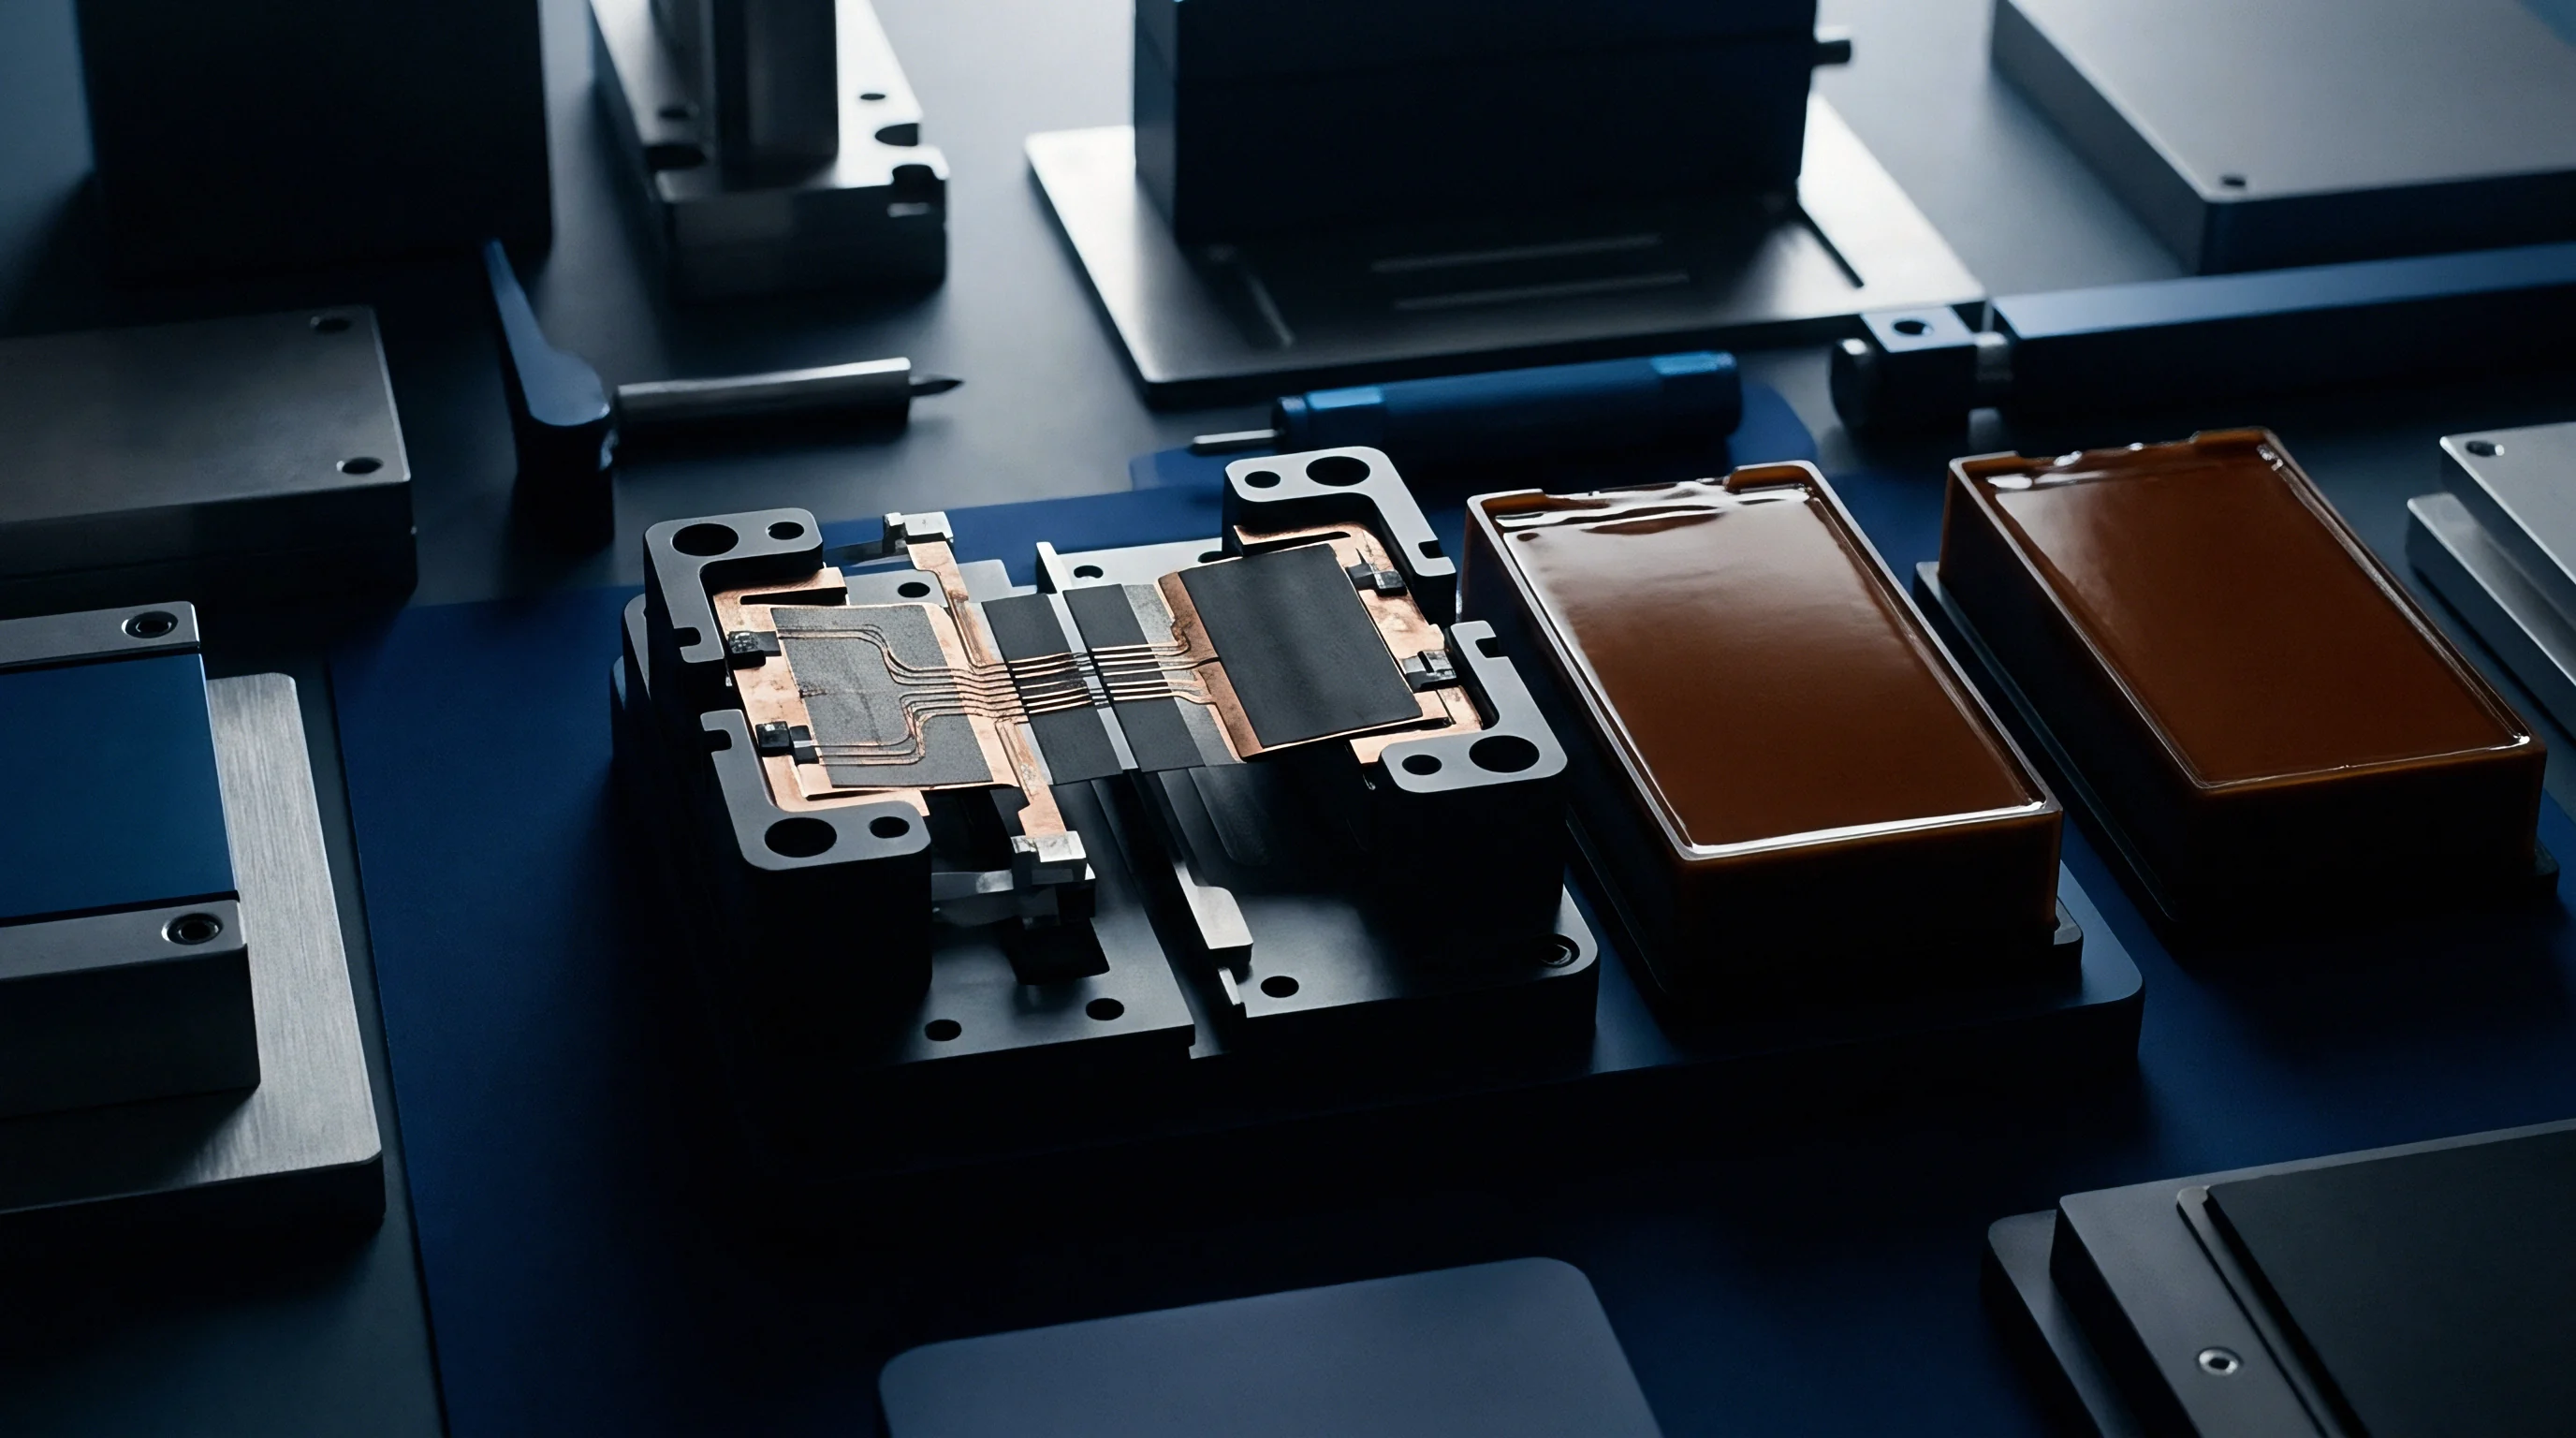

Rheology
Sulfide-based solid electrolyte separator membranes, such as lithium argyrodite Li6PS5Cl, exhibit time-dependent viscoelastic plastic flow under sustained mechanical preloads. When subjected to baseline stack pressure, cold-pressed sulfide particles undergo yield deformation and grain boundary sliding. This material creep alters internal porosity over time, densifying the separator layer while simultaneously relaxing the mechanical strain exerted by external clamping springs.
Understanding this rheological response proves essential for calibrating compression fixtures, as initial load settings decay significantly during the first tens of hours after fixture assembly.
Creep rate scales exponentially with operating temperature and applied stress. At ambient room temperature (25°C), an argyrodite pellet under 10 MPa baseline pressure experiences an initial rapid elastic compression followed by logarithmic plastic deformation extending past 72 hours. At elevated testing temperatures of 60°C to 80°C, the rate of plastic deformation accelerates, causing rapid drop-offs in measured clamping force if the external compression fixture lacks active displacement compensation.
Time Dependent Creep and Stress Relaxation
Continuous stack pressures between 5 and 10 megapascals cause structural rearrangement within cold-pressed solid electrolyte particles over extended testing cycles. Stress relaxation follows a two-stage decay curve. Stage one represents primary creep, characterized by rapid displacement within the first 6 hours as particle voids collapse.
Stage two represents secondary creep, marked by a linear, slow decay in clamping stress driven by atomic diffusion and grain boundary rearrangement.
Creep lowers active contact stress. As the solid electrolyte separator compresses and thins under load, the fixed distance between rigid compression platens increases slightly relative to the compressed stack height. In passive spring-loaded fixtures, this stack height reduction reduces spring extension, directly lowering applied clamping force according to Hooke’s Law.
Contact resistance increases as pressure decays.
| Electrolyte Composition | Young’s Modulus (GPa) | Yield Stress (MPa) | 72h Pressure Loss at 25°C (%) | 72h Pressure Loss at 60°C (%) |
|---|---|---|---|---|
| Li6PS5Cl (Argyrodite) | 18.5 ± 1.2 | 22.0 ± 2.0 | 12.4 | 28.6 |
| Li3PS4 (Glass-Ceramic) | 21.0 ± 1.5 | 28.5 ± 2.5 | 8.1 | 19.3 |
| Li10GeP2S12 (LGPS) | 24.2 ± 1.8 | 34.0 ± 3.0 | 6.5 | 15.2 |
| 70Li2S-30P2S5 (Glass) | 15.8 ± 1.0 | 18.0 ± 1.5 | 16.8 | 34.1 |

Sequential Procedure for Fixture Preload Equalization
Establishing stable compressive force requires controlled load application steps to mitigate initial material settlement before recording baseline capacity. The calibration workflow balances viscoelastic relaxation against initial spring setup.
- Apply baseline compression load of 1.0 MPa at 0.1 MPa per second increments using a calibrated axial load frame.
- Hold nominal stress for 120 minutes at 25°C to allow primary viscoelastic relaxation of the solid electrolyte layer.
- Torque fixture retention bolts in a cross-star pattern to specified baseline force using a calibrated digital torque wrench.
- Soak assembled test fixture inside the environmental chamber at target operating temperature for 180 minutes.
- Re-measure axial force using inline load cell and adjust thread tension to restore baseline target pressure.
Equipment manufacturers frequently state that spring washer stacks compensate for material creep automatically, omitting the reality that spring hysteresis alters absolute contact pressure across thermal sweeps.
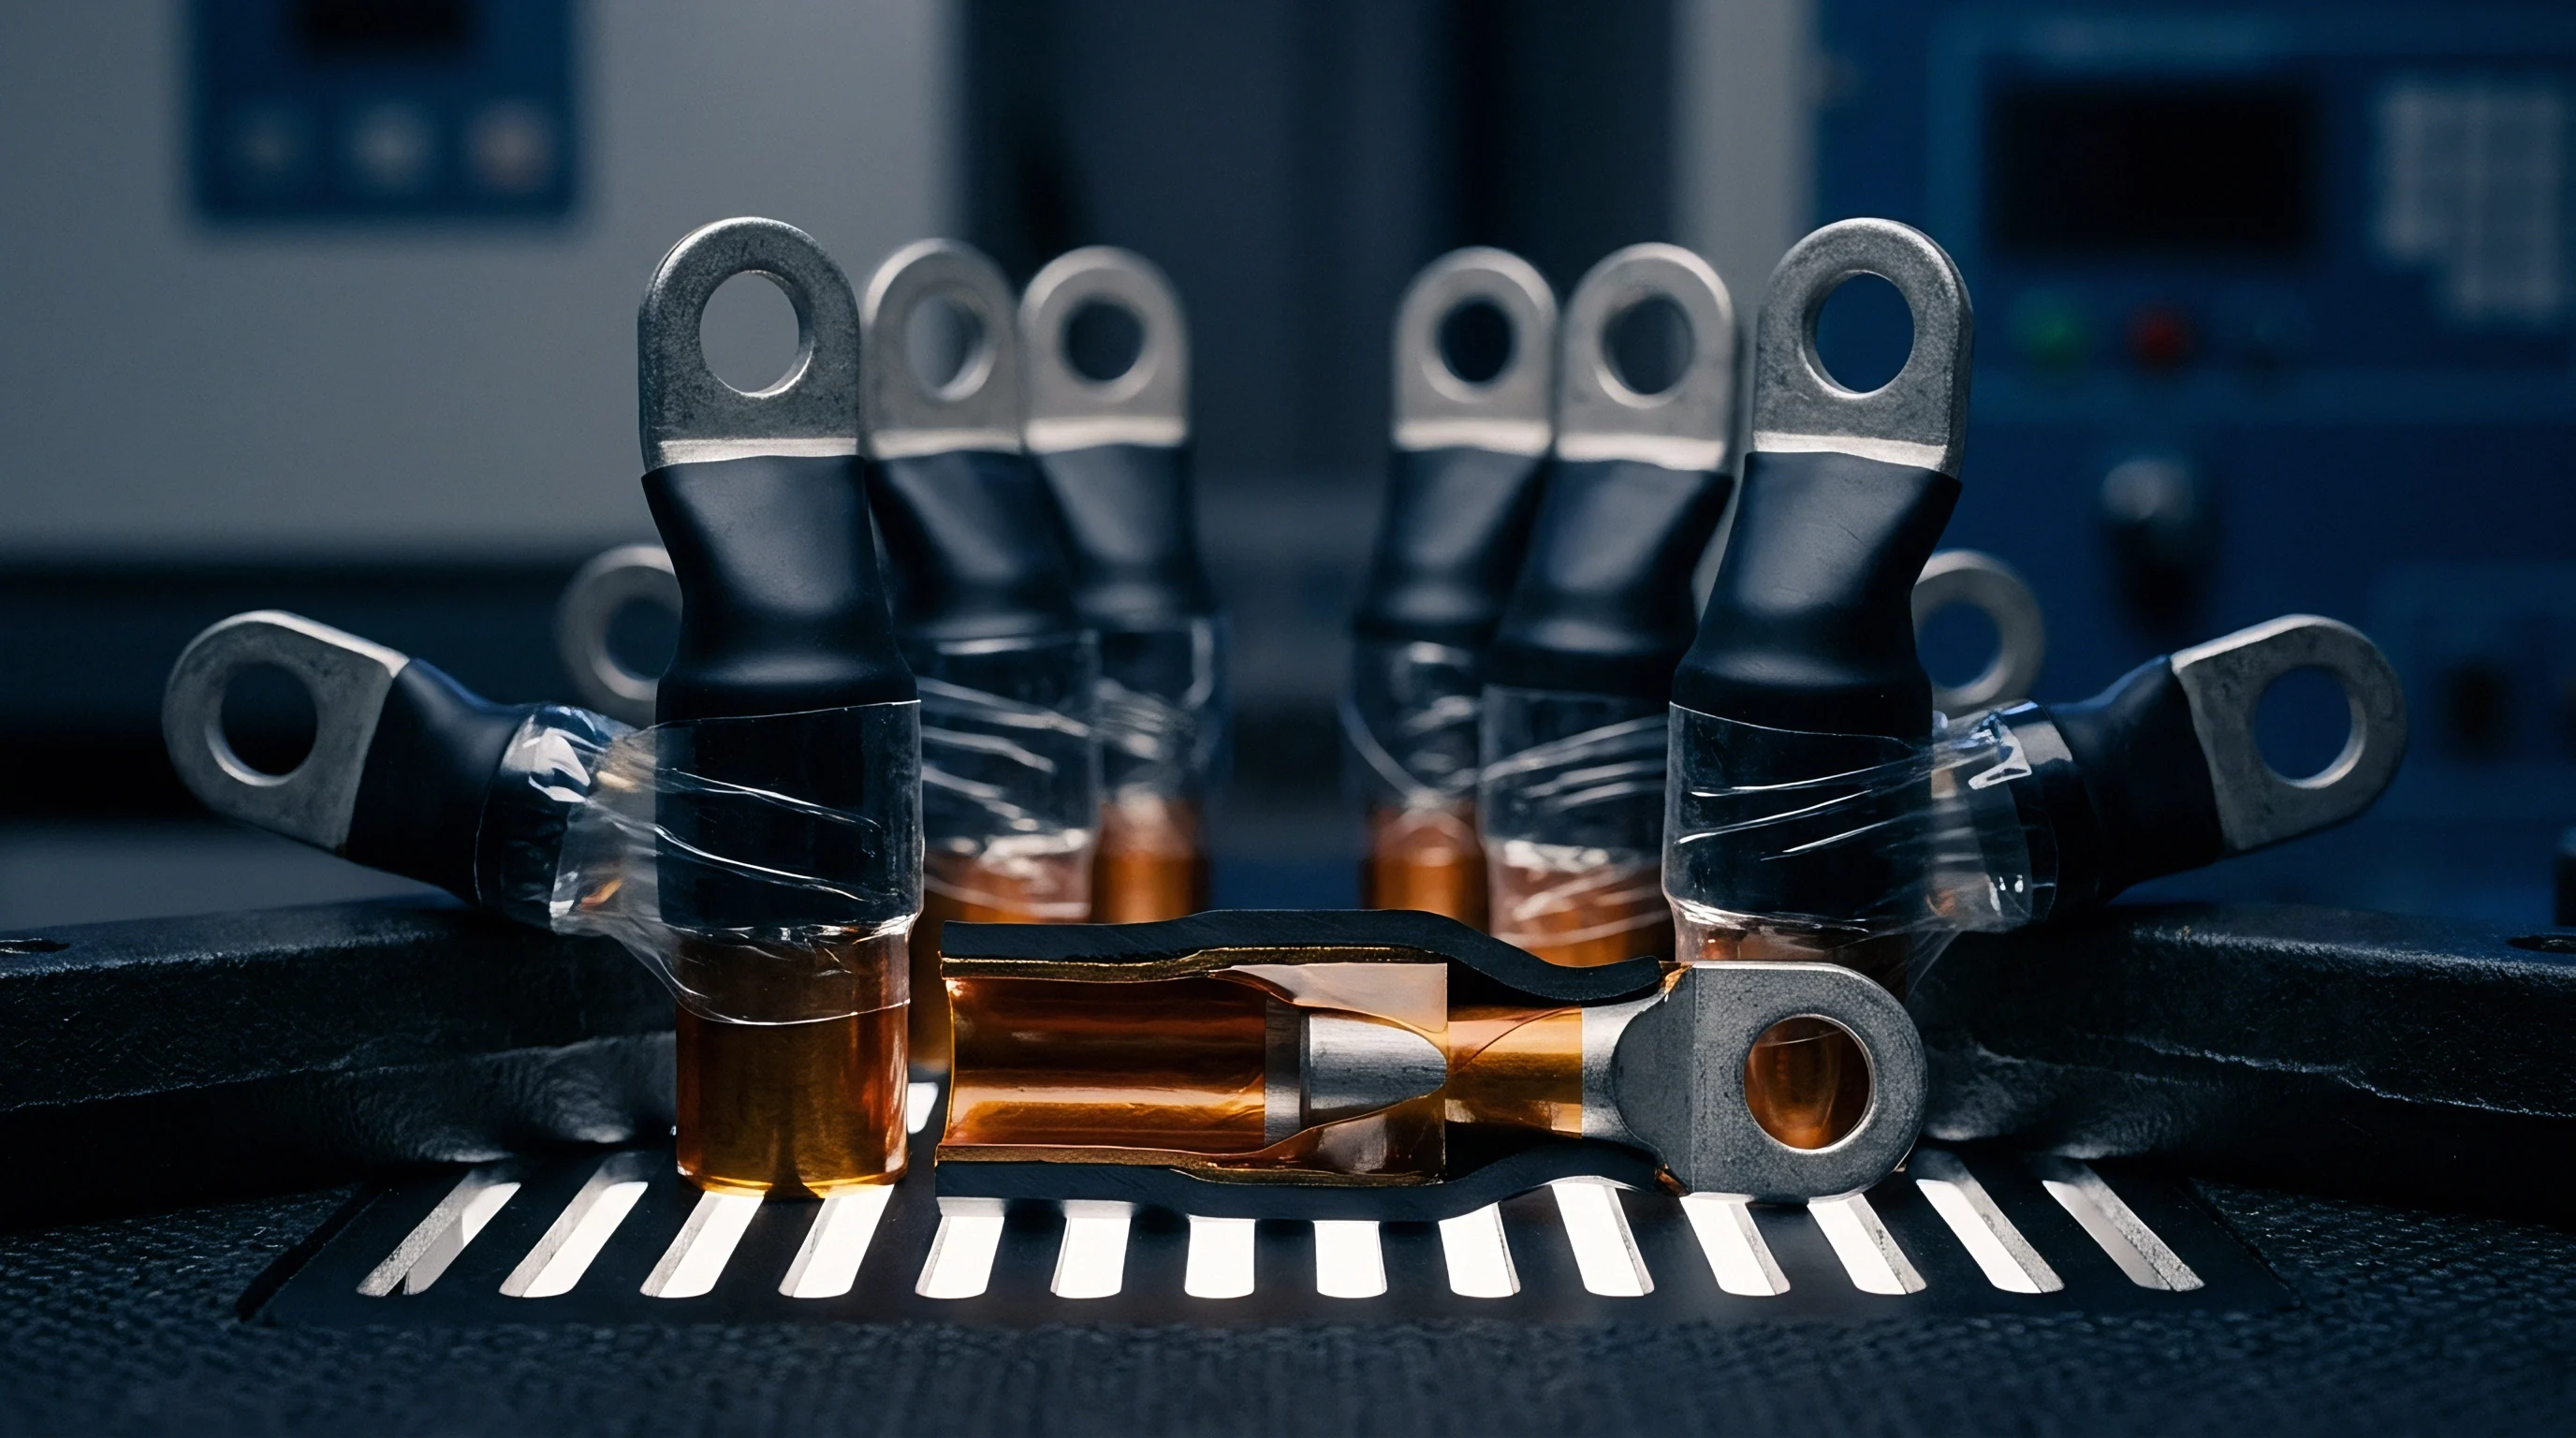
Transducer
Inline load sensing cells convert mechanical clamping forces into electronic signals to log dynamic stack pressure shifts throughout battery charge and discharge cycles. Accurate measurement demands sensors designed for long-term stability under sustained static loads, minimal drift across thermal cycling ranges, and low profile geometry to fit within standard environmental chamber shelves. Strain-gauge compression load cells and piezoresistive force sensors represent the primary instruments utilized in solid-state cell testing rigs.
Sensor capacity selection balances dynamic range against signal resolution. Solid-state cells using silicon-dominant or lithium metal anodes experience dramatic expansion during charging. A cell operating at a baseline baseline pressure of 5 MPa may exert forces equivalent to 15 MPa or higher at 100 percent state of charge.
Load sensors selected for calibration fixtures must possess a safe overload rating of at least 150 percent of maximum anticipated peak expansion forces to prevent permanent zero-point shift.
Thermal Drift Compensation inside Environmental Chambers
Temperature variations between -20°C and 80°C alter strain gauge bridge resistance independently of applied mechanical force, introducing substantial measurement errors. Thermal expansion alter mechanical baseline pressure. Uncompensated load cells exhibit zero-drift characteristics up to 0.08 percent of full-scale output per degree Celsius.
Across a 50°C thermal ramp, an uncompensated 50 kN load cell introduces an artificial force error of 2.0 kN, equivalent to a false pressure change of 0.42 MPa on a 48 cm² cell format.
Strain gauge bridge resistance drifts under heat. Internal temperature compensation circuits utilizing integrated platinum resistance thermometers (PT100) correct thermal output shifts in real time. Full-bridge strain gauge configurations employing self-temperature-compensated foil gauges bonded to nickel-plated alloy steel elements minimize thermal gain error to less than 0.005 percent full-scale per degree Celsius.
Worked Calibration Matrix for Thermal Stack Expansion
Evaluating compressive load changes across operational temperature ranges requires modeling differential thermal expansion between steel tie rods, aluminum platens, and sulfide cell layers. Consider a worked engineering calibration setup for a single-cell sulfide solid-state pouch format with the following defined parameters:
- Active cell area footprint measures exactly 80 mm by 60 mm, yielding an active planar surface area of 48 cm² (0.0048 m²).
- Target static baseline pressure equals 5.0 MPa, requiring a total calibrated baseline force of 24.0 kilonewtons.
- Fixture frame construction utilizes 316 stainless steel tie rods with a thermal expansion coefficient (αsteel) of 16.0 × 10⁻⁶ K-1 and an active clamp length of 120 mm.
- Platen stack assembly consists of two 20 mm thick 6061-T6 aluminum plates with a thermal expansion coefficient (αalu) of 23.0 × 10⁻⁶ K-1 totaling 40 mm thickness.
- Operational temperature shift expands from an ambient baseline of 25°C to an elevated testing temperature of 65°C (Δ T = +40 K).
Thermal expansion of the aluminum platens (Δ Lalu = 40 mm × 23.0 × 10-6 K-1 × 40 K = 0.0368 mm) exceeds tie rod expansion (Δ Lsteel = 120 mm × 16.0 × 10-6 K-1 × 40 K = 0.0768 mm), resulting in a net structural gap opening of 0.040 mm. Without spring compliance, structural frame stiffness (Kframe = 450 kN/mm) causes a mechanical force drop calculated as:
Δ Fthermal = Kframe × Δ Lnet = 450 kN/mm × (-0.040 mm) = -18.0 kN
This 18.0 kN reduction drops applied stack force from 24.0 kN down to 6.0 kN, causing baseline pressure to fall from 5.0 MPa to 1.25 MPa. Calibration frames demand complete thermal stabilization. To stabilize mechanical stress across thermal shifts, calibrated spring disc packs with a lower spring rate (Kspring = 12.5 kN/mm) replace rigid washers, reducing net thermal pressure drop to less than 0.10 MPa over the 40°C temperature sweep.
According to ISO/IEC 17025 laboratory compliance guidelines, force sensors operating inside environmental chambers require secondary temperature-compensated calibration curves verified at 10°C intervals across the full thermal range.
Inaccurate tare zeroes invalidate test data. Calibration software maps temperature-dependent zero shifts, subtracting thermal artifacts from raw transducer output before logging cell expansion metrics.
Under ISO/IEC 17025 test calibration guidelines, uncompensated thermal zero-shift exceeding 0.05% full-scale per degree Celsius invalidates all lifecycle capacity retention data collected outside a controlled 25°C ± 1°C ambient envelope.
Deflection
Structural frame bending absorbs applied bolt torque, reducing the net mechanical pressure delivered to active battery separator layers. Standard cell compression fixtures utilize multi-bolt tie rod configurations surrounding central platen stacks. Under high internal pressures, top and bottom crosshead beams experience positive bending moments, bowing outward at their centers.
This structural flexure alters the distance between plates, concentrating force near peripheral tie rods while reducing compressive force across the active cell center.
Rigid frames limit center plate deflection. Quantification of frame deflection involves measuring structural displacement using digital linear variable differential transformers (LVDTs) or laser optical micrometers during load application. When structural frame deflection exceeds 5 percent of total stack compression displacement, mechanical force calibration curves lose linearity, corrupting cell expansion data recorded during cycling.
Does Stack Thermal Drift Alter Measured Cell Pressure?
Cell volume increases during lithium plating or silicon anode lithiation induce dynamic axial displacement against rigid fixture frames, driving instantaneous force amplification. In zero-gap rigid fixtures, a 10 percent volume expansion in a 1 mm thick solid-state cell stack forces platens apart by 100 micrometers. Against a high-stiffness fixture (K = 500 kN/mm), this displacement generates an additional 50 kilonewtons of internal force, raising stack pressure by over 10 MPa above nominal baseline target levels.
Mechanical frame compliance exceeding 1.5 micrometers per kilonewton reduces effective stack pressure on sulfide cell interfaces by 22 percent during full volume expansion at 100 percent state of charge.
Spring discs absorb active volume expansion. Incorporating calibrated Belleville spring stacks in series with load tie rods introduces designed mechanical compliance. By tuning overall spring pack stiffness to match anticipated cell swelling rates, pressure amplification during charging remains contained within safe operational boundaries, protecting solid electrolyte layers from mechanical crushing.

Structural Frame Failure Modes under High Pressure
Sustained load application exposes load frame components to fatigue and mechanical creep, corrupting long-term compression data. Identifying structural weakness early prevents multi-month cycling test corruption.
- Tie rod thread stripping occurs when excessive bolt torque overrides material yield limits during high pressure setup operations.
- Platen center deflection creates non-uniform contact fields, starving cell edges of required compression while over-compressing cell centers.
- Belleville washer inversion happens when thermal expansion forces drive spring discs beyond their linear deflection limits into flat plastic deformation.
- Load cell zero offset shift results from prolonged mechanical over-stress exceeding the sensor’s linear calibration range.
Bolt torque relaxation reduces stack load. Friction loss within thread interfaces introduces up to 30 percent variance in applied force when using torque wrenches alone for baseline calibration, requiring direct load transducer measurement during assembly.
Whether active hydraulic compression rigs can replace passive spring-loaded tie-rod fixtures in high-volume production testing without introducing cost barriers remains an open operational question.

Alignment
Non-parallel load plates introduce asymmetric force distribution across the pouch or prismatic sulfide cell plane, driving localized current density spikes. Edge pressure concentration causes dendrite penetration. When opposing platens deviate from parallel alignment by as little as 0.05 millimeters across a 100 millimeter span, local contact stress on the high side increases by over 200 percent while the low side loses contact entirely.
Uneven force distribution disrupts ionic flux, accelerating lithium filament penetration along high-pressure regions.
Parallelism errors drive uneven current density. Maintaining precise angular alignment requires self-leveling mechanical features and real-time mapping of contact stress distribution prior to initiating electrochemical testing sequences.
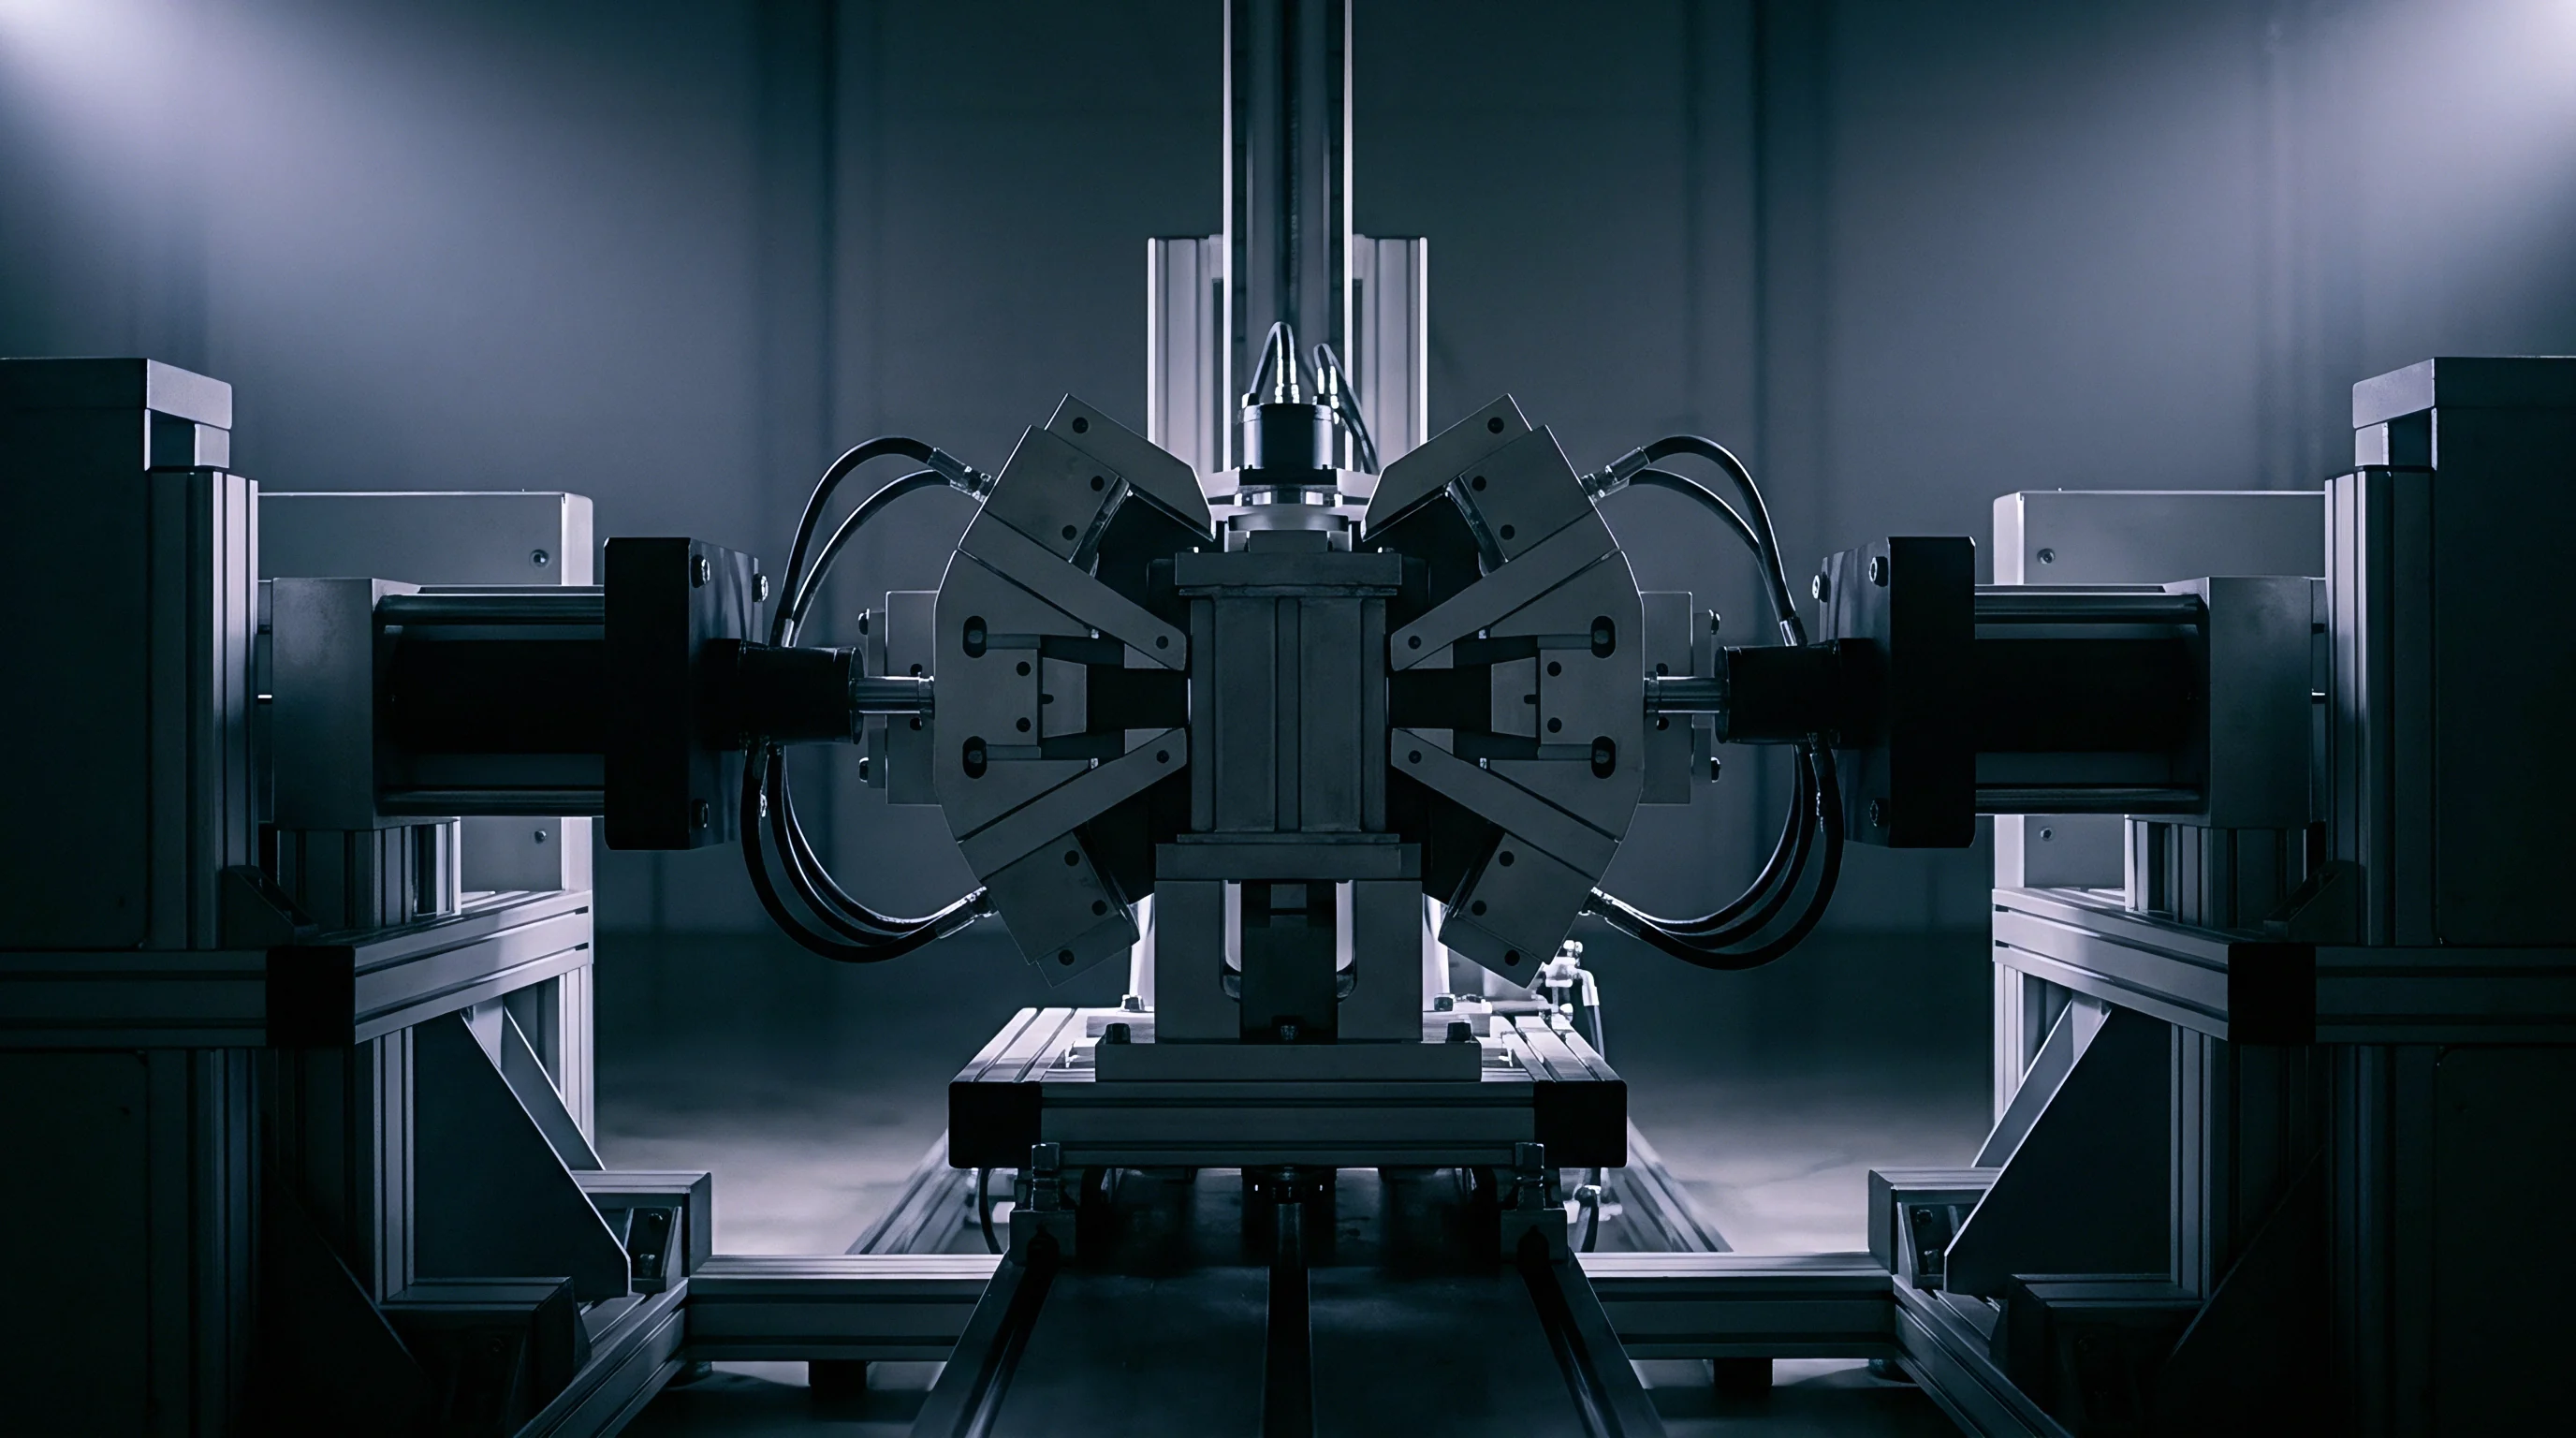
Pressure Film Mapping and Interface Verification
Tactile pressure-sensitive films placed between load surfaces provide visual and quantitative measurement of planar contact uniformity before starting electrochemical tests. Fujifilm Prescale film membranes contain micro-encapsulated color-forming chemistry that ruptures under specific pressure thresholds, yielding a color density distribution proportional to local force concentration. Scanning exposed film through optical calibration software generates colorimetric pressure maps that quantify peak-to-peak force variance.
Soft pads dissipate peak localized forces. Inserting thin, high-durability elastomeric buffer pads or soft metallic foils (such as 100 µm pure aluminum or copper sheets) between fixture platens and pouch cell surfaces smooths micro-scale height variations in cell packaging, ensuring homogeneous force transfer across active electrode regions.
| Active Cell Footprint (mm) | Nominal Load (MPa) | Max Allowable Parallelism Deviation (mm) | Target Fujifilm Prescale Uniformity (% CV) | Max Peak Stress Concentration (Ratio to Nominal) |
|---|---|---|---|---|
| 30 x 30 (Coin / Small Pouch) | 5.0 | 0.005 | < 3.5 | 1.15x |
| 80 x 60 (Medium Pouch) | 5.0 | 0.010 | < 5.0 | 1.25x |
| 150 x 100 (Large Pouch) | 5.0 | 0.015 | < 7.5 | 1.35x |
| 200 x 120 (Prismatic Format) | 10.0 | 0.020 | < 8.0 | 1.40x |

Decision Framework for Compression Fixture Selection
Selecting an optimal pressure fixture requires balancing frame stiffness, thermal mass, dynamic load compensation, and channel density in test cabinets. Active area geometry fixes transducer capacity.
- Target operating pressure range determines whether mechanical spring packs or pneumatic active control circuits provide optimal stack load stability.
- Thermal chamber envelope size restricts fixture dimensions and weight, governing material selection between high-strength stainless steel and anodized aluminum alloys.
- Active cell area geometry specifies platen surface area and bolt positioning to prevent cantilever bending during high pressure cycling.
- Data acquisition sample rate defines load cell sampling frequency required to capture rapid pressure spikes during high-rate discharge tests.
Sub-standard surface preparation corrupts sensor readings. High pressure spots captured during pressure film mapping correlate directly with hot spots observed in thermal imaging cameras during high-rate discharge cycles.
Aligning fixture load plates to within one hundredth of a millimeter per meter eliminates localized shear stress concentrations that cause premature electrolyte cracking.
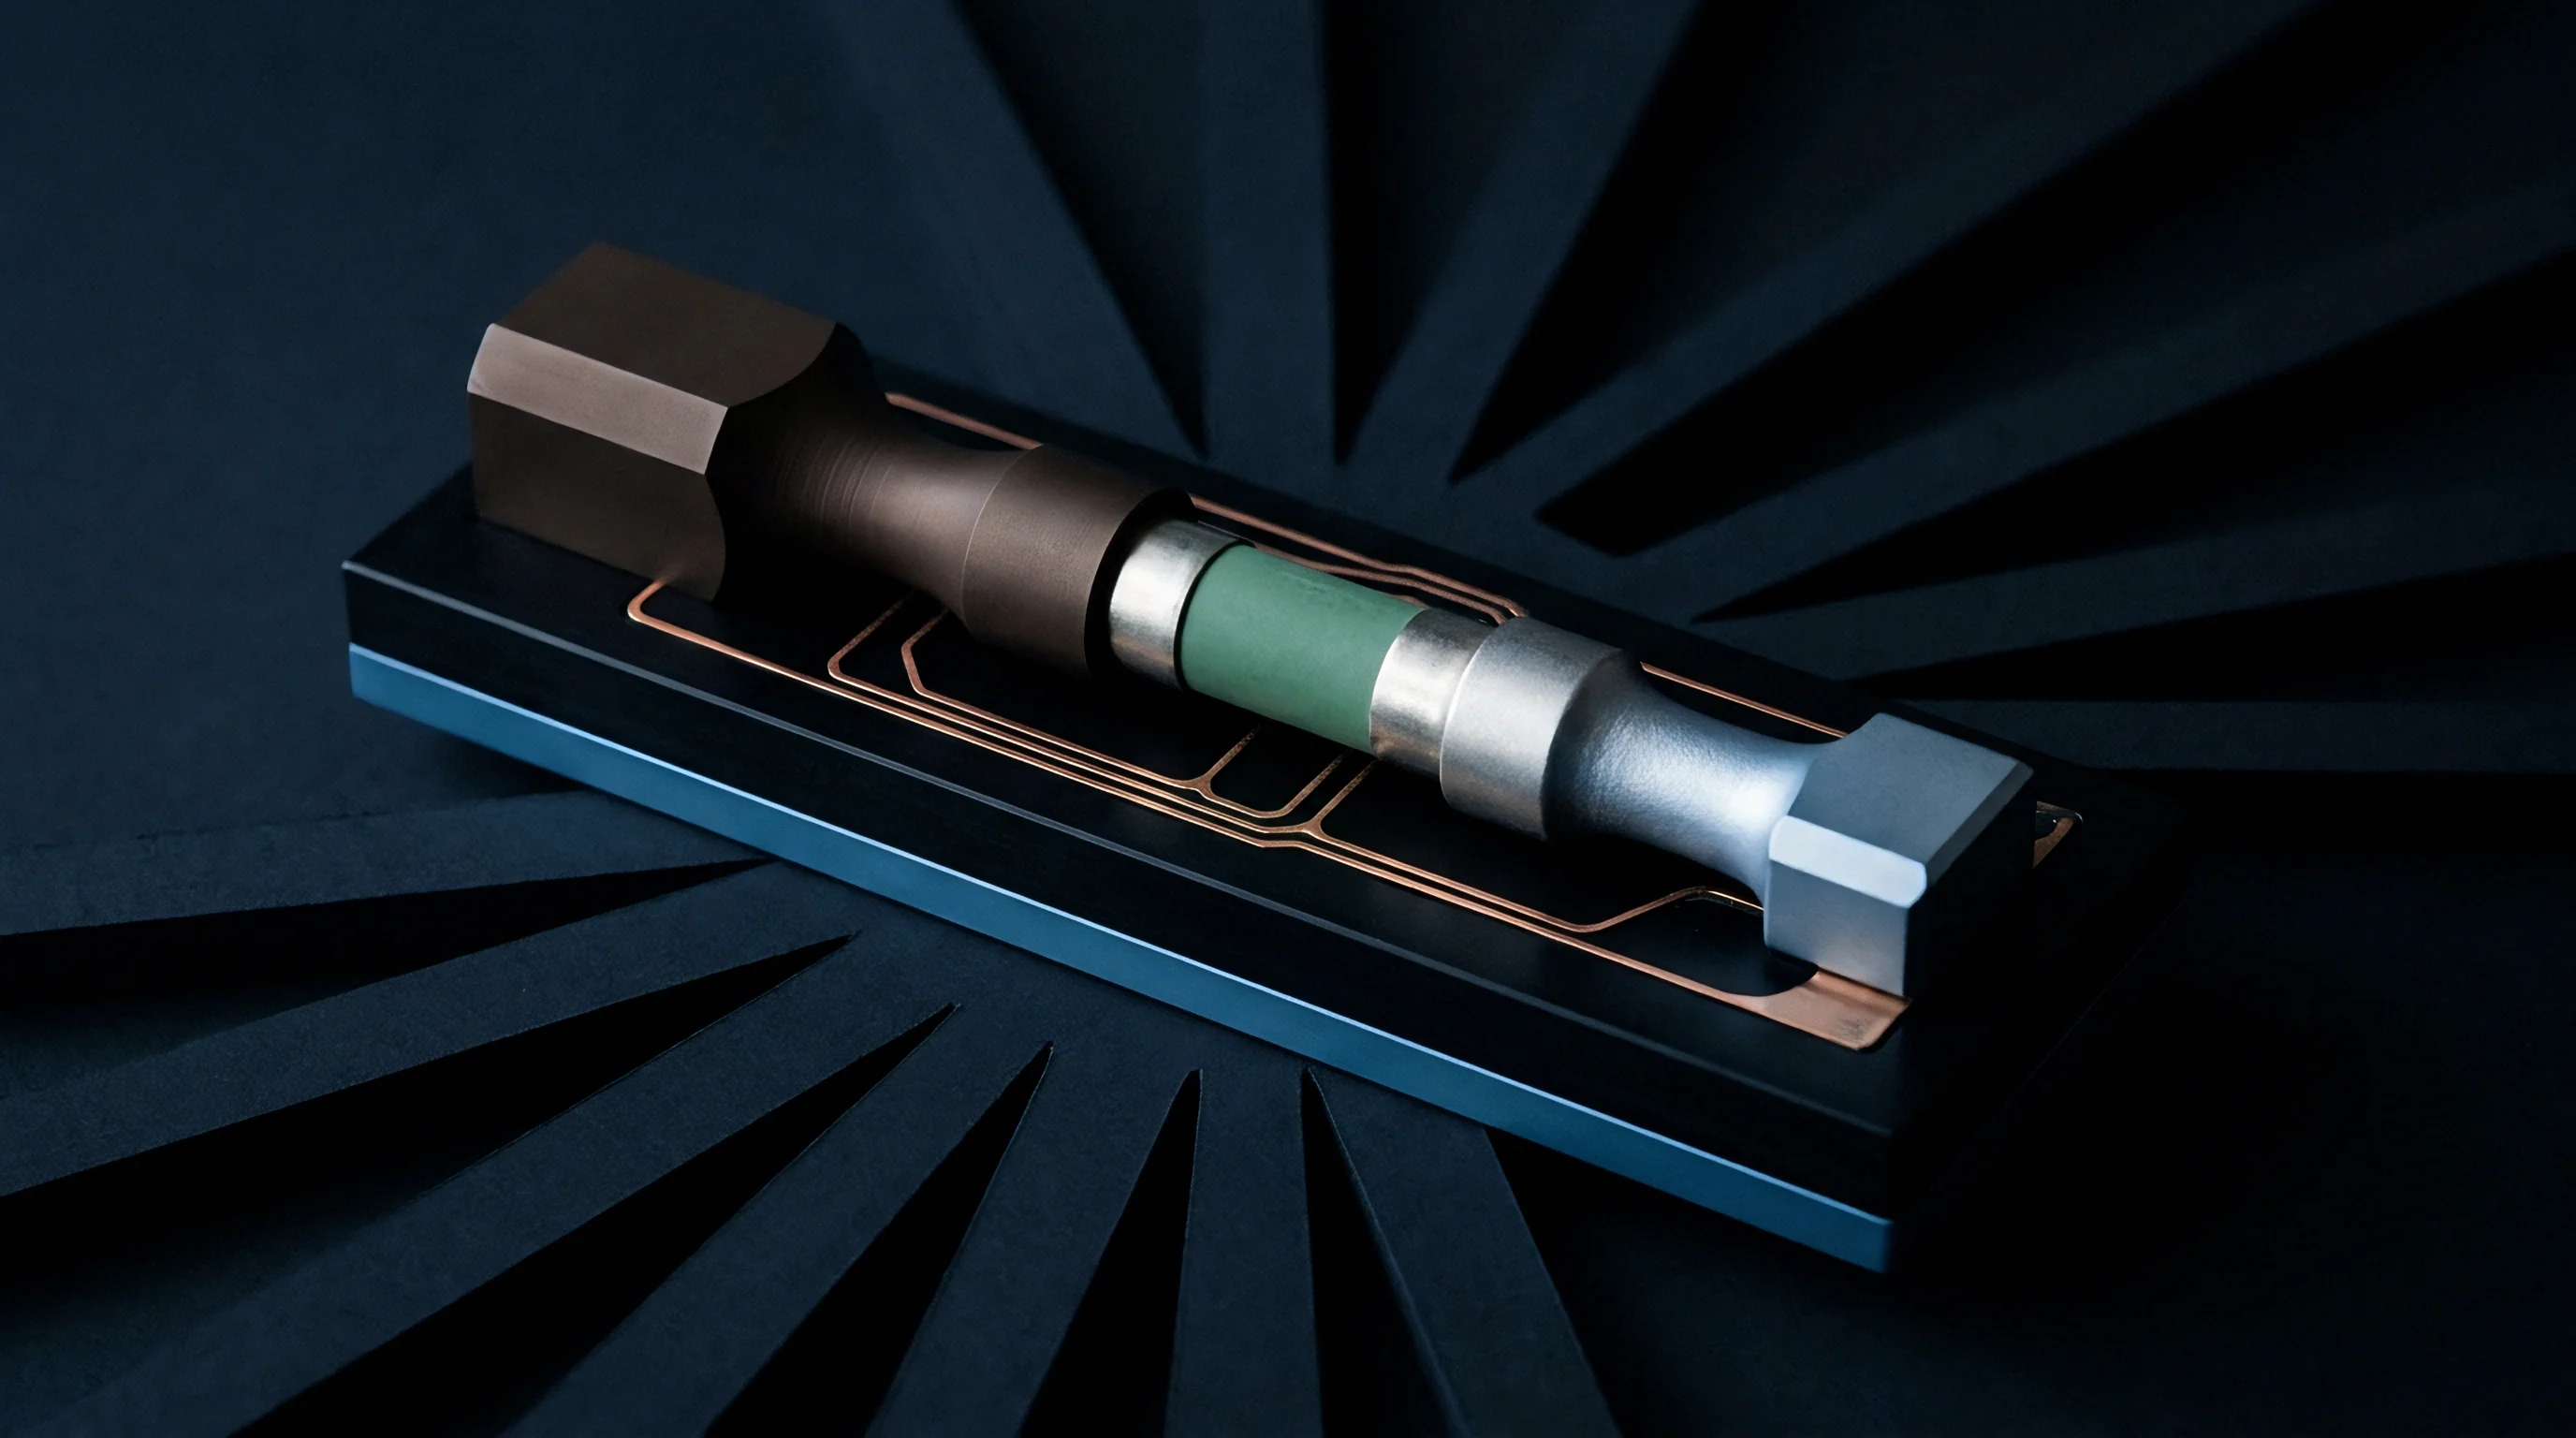
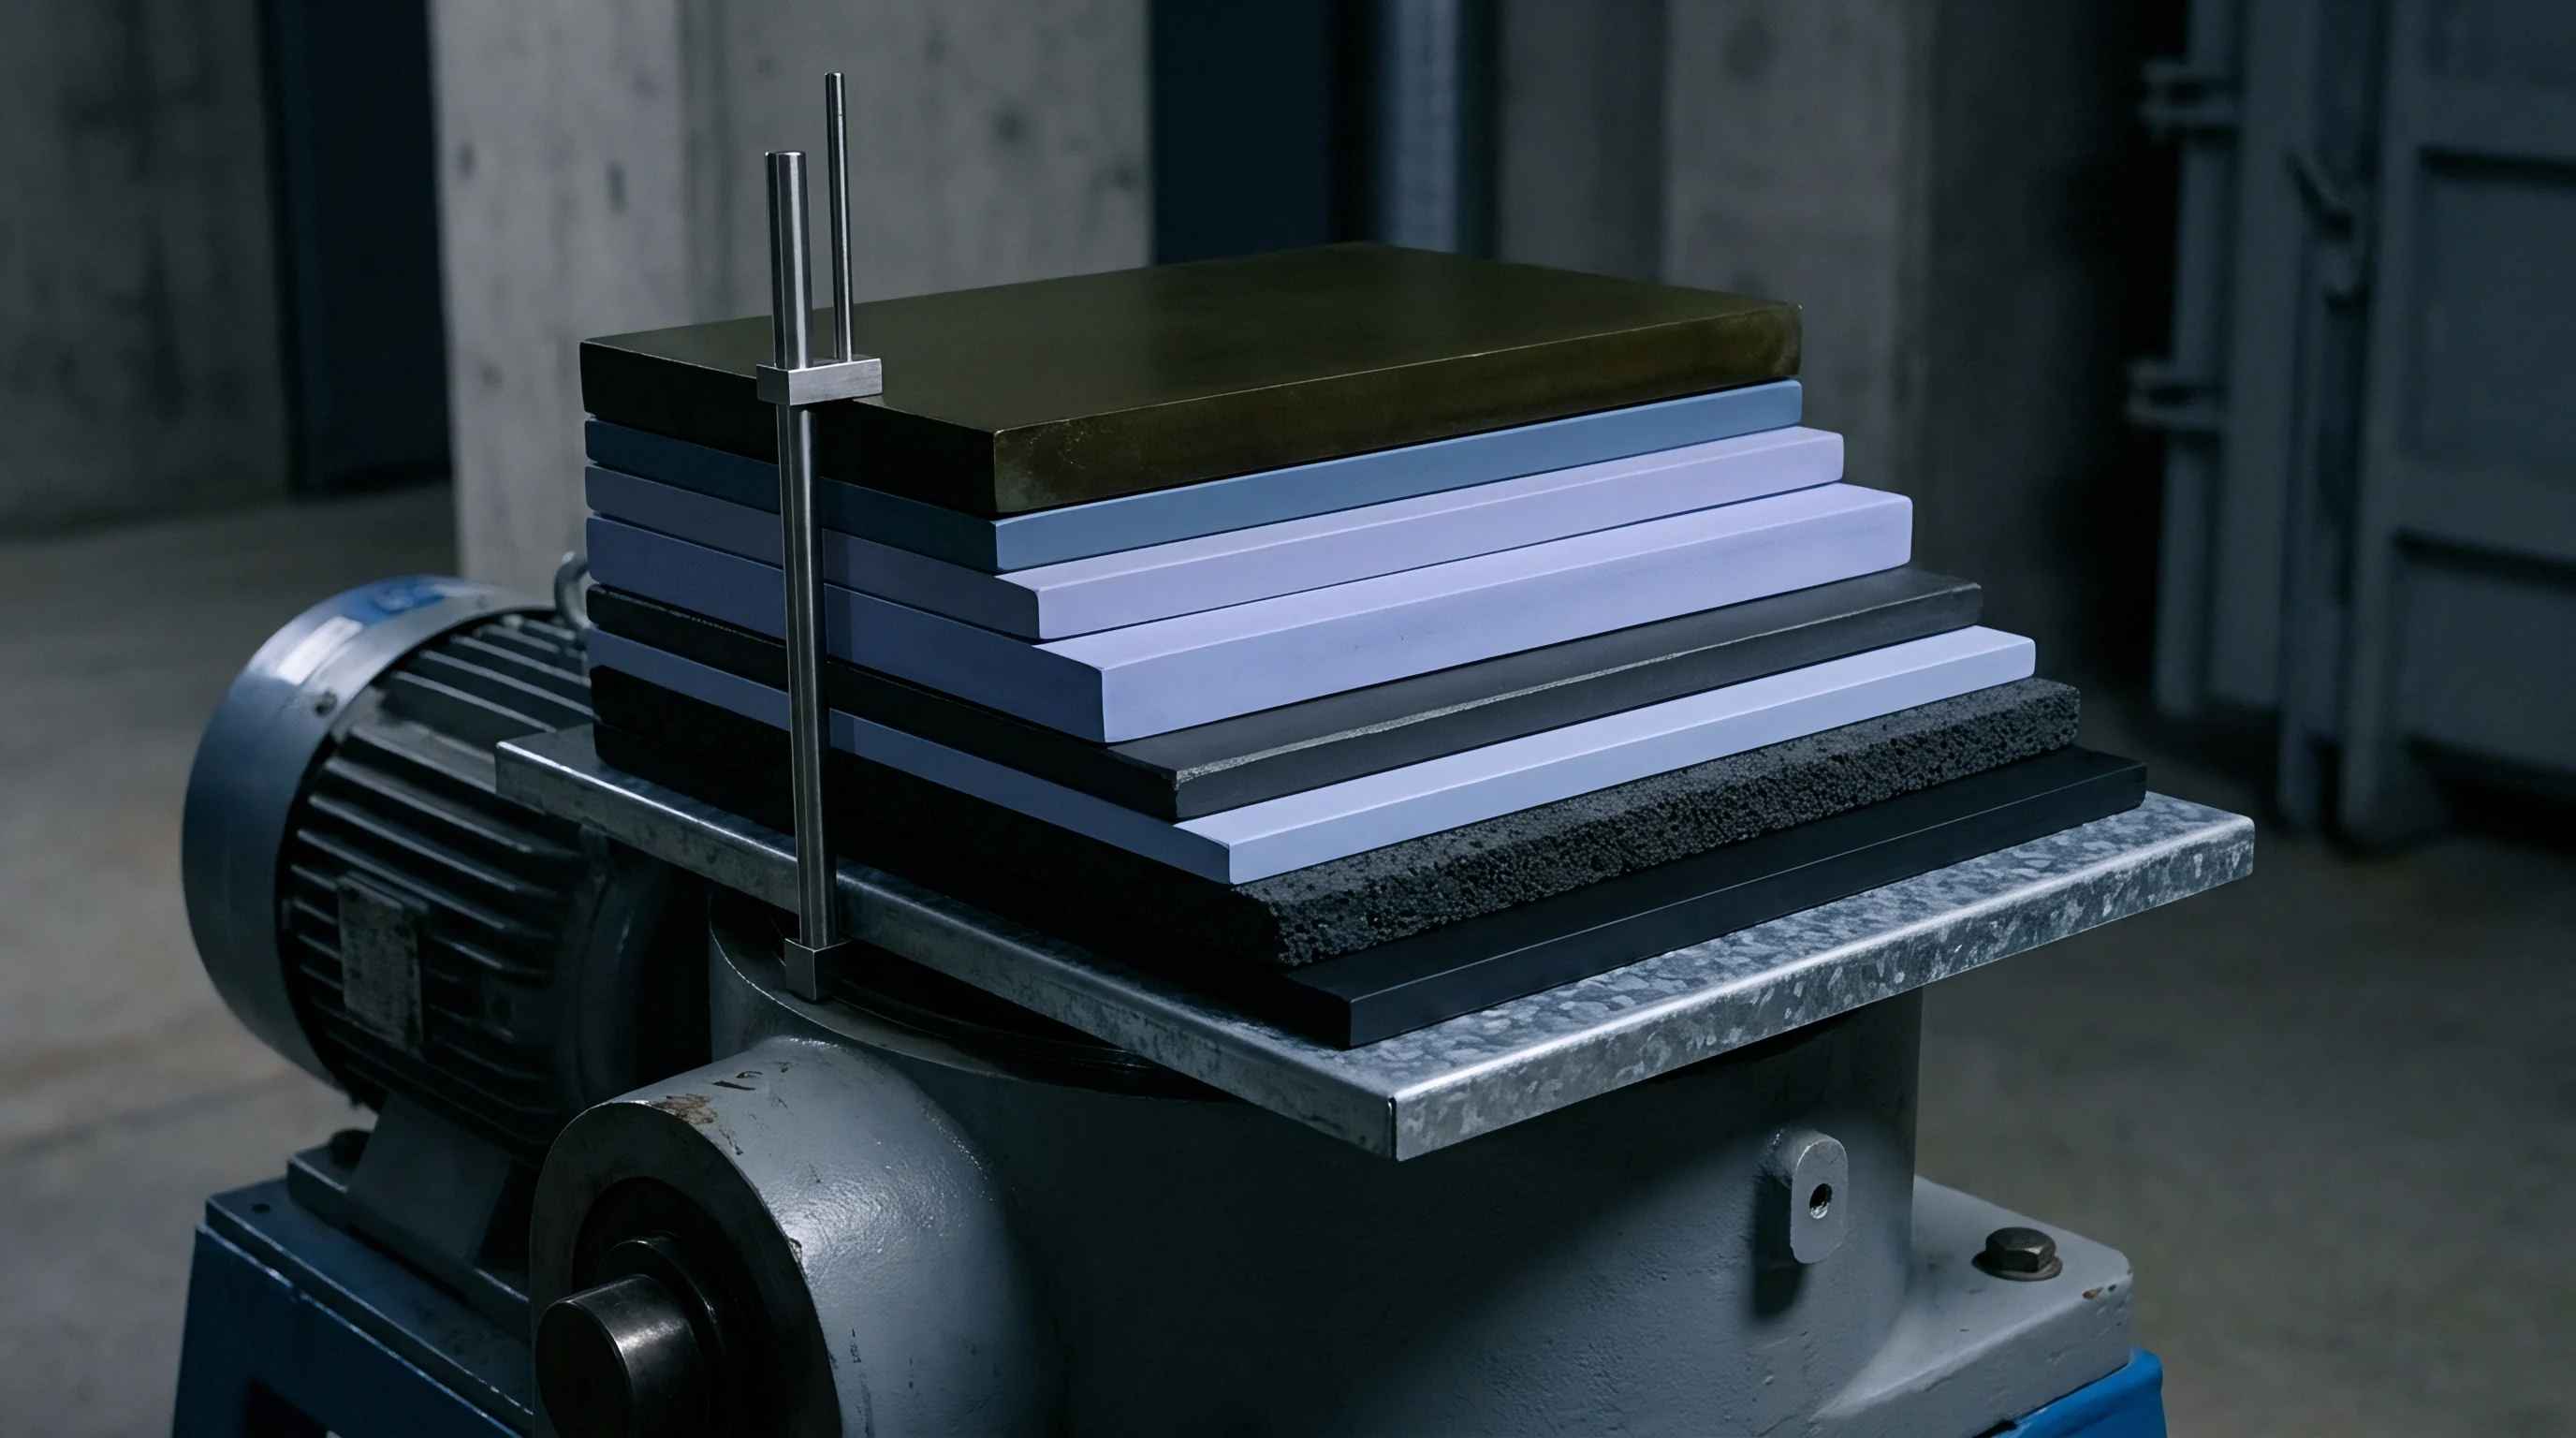
Allowance
Tolerance budgets for stack fixtures define the permissible manufacturing and assembly variances that ensure repeatable pressure application across cell testing batches. Accumulation of dimensional tolerances across platens, insulation sheets, load sensors, and spring washers creates significant channel-to-channel baseline pressure variation if unmanaged. In multi-channel test systems, an uncalibrated stackup variance of 0.15 mm alters baseline compression forces by up to 25 percent between adjacent test stations, invalidating comparative battery aging studies.
Establishing tight machining allowances on individual fixture components reduces stackup uncertainty. Ground alignment pins, precision shim packs, and standardized bolt torque procedures limit fixture-induced measurement noise across large-scale testing operations.
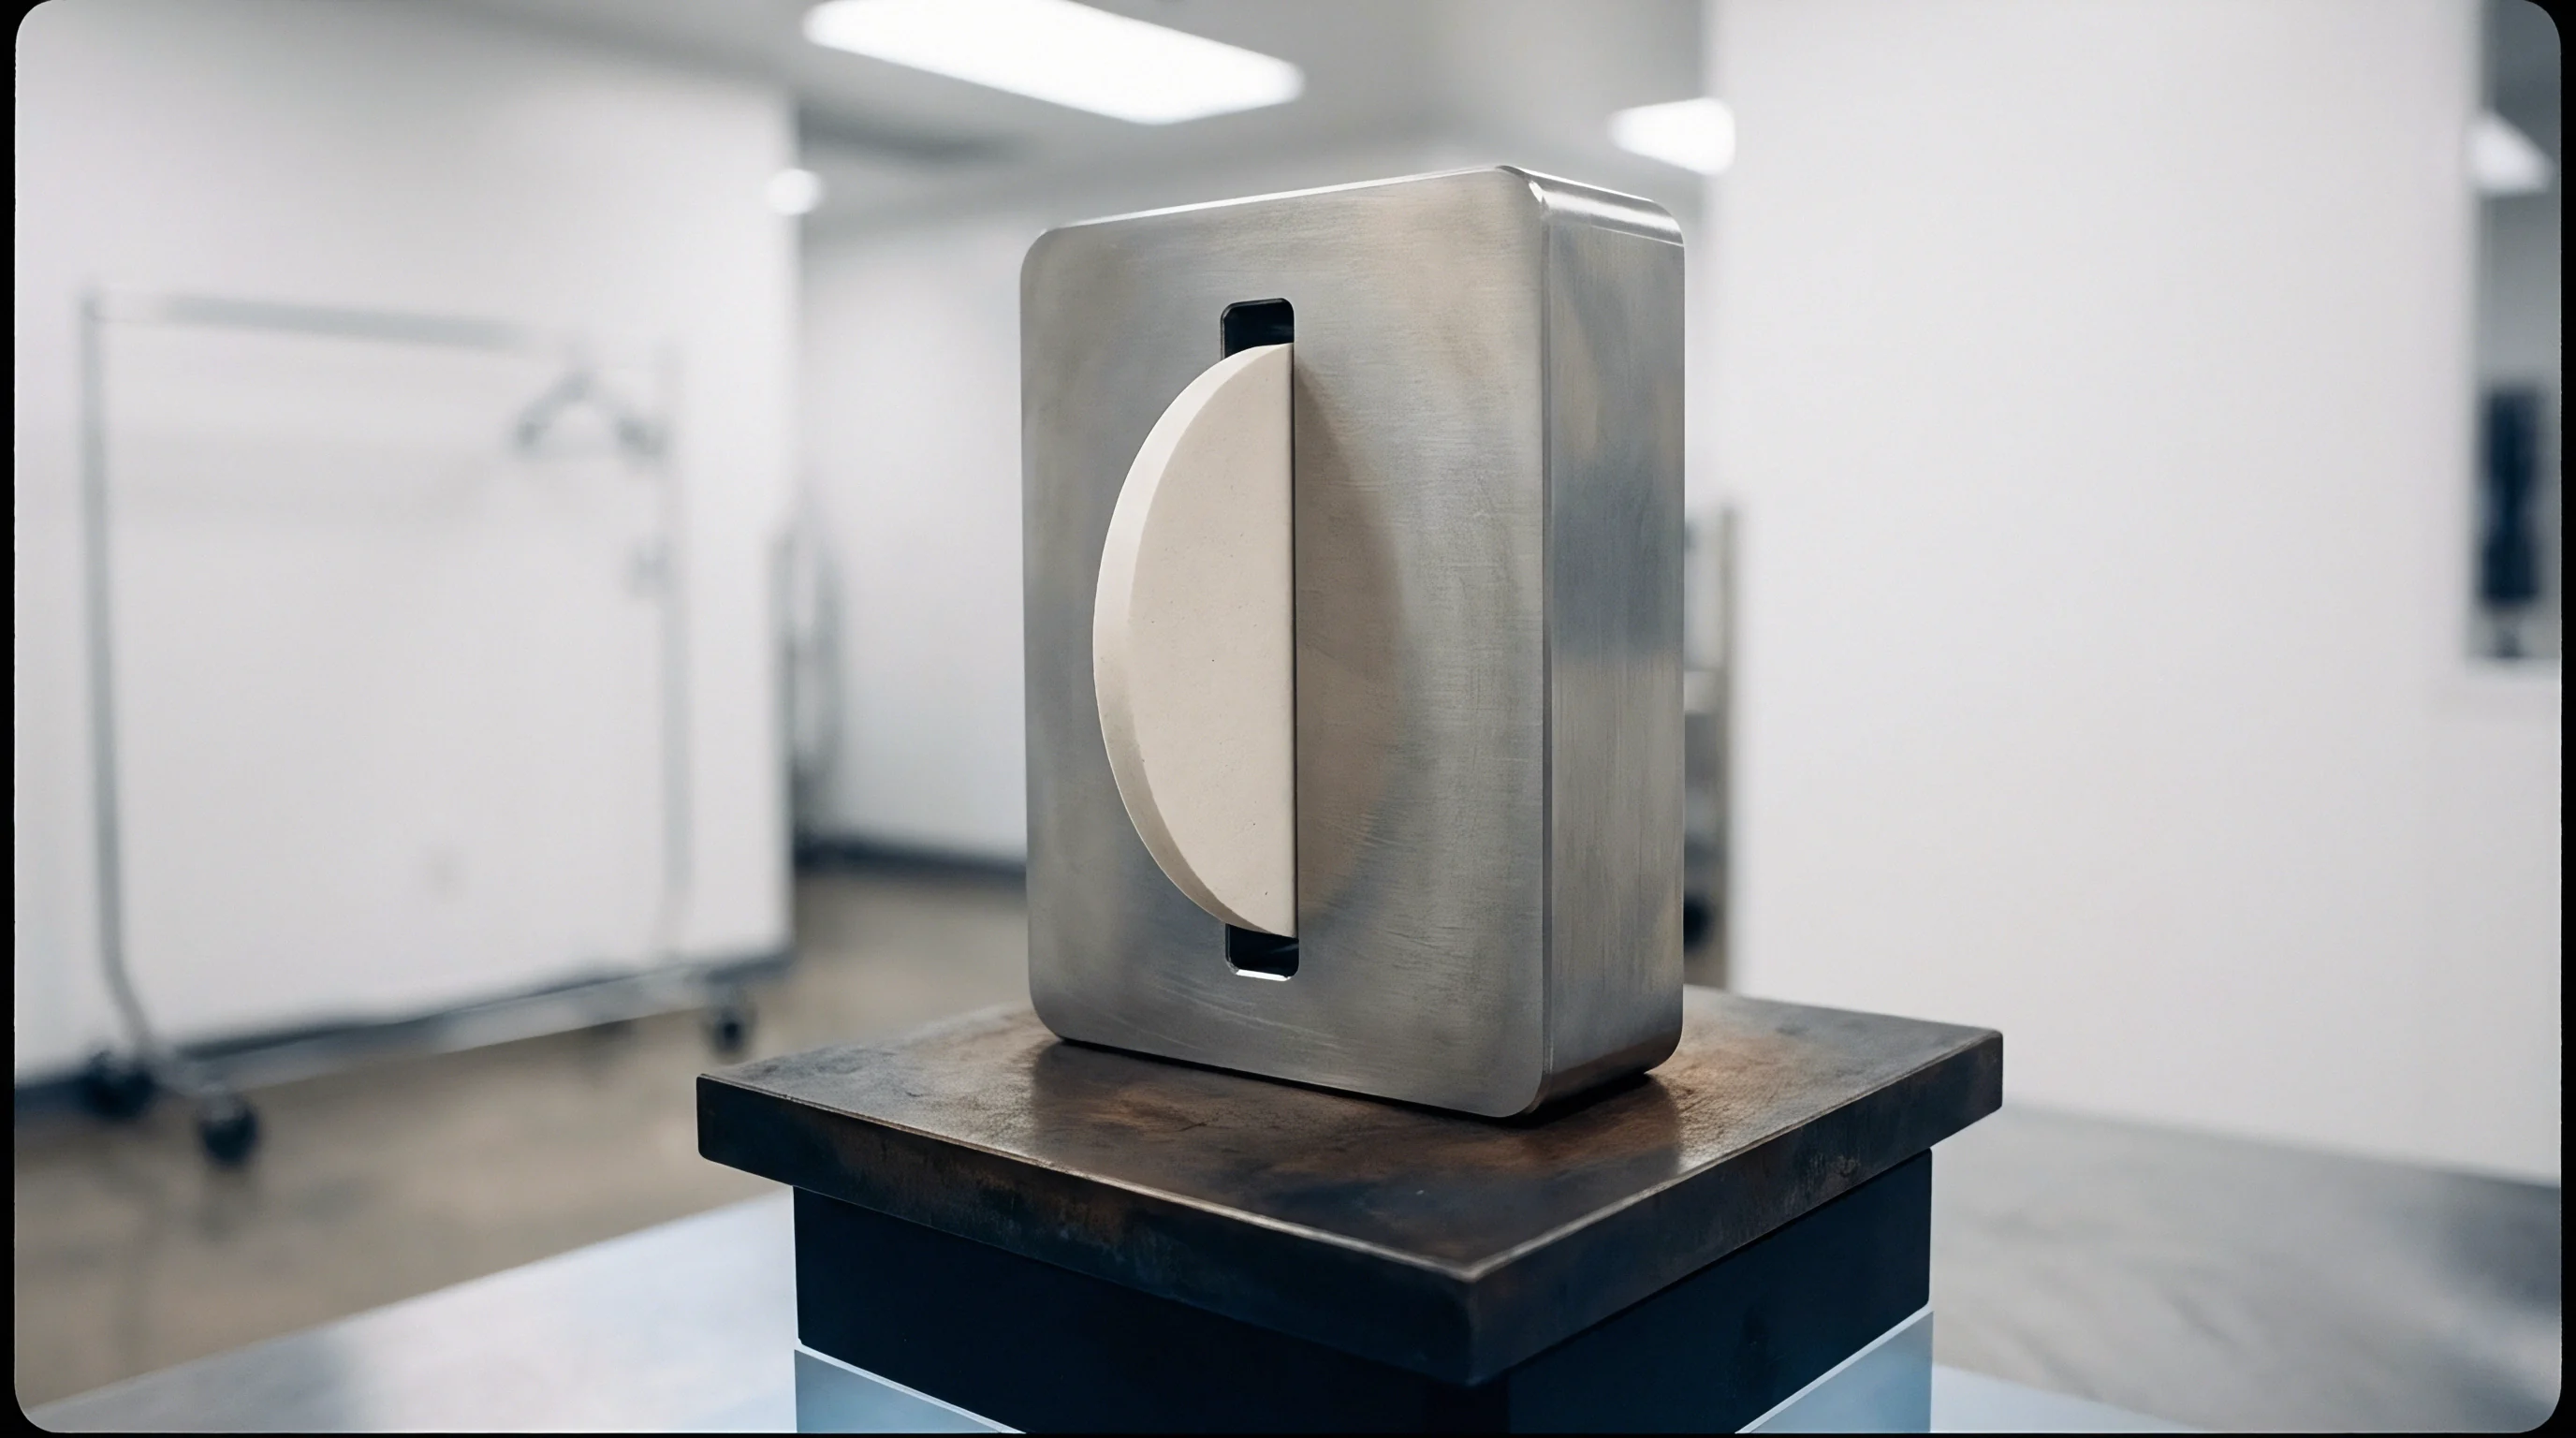
Manufacturing Tolerances and Stackup Analysis
Cumulative dimensional variation in platens, insulation sheets, spring washers, and load cell shims directly determines baseline force variance across multi-channel test channels. Conducting a root-sum-square (RSS) tolerance analysis provides a statistical estimate of total assembly height variation. For a five-component stack assembly with individual component tolerances of ±0.01 mm, RSS total tolerance equals:
Ttotal = sqrt(0.01)2 + (0.01)2 + (0.01)2 + (0.01)2 + (0.01)2 = sqrt0.0005 ≈ ± 0.022 mm
When combined with Belleville spring pack stiffness (K = 20 kN/mm), a height variation of ±0.022 mm generates an uncalibrated baseline force spread of ±0.44 kilonewtons. On a small 10 cm² test cell, this force variation translates into a pressure discrepancy of ±0.44 MPa, representing an 8.8 percent deviation from a 5.0 MPa baseline setting. Precision ground shimming steps during assembly correct these cumulative manufacturing deviations before final load calibration.
Commercial Sourcing and Quality Acceptance Terms
Procurement contracts for sulfide solid-state testing equipment bind suppliers to factory acceptance criteria based on load uniformity metrics rather than static dimensional tolerances alone. Buyers specify maximum allowable structural frame deformation under peak load, verified via laser interferometry prior to delivery. Guarantees must include calibrated force repeatability across a minimum 500-hour continuous load trial inside humidity-controlled environmental chambers.
Factory acceptance testing includes dynamic pressure mapping verification. Fixtures failing to hold planar parallelism within 0.01 mm under full 15 MPa clamping force face rejection, shifting calibration re-work costs entirely onto the equipment vendor.
Contractual specifications that embed load cell re-calibration schedules and maximum allowable frame deflection thresholds protect buyers against measurement drift across multi-year testing campaigns.