Incoming Cell Lot Acceptance Sampling and K Value Self Discharge Inspection Protocols
Incoming cell lot clearance requires zero-acceptance sampling combined with temperature-controlled K-value screening to intercept latent internal micro-shorts.


Dock
Receiving bays for energy storage components operate under tight temperature and timing constraints. Pallets of prismatic, pouch, or cylindrical lithium-ion cells arrive directly from ocean freight containers or regional logistics hubs. These incoming shipments carry baseline variability introduced during cell formation, grading, warehouse storage, and transit vibration.
Quality teams must quickly decide whether to release a lot to assembly or quarantine hundreds of thousands of dollars in inventory based on initial physical and electrical screening.
Zero-acceptance sampling plans, designated as C=0, serve as the baseline statistical standard for incoming cell inspection. Traditional schemes like ANSI/ASQ Z1.4 allow a calculated number of defective units in a sample before rejecting the entire lot. While standard consumer manufacturing tolerates minor non-conformances in low-risk categories, high-voltage battery assemblies cannot accommodate non-zero acceptance numbers due to thermal runaway hazards.
A single cell with an internal micro-short or compromised packaging threatens the safety of an entire module.
Selecting an Acceptance Quality Limit (AQL) establishes the statistical sensitivity of the receiving protocol. Major OEMs set an AQL of 0.010 for critical defects like external electrolyte leaks, negative tab deformation, shell wall indentations, and polarity reversal. Major defects ~ such as out-of-spec dimensions, damaged terminal threads, or unreadable barcodes ~ typically map to an AQL of 0.65.
Minor non-conformances, including cosmetic pouch wrinkling or faint terminal discoloration, carry an AQL of 4.0. Under a C=0 plan with an AQL of 0.010 on a lot of 50,000 prismatic cells, inspectors must pull and test 1,250 cells without a single failure to hit a 95 percent confidence level.

Statistical Mechanics of Zero Acceptance Sampling
Lot protection calculations rely on the hypergeometric distribution when sampling without replacement from a finite lot of size N containing D defective cells. Once lot sizes exceed a few thousand units, the binomial distribution serves as a dependable approximation. The probability of lot acceptance simplifies to the zeroth term of the binomial series ~ the proportion of conforming units raised to the power of the sample size.
For a lot with a true defect rate of p, the acceptance probability equals one minus p raised to the power of the sample size n.
Operating Characteristic (OC) curves map the risk profile shared between cell manufacturer and pack integrator. Producer risk represents the probability that random sampling variance triggers rejection of an acceptable lot; consumer risk is the probability that an out-of-spec lot passes through undetected. Standard ANSI/ASQ Z1.4 attribute plans scale sample sizes steeply alongside lot volume.
Modern C=0 protocols, such as those derived from Squeglia tables, decouple sample size from overall lot volume once shipments cross critical thresholds. The required sample count then depends almost entirely on the specified AQL and target consumer protection level.
Standard operating characteristic curves demonstrate that achieving ninety-five percent consumer protection against a zero-point-one percent defect rate demands a random sample of three hundred units without a single non-conformance.
Sampling plans must also reflect batch stratification within maritime shipping containers. Cell manufacturers routinely assemble a single delivery lot across multiple sub-lines or formation circuits. During ocean transit, pallets placed near container doors endure different thermal swings than those packed against the center bulkhead.
Inspectors distribute sample draws across all three spatial axes of the container. Stratified random sampling pulls units from top, middle, and bottom tiers of every third pallet to capture transit-induced environmental variation.
Physical Intake Inspection Execution
Unboxing runs inside climate-controlled receiving cells. Staff inspect tamper seals and pull data from container humidity loggers before slicing shrink wrap. Packaging checks verify intact vacuum seals on pouch cells, undamaged plastic tray dividers on cylindrical formats, and protective terminal caps on prismatic hardware.
Catching physical non-conformances at the dock keeps defective units from jamming automated pack assembly lines downstream.
- Clear the receiving bay floor and verify that ambient temperature remains between twenty and twenty-two degrees Celsius.
- Extract serial code records from the shipment manifest and scan twenty randomly selected outer carton barcodes to verify cryptographic batch signatures.
- Break pallet straps and unbox designated sampling cartons according to the stratified location matrix generated by the quality engineering software.
- Transfer pulled sample cells onto non-conductive ESD-safe workbenches equipped with calibrated environmental logging instruments.
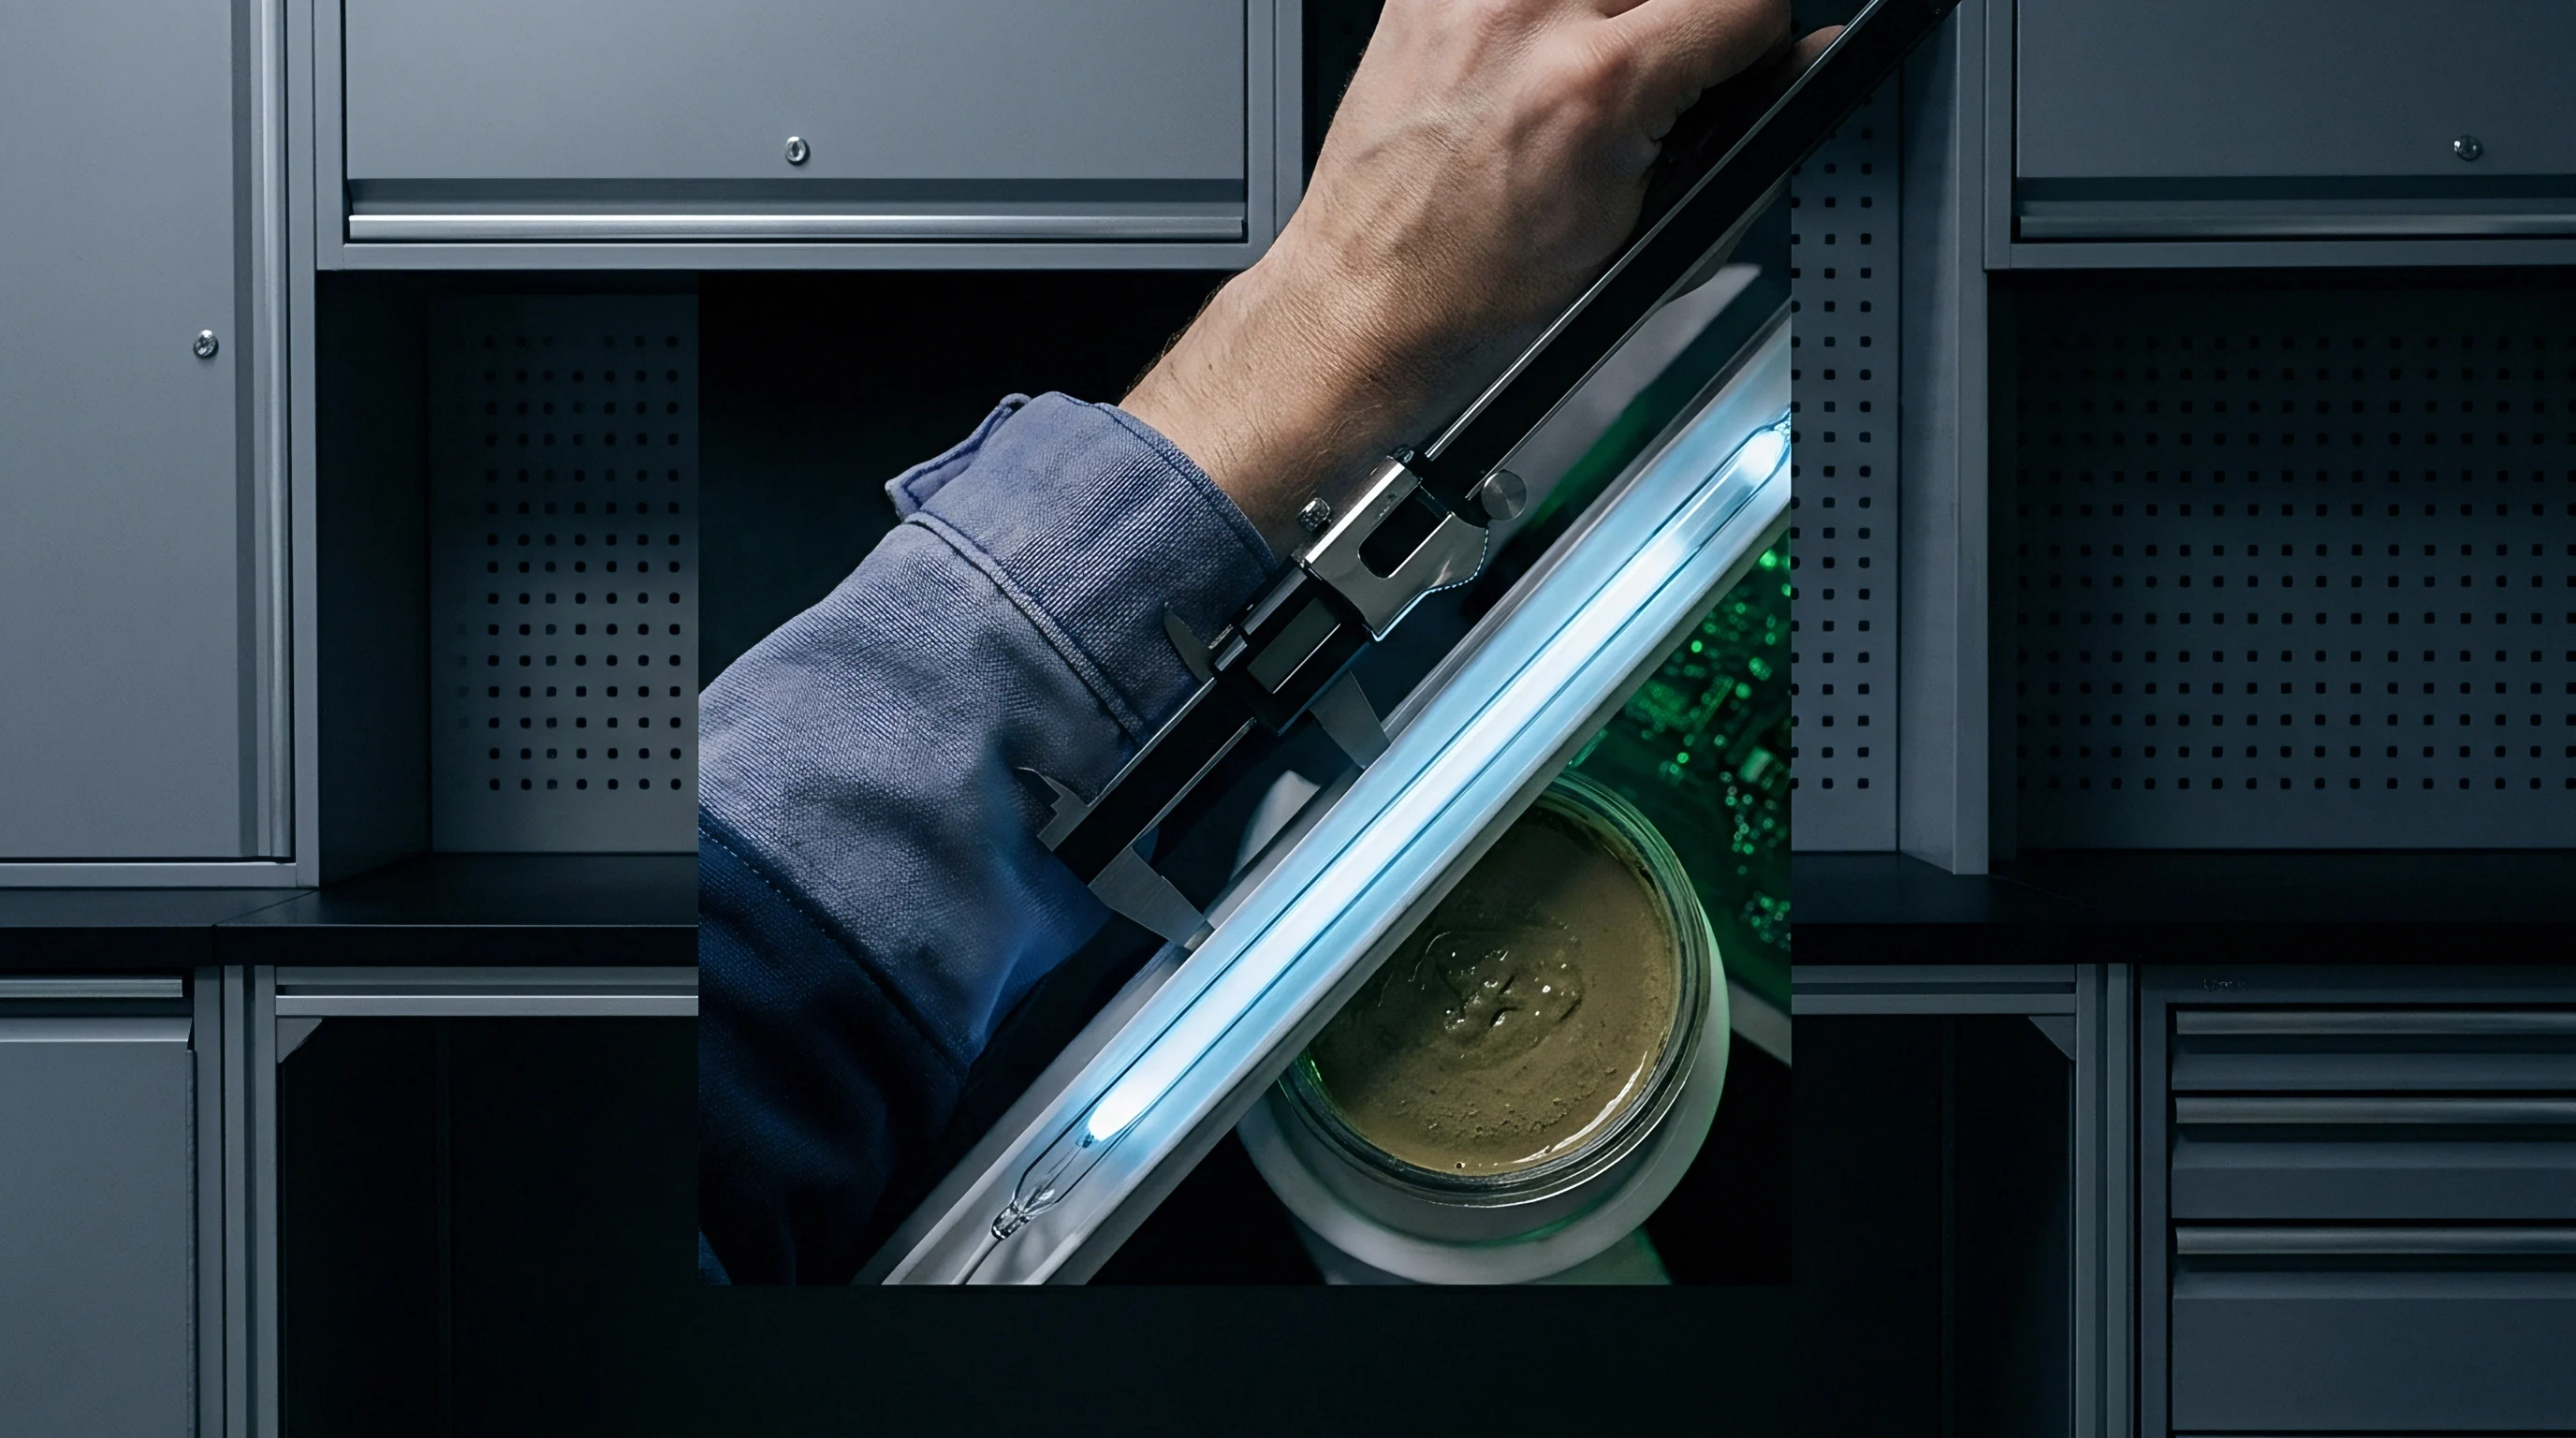
- Run dimensional checks using digital micrometers and optical coordinate measuring systems across cell height, width, thickness, and terminal alignment.
- Inspect cell vents, seals, and welds under ten-times magnification for electrolyte crystallization, vent membrane scoring, or shell pit corrosion.
- Measure baseline open-circuit voltage and internal AC impedance at one kilohertz using calibrated four-wire Kelvin probes.
- Log all measured values into the statistical process control database to compare incoming lot metrics against factory acceptance test certificates.
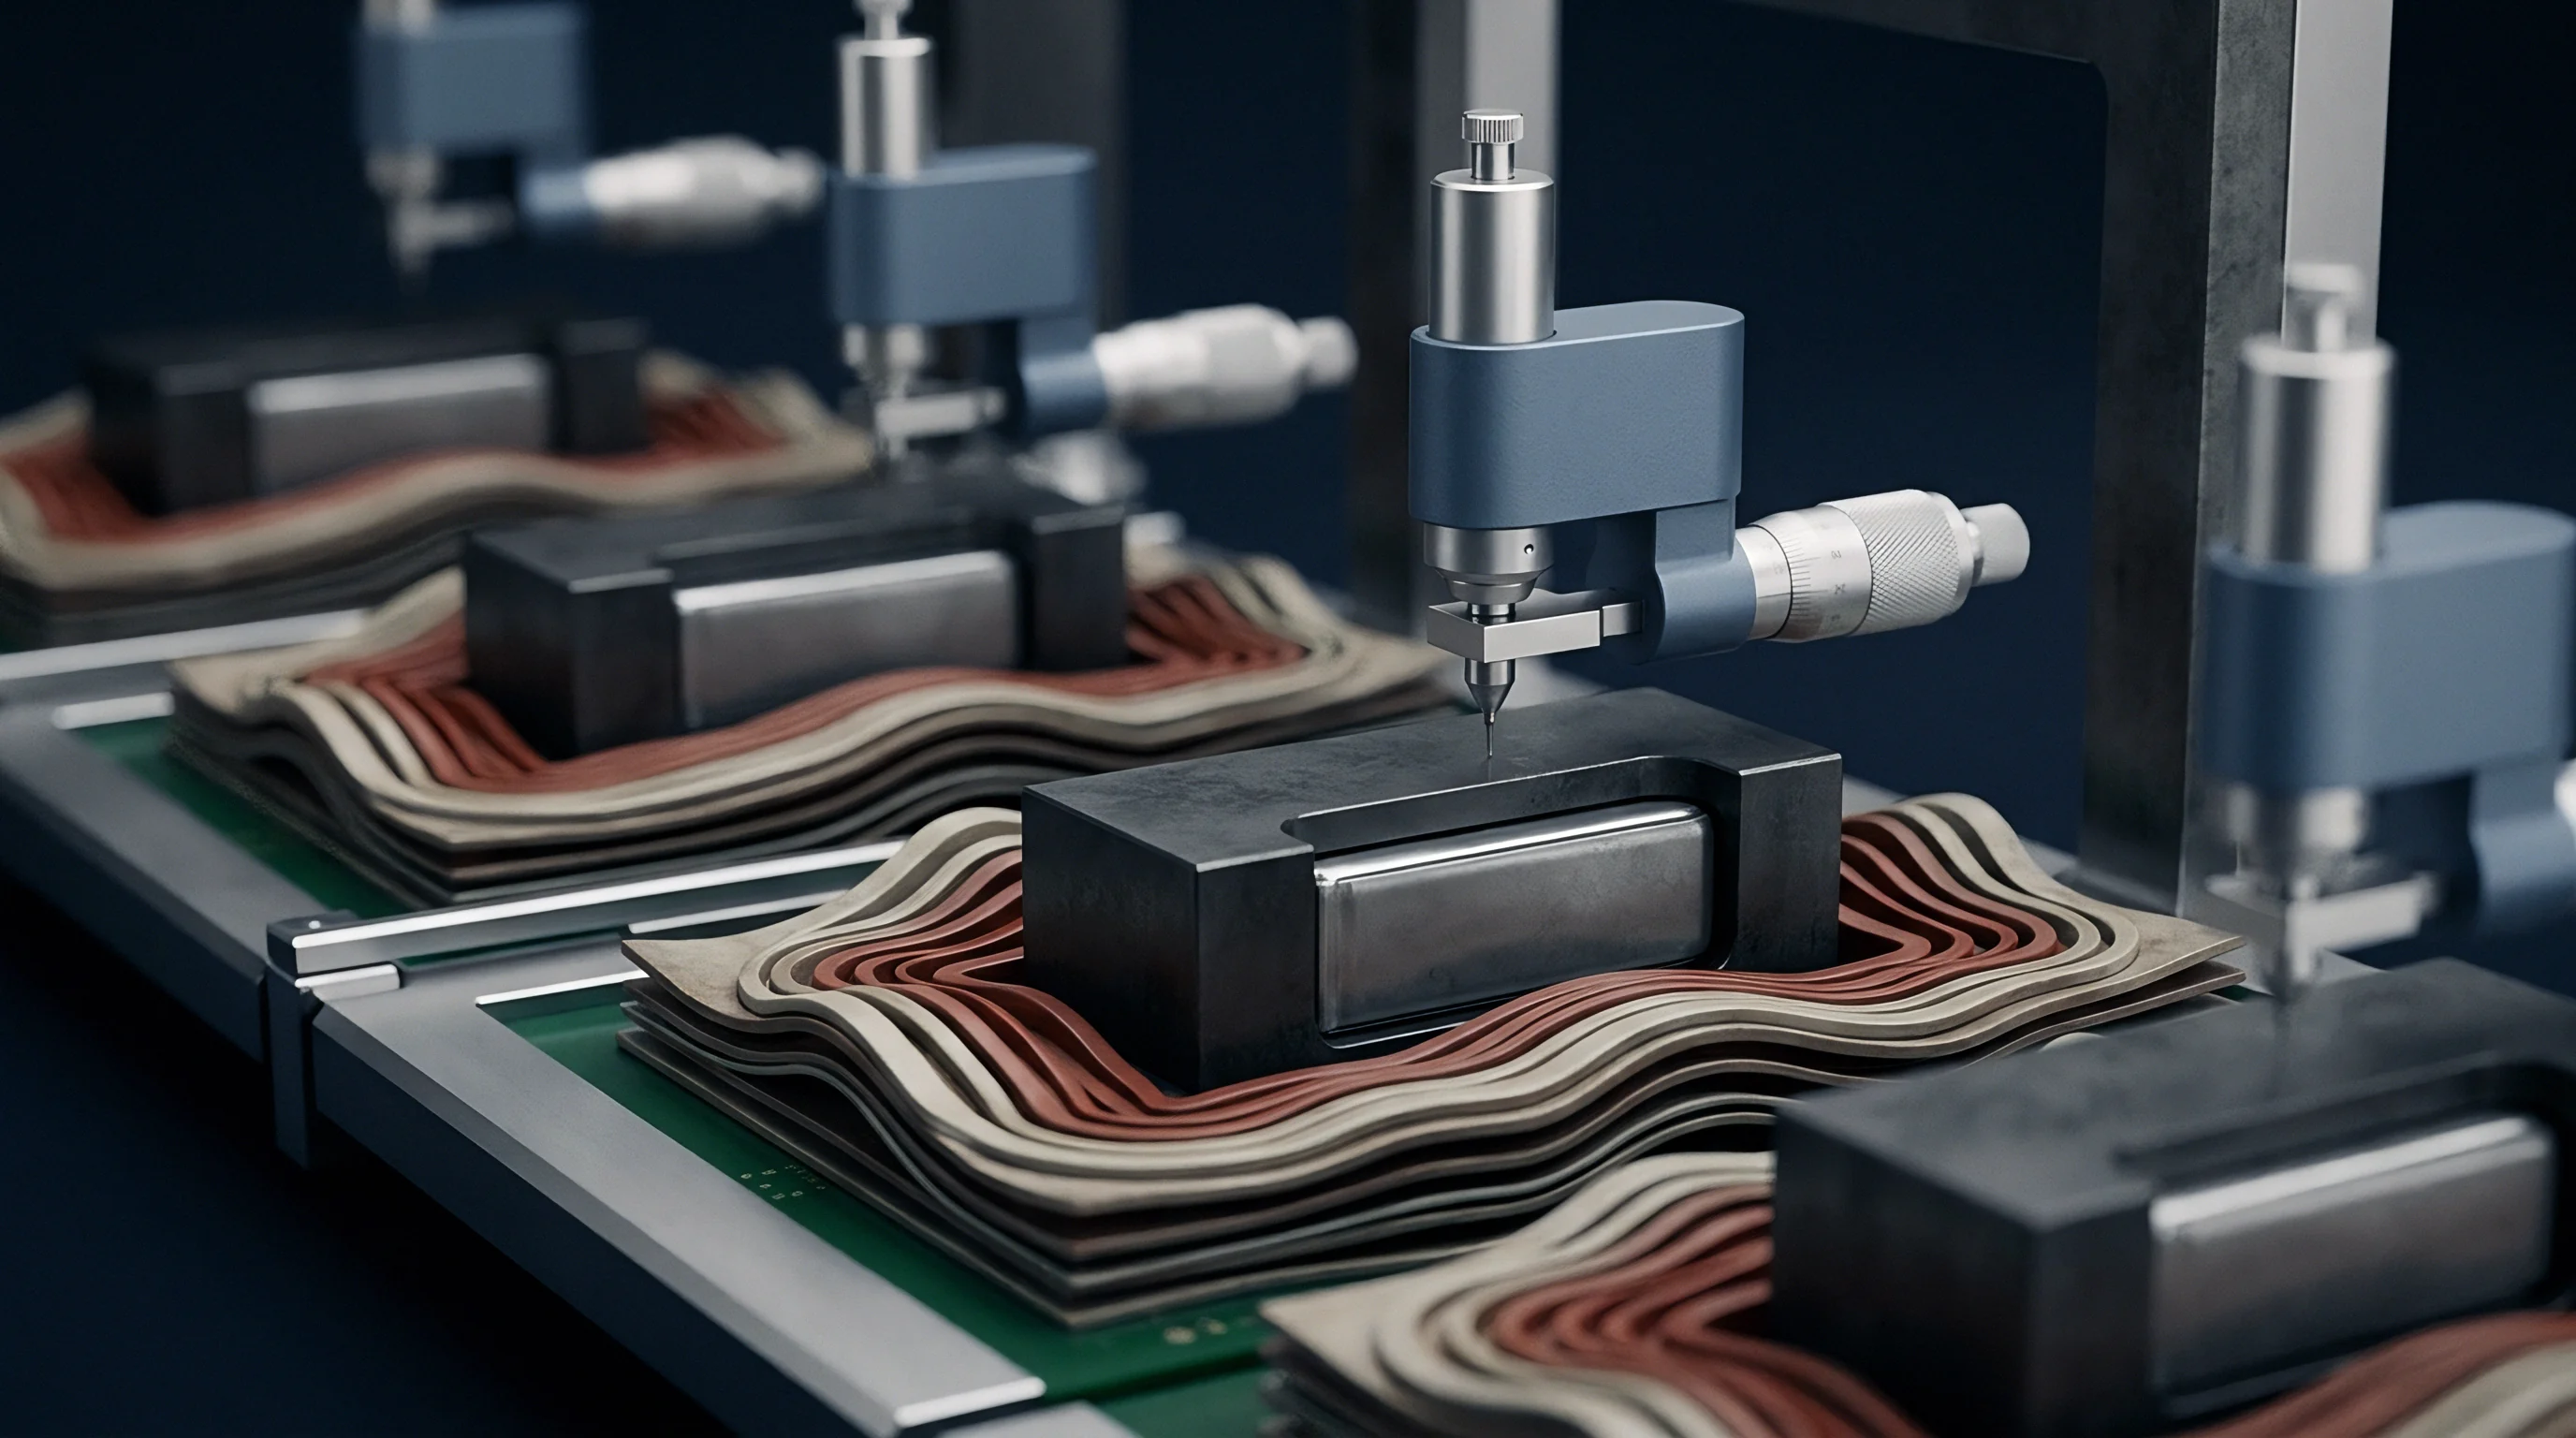
Dimensional checks require dedicated fixtures for each cell geometry. Prismatic aluminum cans swell along their broad faces during formation and aging. Inspectors seat them inside precision restraint plates set to standard stack pressures ~ typically 0.3 to 0.5 megapascals ~ to evaluate nominal thickness under assembly-equivalent loads.
Unclamped measurements trigger false rejections on compliant cells that have simply relaxed after formation. Pouch cells require non-contact optical profiling or low-force touch probes so inspectors can evaluate seal width and fold geometry without puncturing the delicate aluminum laminate foil.

Incoming Sampling Plan Parameters
Sample sizes and inspection levels depend on supplier tier ratings, historical yield performance, and cell safety criticality. The table below outlines standard C=0 sampling parameters used during dock inspection for high-volume cell shipments.
| Inspection Level | Target Defect Category | AQL Threshold | Sample Size (Lot Size 10k-35k) | Sample Size (Lot Size 35k-150k) | Acceptance Number (c) |
|---|---|---|---|---|---|
| Critical Safety | Internal short circuit, electrolyte leak, vent rupture | 0.010 | 800 | 1250 | 0 |
| Major Electrical | Capacity out of spec, high AC impedance, OCV drift | 0.150 | 200 | 315 | 0 |
| Major Physical | Terminal thread pitch, broad face bulge, height dimension | 0.650 | 80 | 125 | 0 |
| Minor Cosmetic | Tray scratch, jacket scuff, faint barcode printing | 4.000 | 15 | 20 | 0 |
Defect classification dictates inventory disposition whenever a unit fails dock screening. A single critical safety failure triggers lot rejection, quarantine, and an immediate corrective action request to the supplier. A major electrical defect shifts upcoming shipments into tightened inspection protocols, doubling incoming sample sizes until five consecutive lots clear without failure.
Minor packaging flaws will not halt line feeding, but they do generate formal vendor notifications to adjust tertiary packaging controls.
Ocean transit introduces physical stress that dock checks are built to isolate. Extended maritime transport subjects freight to low-frequency vibration between two and fifty hertz. This mechanical resonance can shift internal jelly-roll tape, migrate particulate across separator membranes, or induce fretting corrosion on bare copper and aluminum terminals.
Dock intake protocols include baseline AC impedance checks at one kilohertz to catch contact resistance increases from fretting before cells are welded into modules.
The plant absorbed the financial impact of a full lot rejection when an overseas supplier substituted lower-density tray foam, allowing cells to vibrate against internal cardboard dividers during a three-week ocean transit. The resulting micro-abrasions tore insulating outer sleeves across eight percent of the sample, forcing a complete factory sorting run and generating three weeks of line downtime fees.


Bench
Electrochemical testing on the inspection bench translates microvolt potential drifts into actionable internal cell health metrics. High-precision measurement channels interface with cell terminals through four-wire Kelvin contacts to eliminate lead resistance and thermoelectric EMF errors. Bench characterization centers on self-discharge rates, standardly framed as K-value inspection.
The K-value tracks open-circuit voltage decay over time under managed conditions, acting as the primary non-destructive screen for latent micro-shorts.
Self-discharge in lithium-ion cells proceeds along two separate mechanisms. The first is a continuous, self-passivating reaction between intercalated active material and the liquid electrolyte. This sustains the solid electrolyte interphase (SEI) layer on the graphite anode and produces a predictable, minor decrease in state of charge.
The second mechanism involves parasitic electronic conduction bridging positive and negative electrodes. Metallic contaminants like copper, iron, or zinc introduced during electrode coating or slitting can puncture the separator. These particles or dendritic growths establish localized shorts that accelerate open-circuit voltage decay.

K Value Mathematical Formulation and Relaxation Dynamics
Mathematically, the K-value represents the derivative of open-circuit voltage with respect to time. Quality engineers calculate it by logging open-circuit voltage at two points across an aging window, expressing the value in millivolts per day or microvolts per hour.
K equals the difference between initial open-circuit voltage V-one and final open-circuit voltage V-two, divided by the elapsed aging time delta-t in days: K = (V1 – V2) / (t2 – t1). Precision voltmeters reading to six or seven decimal places shorten the required aging window delta-t while maintaining measurement accuracy.
Freshly manufactured or recently transported cells do not decay linearly at first. Following charge-discharge cycling or temperature excursions, lithium ions inside the active particle matrices exhibit steep concentration gradients. Solid-state diffusion through the transition metal oxide lattice and graphite structure induces marked voltage relaxation, causing open-circuit potential to drop rapidly during the first hours while concentration profiles equilibrate.
Decay slopes stabilize into linear trends only after these internal concentration gradients subside. Calculating K-values during the early relaxation window leads to false rejections, because non-uniform ion distributions produce voltage drops that look identical to high self-discharge. Test protocols therefore establish strict post-formation or post-transit rest periods before recording baseline voltage V-one for formal calculations.

How Long Do Cells Rest before K Value Measurement?
Thermal stability is the single most sensitive variable in bench screening. A cell’s open-circuit voltage carries a pronounced temperature coefficient (dOCV/dT) that shifts with chemistry and state of charge. For nickel-manganese-cobalt (NMC) at fifty percent state of charge, dOCV/dT generally settles between minus 0.10 and minus 0.30 millivolts per degree Celsius.
Lithium iron phosphate (LFP) exhibits broad plateaus where dOCV/dT drops below 0.05 millivolts per degree Celsius across wide operating windows, though sensitivity spikes near full charge.
A temperature shift of two degrees Celsius during screening can inject up to 0.6 millivolts of measurement error. In production test lines where acceptable K-values fall below 0.2 millivolts per day, unmanaged thermal fluctuations corrupt the data. Test benches consequently house cells inside environmental chambers that hold ambient temperatures at twenty-five degrees Celsius within plus or minus 0.1 degree.
Temperature fluctuations of zero-point-two degrees Celsius inside the test enclosure obscure micro-volt level voltage drops, rendering four-day K-value calculations statistically invalid.
Managing contact resistance requires precise mechanical fixtures. Standard spring-loaded pogo pins introduce contact resistances between 5 and 50 milliohms that drift with surface oxidation and mechanical wear. Passing microampere-level sensing currents across that junction produces spurious offset voltages.
Four-wire Kelvin fixtures isolate the current excitation path from the voltage sense lines: excitation pins carry tiny test currents while high-impedance sensing probes connect directly to the cell terminals, keeping loop currents below nanoampere levels.
Chemistry-Specific K Value Screening Criteria
Different cathode and anode pairings yield distinctly different baseline self-discharge characteristics because of their underlying open-circuit potential curves. The table below details operational screening limits, stabilization windows, and temperature sensitivities across major cell chemistries.
| Cell Chemistry | Nominal Testing SOC | Rest Window Post-Transit | Temp Coefficient (dOCV/dT) | Max Allowable K Value | Micro-Short Threshold |
|---|---|---|---|---|---|
| NMC 811 / Graphite | 30% to 50% | 72 Hours | -0.22 mV/°C | 0.15 mV/day | > 0.35 mV/day |
| NMC 622 / Graphite | 30% to 50% | 48 Hours | -0.18 mV/°C | 0.12 mV/day | > 0.28 mV/day |
| LFP / Graphite | 100% (or narrow knee) | 120 Hours | -0.04 mV/°C | 0.25 mV/day | > 0.60 mV/day |
| LFP / Graphite | 30% to 50% (Flat Zone) | 160 Hours | -0.02 mV/°C | 0.08 mV/day | > 0.18 mV/day |
| NMC / Silicon-Anode (10% Si) | 30% to 40% | 96 Hours | -0.35 mV/°C | 0.40 mV/day | > 0.85 mV/day |
LFP cells present specific inspection hurdles due to their flat open-circuit voltage profiles between twenty and ninety percent state of charge. Along this plateau, notable capacity loss generates negligible voltage change. Catching internal micro-shorts in LFP cells during a standard 7-day quarantine requires either positioning measurements near 100 percent state of charge where the slope steepens, or utilizing 7.5-digit digital voltmeters capable of resolving shifts down to 100 nanovolts.
Silicon-composite anodes undergo high irreversible capacity loss and continuous particle breathing during early storage. As the silicon expands and contracts, newly exposed surface areas react with the electrolyte, consuming active lithium to rebuild the SEI. As a result, baseline K-values for silicon-blended anodes run higher than those for graphite baselines.
Rejection thresholds must be calibrated upward for silicon formulations to avoid scrapping cells going through standard electrochemical stabilization.
Automated test rigs employ gold-plated beryllium copper pin tips to avoid galvanic oxidation and maintain stable contact resistance across tens of thousands of cycles. Pneumatic actuators seat the probe heads onto cell terminals under regulated pressure, ensuring consistent electrical contact without marring soft aluminum terminals or fracturing laser welds.
During a contract dispute over a rejected lot of 100 Ah NMC prismatic cells, technical arguments centered on whether observed voltage decay stemmed from test chamber fan vibration inducing capacitive noise across sense lines or from genuine internal micro-shorts.


Ledger
Data analytics turns raw millivolt logs into lot-level pass or fail decisions. Screening large cell shipments requires separating true micro-shorts from normal, benign variations in self-discharge. When plotting K-values across a lot of 50,000 cells, conforming units form a Gaussian distribution centered on the baseline decay rate.
Cells with internal metallic contamination or separator pinholes form an asymmetric tail extending toward higher self-discharge values.
Outlier isolation requires robust statistical filters. Calculating standard arithmetic means and deviations across distributions with heavy tails distorts baseline boundaries, widening control limits and letting defective cells leak into pack assembly. Quality protocols employ Median Absolute Deviation (MAD) or Tukey boxplot models to define robust screening cutoffs.

Statistical Distribution Analysis and Outlier Isolation
Calculating Median Absolute Deviation starts by determining the median across the entire lot dataset. The deviation of each cell measurement from this population median is calculated, and the median of those absolute deviations defines the MAD metric. An acceptable upper control limit sets the maximum allowed K-value at the median plus three times the scaled MAD value (using a 1.4826 normalization factor to align with a normal distribution).
Units above this upper threshold are rejected automatically, regardless of their absolute voltage levels.
Process capability evaluation relies heavily on Cpk indices. The Cpk index tracks how centered the cell lot distribution remains relative to the Upper Specification Limit (USL) stipulated in the supply contract. A Cpk below 1.33 indicates that the cell manufacturer’s formation and aging lines lack process stability, raising field failure risks downstream even if the sample technically clears standard AQL thresholds.
Screening algorithms must distinguish between two distinct defect populations inside high-voltage lots.
- Uniform SEI Degradation units present elevated self-discharge across all voltage ranges due to moisture in the electrolyte, causing continuous lithium salt decomposition without localized heating risk.
- Localized Metallic Micro-Shorts units exhibit sudden steps or non-linear accelerations in K-value over time as metallic dendrites bridge electrode gaps, posing severe thermal runaway hazards during charging.
- External Parasitic Leakage units display apparent self-discharge caused by surface contamination, flux residue, or moisture films bridging cell terminals across outer insulating sleeves.
- Spatial Thermal Gradient Artifacts units generate false high K-values due to placement near edge positions during thermal chamber storage, causing uneven cooling relative to inner pallet positions.
Quarantine duration balances inventory working capital against defect detection probability. Holding incoming cell lots in warehouse quarantine for extended aging windows increases the resolution of K-value screening. Longer rest periods give micro-shorts more time to produce detectable voltage drops, improving quality protection.
However, extended storage consumes floor space, ties up operating capital, and risks missing tight project delivery schedules.

Quarantine Economics and Aging Window Trade-Offs
Optimizing quarantine schedules means balancing statistical detection confidence against landed cell holding costs. Shortening quarantine times requires investing in higher-precision measurement hardware to resolve microvolt differences over shorter intervals.
| Quarantine Window | Required DVM Precision | Minimum Detectable K-Value | Holding Cost per 100k Cells | Defect Capture Reliability |
|---|---|---|---|---|
| 3 Days (72 Hours) | 7.5 Digit (100 nV res) | 0.30 mV/day | $12,500 | 82.5% |
| 7 Days (168 Hours) | 6.5 Digit (1 µV res) | 0.15 mV/day | $28,000 | 94.0% |
| 14 Days (336 Hours) | 6.5 Digit (1 µV res) | 0.08 mV/day | $54,000 | 98.8% |
| 28 Days (672 Hours) | 5.5 Digit (10 µV res) | 0.04 mV/day | $108,000 | 99.9% |
Shortening the quarantine window from fourteen days to three days cuts holding expenses by $41,500 per 100,000 cells. However, that compressed schedule reduces defect capture rates from 98.8 percent to 82.5 percent when running standard 6.5-digit meters. Detecting subtle micro-shorts within a 72-hour window requires moving to 7.5-digit measurement hardware paired with thermal-matrix scanner enclosures.
Scrap modeling accounts for both direct cell cost and downstream module rework penalties. Scrapping an individual cell at incoming dock inspection loses only the landed unit purchase price. If that defective cell gets laser-welded into a potted module, scrap costs scale by an order of magnitude: dissecting or scrapping an entire pack assembly to salvage one failing channel risks collateral damage and burns hours of specialized bench labor.
Advanced intake lines utilize dual-window K-value screening. Incoming cells receive an immediate baseline voltage check at unboxing (K-zero), followed by an accelerated 5-day soak inside a 35 degree Celsius thermal chamber. A second measurement (K-one) is taken upon removal.
The elevated soak temperature accelerates electrochemical kinetics and dendrite migration, widening measurable delta-V spreads. Comparing K-one against K-zero flags latent micro-shorts in five days rather than the twenty-one days demanded by ambient warehouse storage.
Engineers enforce strict rejection thresholds for whole lots based on yield limits. If initial C=0 sampling reveals no critical defects, but secondary screening shows that more than 1.5 percent of the lot falls outside the 3-sigma MAD boundary, the entire shipment is quarantined. Elevated variance across the population signals systemic process instability during cell formation or slitting at the factory.
Quality Supply Agreement Clause 14.3 mandates that if dock screening shows a K-value standard deviation exceeding 0.05 millivolts per day across a shipment, the buyer retains the right to reject the entire lot at the seller’s expense without conducting further single-cell sorting.


Paperwork
Contract documentation sets the legal and technical boundaries between cell manufacturers and battery pack builders. Specific quality criteria written into Master Supply Agreements (MSA) and Quality Supply Agreements (QSA) convert electrochemical metrics into enforceable commercial liabilities. Without explicit dock verification protocols embedded in signed contracts, pack integrators shoulder the full financial exposure for incoming cell defects, quarantine overhead, and factory floor delays.
A factory-generated Certificate of Analysis (COA) must accompany every delivery lot. Completed before container dispatch, the COA records statistical distribution profiles across essential mechanical and electrochemical parameters: nominal capacity spreads, one-kilohertz AC impedance, post-formation room-temperature OCV, and final warehouse-aging K-values.
Dock receiving teams cross-reference COA data against on-site sample logs. Variances between factory reports and dock measurements point to transit shocks, faulty plant grading, or fabricated paperwork. Discrepancies often stem from systematic OCV drift on uncalibrated vendor test benches or shifted K-value spreads caused by dispatching lots before solid-state diffusion reached equilibrium.
Commercial Quality Agreements and Warranty Seams
Warranty seams delineate where the cell supplier’s liability stops and the integrator’s begins. Cell vendors frequently argue that defects found after container unboxing result from downstream handling ~ such as excessive busbar welding heat, terminal over-torquing, or poor storage humidity control. Pack assemblers must maintain complete traceability data to prove defects existed before cells reached the production line.
Detailed claim dossiers assemble the physical and statistical evidence needed to secure vendor credit notes or lot replacements. A complete rejection dossier includes five key technical artifacts.
- Incoming Bay Logistics Logs document continuous temperature, shock, and humidity readings recorded by calibrated data loggers inside the maritime shipping container.
- Calibrated Inspection Bench Logs provide four-wire Kelvin electrical test data linked directly to individual cell matrix barcodes, including raw voltage readings and timestamps.
- Environmental Chamber Traceability Records verify that sample cells rested within specified thermal tolerances (twenty-five degrees Celsius plus or minus 0.1 degree) throughout the measurement window.
- Statistical Population Distributions contrast the rejected lot’s K-value spread against historic conforming baselines using scaled Median Absolute Deviation boxplots.
- Microstructural Failure Analysis Reports present high-resolution Computed Tomography (CT) scans or teardown microscopy proving internal separator punctures or metallic contamination particles.
Custom battery pack development requires Non-Recurring Engineering (NRE) allocation for dedicated inspection tooling. High-density pogo fixtures, automated optical gantry scanners, and climate-controlled staging racks represent substantial upfront capital. MSA exhibits establish whether the buyer or supplier retains ownership of these test assets and define the depreciation schedule across delivery milestones.

Incoming Quality Audit Verification Checklist
Standardizing the lot clearance workflow protects manufacturing operations from unverified inputs. Operational audit checklists guide quality engineers through systematic checks before releasing inventory to the production floor.
- Document Compliance matches physical pallet serial numbers against the factory Certificate of Analysis and verifies UN 38.3 transport safety signatures.
- Environmental Verification downloads container transit logger data and flags thermal excursions exceeding forty-five degrees Celsius or drops below zero degrees Celsius.
- Physical Packaging Integrity inspects vacuum packaging tightness on pouch formats and checks pallet shock indicators for impacts exceeding twenty Gs.
- Zero-Acceptance Mechanical Screening executes dimensional and vent integrity checks on the calculated C=0 sample size without allowing a single non-conformance.
- Baseline Electrical Screening records open-circuit voltage and one-kilohertz AC impedance across Kelvin test channels to confirm compliance with factory grading tiers.
- Statistical K-Value Screening evaluates voltage decay across the designated quarantine rest window and isolates population outliers via Median Absolute Deviation calculations.
- ERP Clearance Sign-off uploads verified test datasets to the enterprise resource planning system to transition the lot status from quarantine hold to released assembly inventory.
Traceability architecture ties individual cell inspection logs directly to finished pack serial numbers. Data-matrix codes laser-etched onto cell casings or terminal lugs contain encrypted strings identifying the manufacturing facility, coating line, electrode batch, and formation tray position. Scanning these matrix codes at the receiving bench writes dock OCV, AC impedance, and K-value measurements to that specific cell record in the database.
Downstream production lines scan the barcodes again during pack stacking and busbar joining. If a pack fails final end-of-line testing or encounters field issues, engineers pull the trace record to review incoming inspection data. Access to initial K-values and dock metrics quickly reveals whether the failure traces to an incoming cell defect or an assembly error on the line.
Supply agreements must establish formal disposition procedures for non-conforming lots. Returning rejected cells across international borders entails complex dangerous-goods compliance, customs filings, and high freight costs. Standard QSAs mandate that once dossier evidence confirms a lot failure, the supplier must credit the buyer within thirty days and either arrange international return freight or cover certified local recycling and disposal.
Clear documentation protocols ensure that quality control boundaries remain enforceable across international supply chains.