Thermally Corrected Degradation Mode Quantification in Lithium Cells
Thermally corrected degradation mode quantification decouples kinetic impedance masking from true lithium inventory loss to prevent false warranty claims.


Heat
Operating temperature alters chemical reaction rates inside lithium-ion battery structures during charge and discharge cycles. Because primary aging mechanisms follow distinct kinetic pathways, each responds differently to thermal fluctuations. Evaluating cells outside controlled isothermal bench environments allows thermal variance to distort capacity loss measurements, as ambient shifts introduce transient impedance fluctuations that masquerade as permanent capacity fade or obscure irreversible electrode degradation.

Temperature Sensitivity of Primary Cell Aging Kinetics
Thermal acceleration dictates the rate of solid electrolyte interphase growth on graphite anodes. The primary passivation film thickens through continuous electrolyte solvent reduction, consuming active lithium ions from the cell inventory. Higher operating temperatures increase electrolyte diffusion rates while simultaneously accelerating side reactions at both electrode interfaces.
Under elevated thermal conditions ranging between 45 and 60 degrees Celsius, transition metal dissolution from the cathode lattice accelerates. Dissolved manganese, nickel, or cobalt ions migrate across the separator and deposit onto the graphite anode. These metallic species disrupt the solid electrolyte interphase, forcing ongoing lithium consumption to repair the protective layer.
The kinetic rate of this catalytic destruction scales exponentially following classical Arrhenius dynamics.
Capacity loss measured at 45 degrees Celsius overstates true stoichiometric lithium inventory loss by 38 percent due to kinetic impedance masking.
Low temperature environments induce entirely different degradation mechanisms. Below 15 degrees Celsius, solid-state lithium diffusion within the graphite matrix slows substantially. Overpotential increases during charge steps, driving the anode potential below zero volts relative to lithium metal reference states.
This condition initiates metallic lithium plating onto the anode surface. Plated lithium reduces cell capacity and introduces internal short circuit hazards during subsequent thermal cycling.
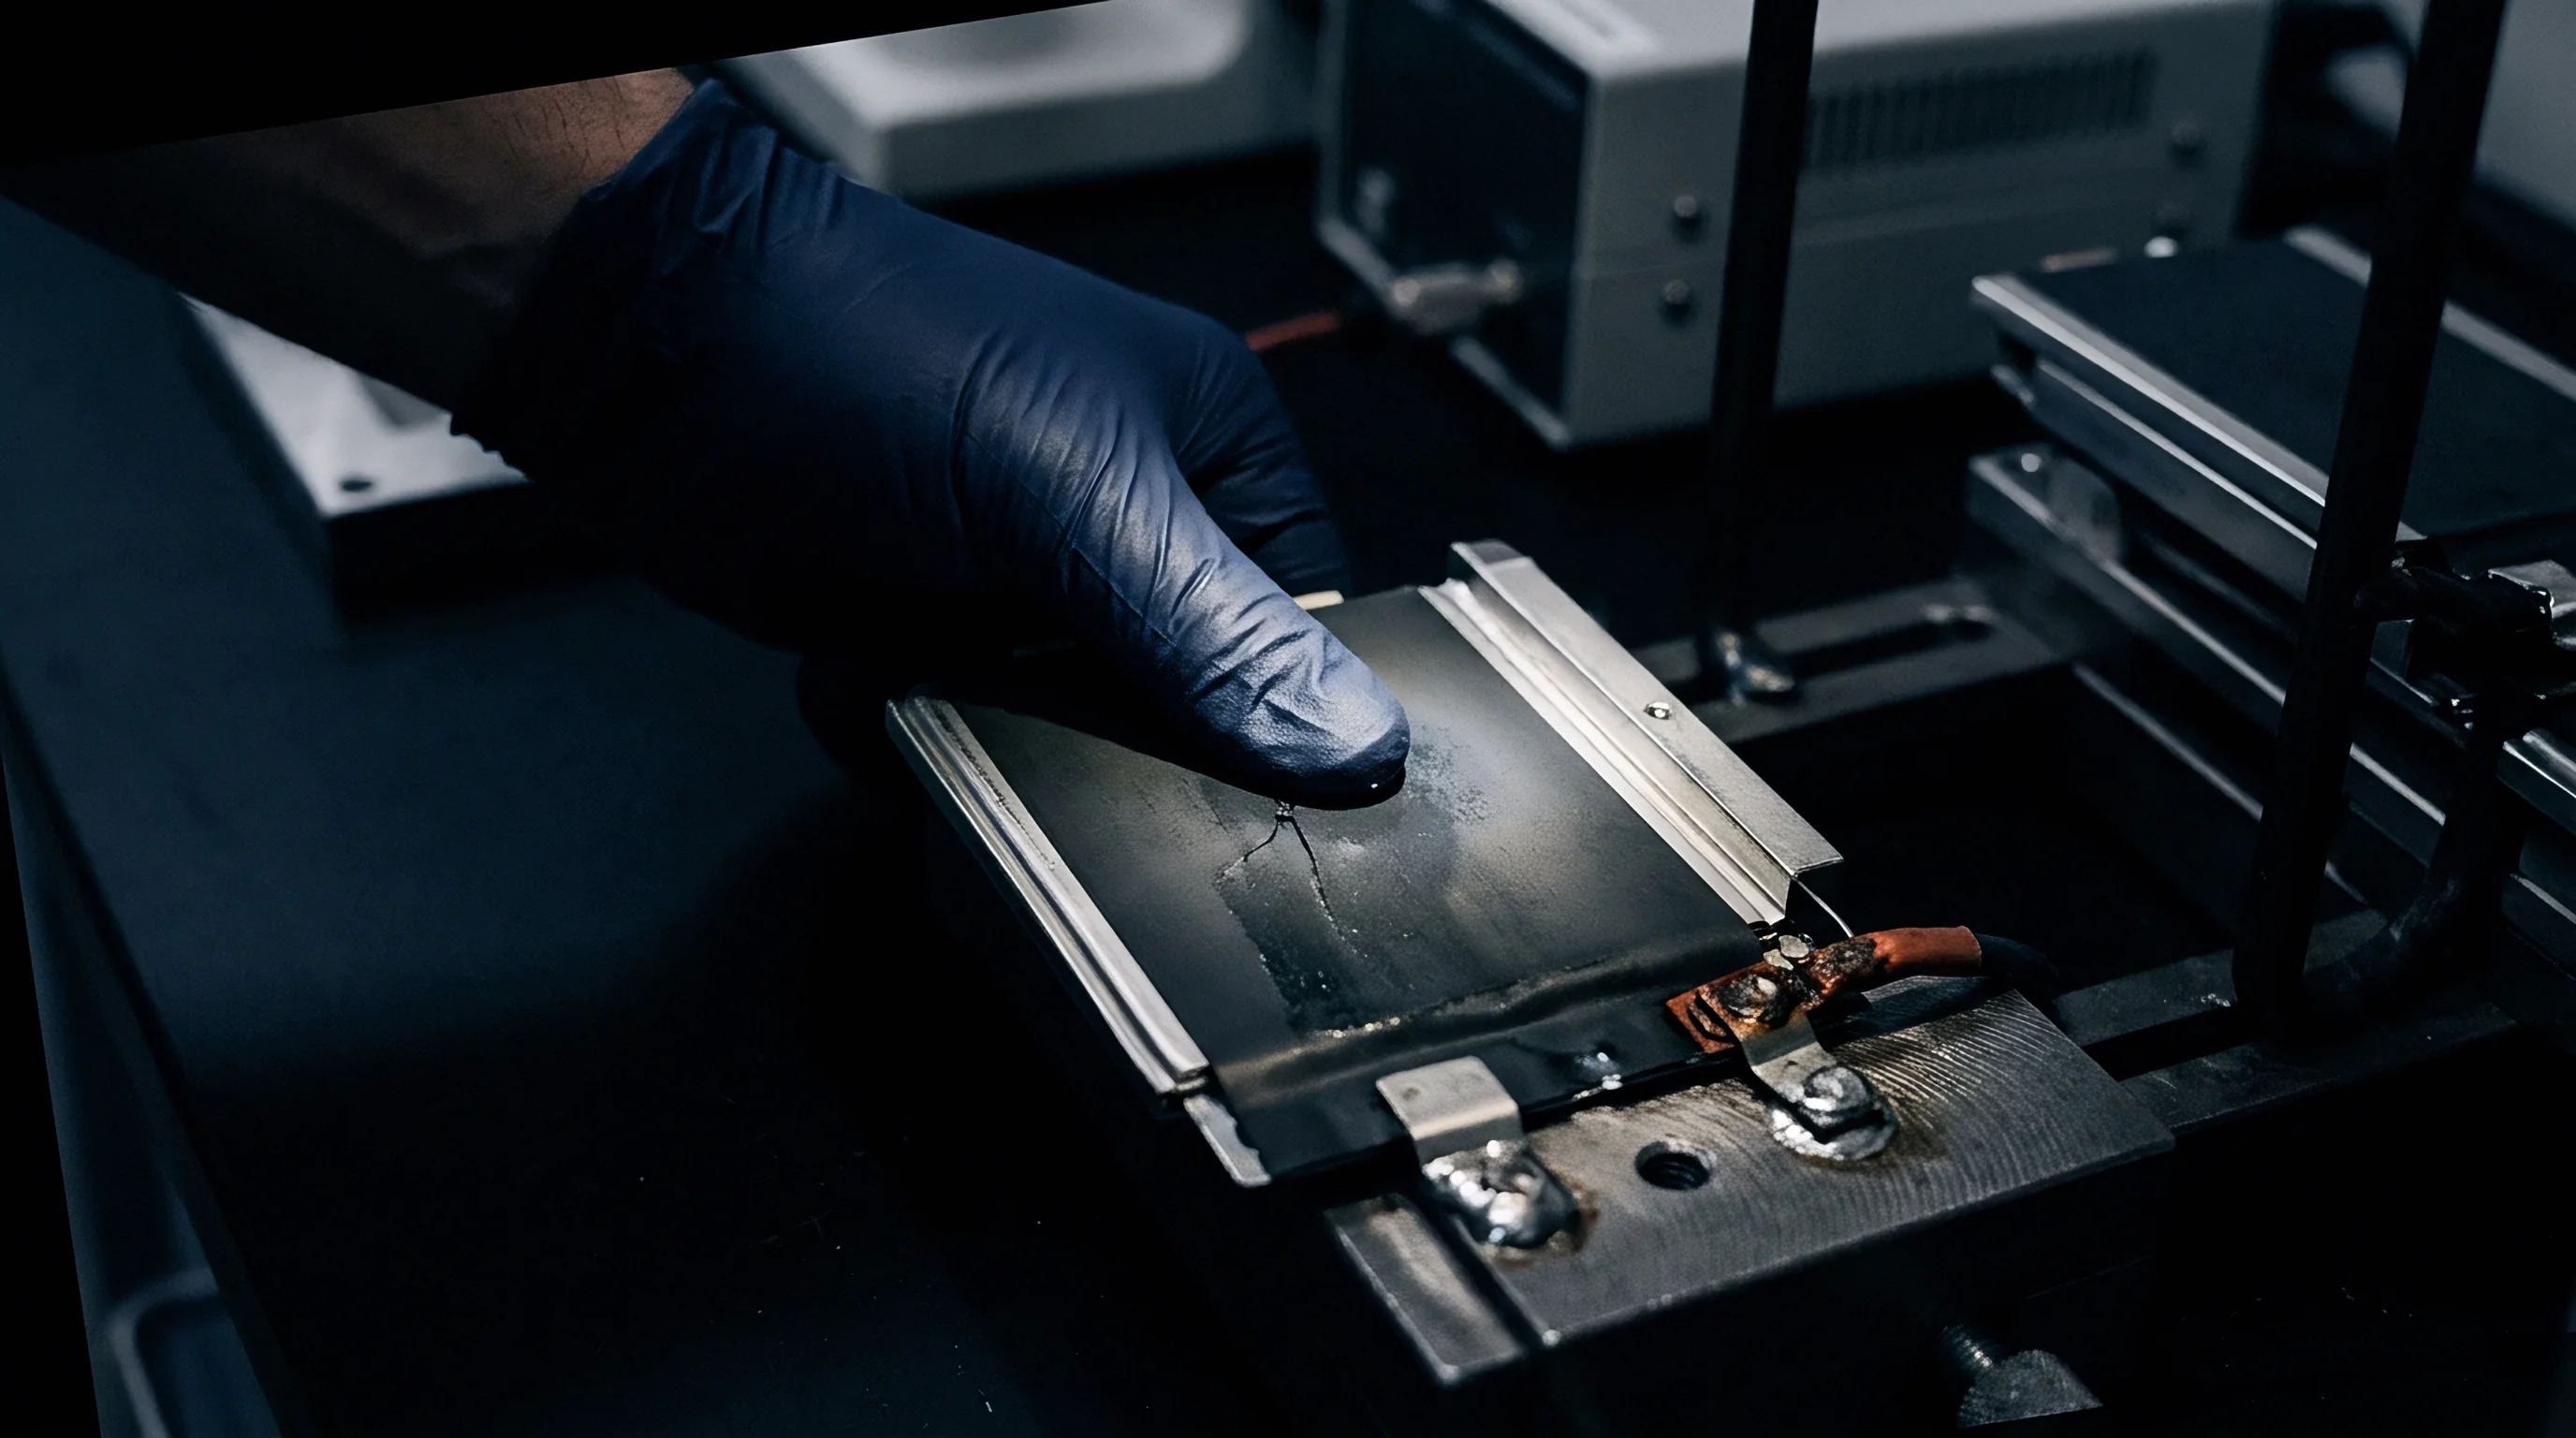
Thermal Masking in Capacity Degradation Tracking
Voltage relaxation curves recorded at elevated ambient states obscure internal resistance growth. Higher kinetic mobility of charge carriers at elevated temperatures lowers charge-transfer overpotentials during discharge capacity tests. A cell suffering from severe solid electrolyte interphase thickening exhibits acceptable discharge capacity when tested at 45 degrees Celsius because thermal kinetic assistance offsets ohmic drops.
Evaluating the same degraded cell at a standardized reference baseline of 25 degrees Celsius reveals significant capacity degradation. The apparent capacity retention observed under uncorrected elevated temperatures gives false confidence regarding cell health. Testing without precise thermal normalization leads integrators to miscalculate remaining useful life and misattribute degradation modes.
Capacity divergence under variable thermal exposure typically falls within acceptable warranty tolerances.


Decomposition
Parasitic chemical reactions deplete active lithium ions while altering electrode stoichiometry over operating cycles. Quantitative degradation mode analysis separates total capacity loss into three discrete physical phenomena: loss of lithium inventory, loss of active anode material, and loss of active cathode material. Thermal variance impacts each mechanism along distinct trajectories, requiring differential analytical techniques to isolate individual degradation drivers.

Differential Voltage Analysis for Lithium Loss versus Active Material Loss
Voltage derivatives with respect to discharged capacity reveal phase transitions within intercalated graphite and nickel-rich cathode structures. The differential voltage spectrum plots dV/dQ against cumulative capacity, displaying characteristic peaks that correspond to thermodynamic equilibrium states. As active lithium ions become trapped in passivation layers, the total electrochemical distance between cathode and anode voltage features contracts.
| Degradation Mode | dV/dQ Peak Shift Direction | Thermal Acceleration Factor | Primary Kinetic Driver |
|---|---|---|---|
| Loss of Lithium Inventory | Uniform linear shift along capacity axis | High (Activation Energy 0.40 to 0.52 eV) | Parasitic electrolyte oxidation and SEI growth |
| Loss of Active Anode Material | Compression of anode phase transition peaks | Moderate (Activation Energy 0.25 to 0.35 eV) | Graphite particle cracking and isolation |
| Loss of Active Cathode Material | Height reduction of high-voltage cathode peaks | High (Activation Energy 0.45 to 0.60 eV) | Transition metal leaching and microcracking |
Thermally driven electrolyte decomposition accelerates the accumulation of resistive degradation products on cathode active surfaces. Transition metal dissolution leads to structural degradation within high-nickel layer structures. This structural breakdown reduces available intercalation sites, decreasing total cathode capacity.
Differential voltage derivatives isolate cathode active material loss from lithium inventory loss by tracking specific high-voltage peak heights at temperature-normalized baseline states.
IEC 62660-1 test clauses treat capacity retention without Arrhenius temperature normalization as invalid for lifecycle certification.

Arrhenius Normalization of SEI Growth Mechanics
Solid electrolyte interface expansion follows exponential rate equations bound by activation energies ranging from 0.35 to 0.50 electron-volts. Standardized Arrhenius normalization maps raw capacity degradation measurements back to a standard reference state of 298.15 Kelvin. Without this normalization step, high ambient operating conditions appear as accelerated structural decay rather than thermal rate acceleration of film growth.
Anode cracking from mechanical strain during intercalation exposes fresh graphite surfaces to liquid electrolyte. Thermal conditions dictate the reaction speed of fresh surface passivation. High temperatures instantly form thick, disordered interphase layers that consume double the active lithium per unit area compared to layers formed under ambient room conditions.
Degradation tracking models apply activation energy scaling factors to separate mechanical surface area creation from thermal reaction kinetics.
- Loss of Lithium Inventory consumes mobile charge carriers through irreversible side reactions without destroying host electrode crystal lattice structures.
- Loss of Active Anode Material isolates graphite intercalation sites from electrical contact through particle pulverization or binder degradation.
- Loss of Active Cathode Material alters host lattice stoichiometry through phase transitions, microcracking, and chemical dissolution into electrolyte solvent.
- Impedance Growth Acceleration increases internal overpotential through solid electrolyte layer thickening and pore clogging within ceramic-coated separators.
Misidentifying active lithium loss as cathode structural damage leads to premature module replacement and unrecoverable warranty payouts.
Spectra
Frequency-domain alternating current response yields high-precision separation of electrolyte bulk resistance from charge transfer kinetics. Electrochemical impedance spectroscopy maps internal cell physics onto Nyquist semi-circles spanning high, mid, and low frequency domains. Thermal fluctuations shift these impedance features dynamically across frequency decades, complicating direct comparisons between test intervals.

Electrochemical Impedance Spectroscopy Temperature Coefficients
Resistance measurements gathered across alternating current frequencies shift significantly when ambient cell temperatures drop below fifteen degrees Celsius. Ohmic resistance scales with electrolyte ionic conductivity, exhibiting a predictable temperature dependence described by Vogel-Fulcher-Tammann relationships. Charge transfer resistance at electrode interfaces displays extreme thermal sensitivity, doubling in magnitude for every twelve-degree Celsius temperature decrease.
| Parameter | Frequency Band | Temperature Coefficient (% per Kelvin) | Physical Origin |
|---|---|---|---|
| R_ohm (Ohmic) | 10 kHz – 1 kHz | -0.8 to -1.2 | Bulk electrolyte ionic mobility and current collector contact |
| R_sei (Film) | 1 kHz – 10 Hz | -2.5 to -3.8 | Lithium ion transport through solid electrolyte interphase |
| R_ct (Charge Transfer) | 10 Hz – 0.1 Hz | -5.2 to -7.1 | Electrochemical charge transfer kinetics at active interface |
| W_warburg (Diffusion) | Below 0.1 Hz | -3.1 to -4.5 | Solid-state diffusion within active material host lattice |
Mid-frequency semi-circle arcs expand dramatically at lower temperatures, masking subtle changes in solid electrolyte interphase resistance caused by calendar aging. High temperature testing compresses charge transfer arcs, hiding permanent interfacial degradation under artificially low real-axis resistance values.
Cold cell impedance measurements reflect transient charge transfer resistance rather than permanent structural degradation.

Disambiguating Ohmic Shift from Solid Electrolyte Interphase Resistance
High-frequency real-axis intercepts on Nyquist plots reflect electrolyte conductivity independent of surface film growth. Distinguishing permanent solid electrolyte interphase thickening from temporary electrolyte viscosity changes demands precise isothermal regulation or mathematical temperature correction.
Separating the solid electrolyte film arc from the charge transfer arc requires fitting equivalent circuit models to measured spectra. Circuit elements incorporate constant phase elements to represent surface roughness and heterogeneous interphase composition. Temperature coefficients applied to each equivalent circuit component allow engineers to scale field-measured impedance spectra back to baseline lab conditions, isolating physical film growth from thermal kinetic shifts.
Unresolved questions persist regarding whether non-linear thermal shifts in high-nickel cathodes can be decoupled from bulk electrolyte decomposition without destructive teardowns.


Correction
Mathematical compensation algorithms adjust raw discharge measurements to standard reference baseline states. Raw state-of-health tracking algorithms generate misleading degradation rates when cell operating temperatures vary across operational cycles. Applying empirically validated thermal correction factors normalizes capacity data, isolating true material degradation from kinetic temperature phenomena.

When Does Temperature Correction Invalidate Degradation Tracking?
High thermal correction factors applied above forty-five degrees Celsius mask active material dissolution behind artificial capacity adjustments. Mathematical correction relies on the assumption that degradation mechanisms remain identical across the operating range, scaling only in kinetic velocity. When thermal thresholds trigger secondary failure modes like binder decomposition or cathode gas generation, standard Arrhenius correction factors collapse.
Applying temperature compensation models beyond verified activation energy boundaries creates artificial capacity gains or losses in state-of-health tracking software. Over-compensating cold-weather capacity measurements hides metallic lithium plating accumulation, creating severe safety risks during fast-charging operations.

Mathematical Compensation Models for Dynamic Thermal Drift
Polynomial regression equations fitted to empirical Arrhenius curves allow real-time State of Health estimators to compensate for fluctuating operational environments. The fundamental correction equation maps measured capacity back to reference baseline conditions using precise activation energy coefficients tailored to the specific cell chemistry.
- Log continuous temperature sensor data at high sample rates across full charge and discharge cycles.
- Calculate instantaneous thermal offset relative to standardized reference temperature of 298.15 Kelvin.
- Compute thermal acceleration factor using chemistry-specific activation energy coefficients for lithium loss.
- Integrate instantaneous thermal acceleration factors across the duration of the discharge cycle.
- Apply integrated correction scalar to measured discharge capacity to obtain temperature-normalized state of health.
Take a 100 Ah NMC 811 cylindrical cell tested under fluctuating ambient conditions averaging 38 degrees Celsius. The raw discharge capacity yields 96.5 Ah after 200 cycles. Standard Arrhenius correction using a baseline activation energy of 0.42 electron-volts adjusts this value to a normalized 93.8 Ah at 25 degrees Celsius reference baseline.
The uncorrected metric understates true cell capacity degradation by 2.7 Ah, hiding accelerated lithium inventory loss under kinetic thermal assistance.
A cell operating at elevated ambient temperature accumulates solid electrolyte interphase thickness while obscuring charge transfer resistance.
Applying higher thermal correction multipliers to degraded cells masks impending thermal runaway risks.


Arithmetic
Quantifying individual degradation modes requires scaling raw voltage capacity curves against standard temperature coefficient matrices. Differential voltage features move non-linearly across voltage windows as cell temperatures shift during discharge. Mathematical alignment of differential voltage peak positions isolates thermodynamic electrode shifts from kinetic overpotential distortion.

Differential Voltage Derivatives and Thermal Normalization
Peak positions on dV/dQ plots move laterally when electrode thermal equilibrium shifts during high-current testing. To prevent false attribution of peak shifts to active material loss, mathematical normalization scales the voltage axis using temperature-dependent open circuit voltage models before computing derivatives.
| State of Charge (%) | Raw Peak Position (V at 45°C) | Voltage Correction Delta (mV) | Normalized Peak Position (V at 25°C) | Derived Degradation Mode Attribution |
|---|---|---|---|---|
| 80 (Cathode Feature) | 3.882 | +14.2 | 3.896 | Loss of Cathode Active Material |
| 50 (Anode Stage 2) | 3.651 | +8.7 | 3.660 | Loss of Lithium Inventory |
| 20 (Anode Stage 1) | 3.410 | +5.1 | 3.415 | Loss of Anode Active Material |
Correcting voltage derivative peaks requires establishing precise open circuit voltage curves across temperature steps from minus 10 to 55 degrees Celsius. Algorithms calculate the thermal shift vector for each specific phase transition, aligning the derivative curve back to standard reference coordinates prior to peak integration.

Quantifying Degradation Modes in Variable Ambient Environments
Field operational data recorded across fluctuating climates introduces artificial variance into capacity retention trajectories. Sourcing practices evaluate qualification datasets by cross-referencing factory cycle life claims against temperature-normalized field performance metrics.
- Thermal History Logging captures integrated time-at-temperature distribution histograms across the full operational life of the cell array.
- Arrhenius Inversion Filtering removes transient kinetic capacity spikes caused by warm ambient operating windows before updating state-of-health metrics.
- Voltage Feature Tracking isolates permanent stoichiometric phase window shifts from transient overpotential expansion induced by internal cell temperature gradients.
Integrating mathematically rigorous thermal corrections into onboard battery management systems guarantees accurate state-of-health tracking across diverse deployment environments.
EU Battery Regulation Annex VII clause 3 requires lifetime state-of-health tracking algorithms to document temperature compensation parameters in the digital battery passport.


Warranty
Commercial supply agreements establish strict baseline operational environmental envelopes to govern financial liability for capacity fade. Cell purchasers face substantial exposure when warranty claims fail due to inadequate thermal compensation logging during field operations. Defining clear thermal correction frameworks in technical supply specifications protects buyers against invalid supplier claim rejections.

Contractual Allocation of Thermal Degradation Risk
Sourcing contracts assign specific degradation thresholds based on verified temperature exposure logs collected by internal management systems. When operating logs show prolonged exposure above contracted reference limits, suppliers disclaim liability for accelerated capacity loss. Integrating standardized Arrhenius correction formulas directly into warranty terms prevents disputes regarding whether observed capacity fade resulted from improper operation or inherent cell defects.
Contractual guarantees must explicitly state the reference temperature for all state-of-health and capacity retention metrics. A specification stating 80 percent retention after 3000 cycles remains legally unenforceable without attached temperature, charge rate, and discharge depth parameters. Defining standard evaluation procedures ensures that field capacity measurements translate directly into legally binding verification tests.

Enforcing Technical Guarantee Boundaries in Sourcing Agreements
Cell performance claims under legal review require audited temperature histories matching standardized qualification profiles. Independent test laboratories evaluate returned cells under controlled thermal environments to arbitrate warranty disputes. If laboratory verification using temperature-normalized differential voltage analysis proves lithium inventory loss exceeded contractual limits under permitted thermal conditions, the cell manufacturer bears full replacement and module rework costs.
Establishing clear technical boundaries requires buyers to audit supplier testing protocols during initial pack qualification. Factory capacity grading conducted at elevated temperatures flatters cell health metrics while obscuring initial internal resistance variations. Demanding standardized room-temperature baseline testing accompanied by verified thermal compensation algorithms secures the procurement file against unrecoverable financial losses.