Quantifying Structural Thermal Degradation Seams across Contract Manufacturing Responsibilities in Custom Energy Storage Packs
Structural thermal seams form when differential thermal expansion degrades interface media, shifting pack warranty claims between cell vendors and contract assemblers.


Joint
Custom battery enclosures rely on structural bonds to maintain mechanical integrity while conducting peak heat loads away from lithium-ion pouch, prismatic, or cylindrical cells. Operating an energy storage system across wide ambient temperature swings and aggressive C-rate charge cycles creates differential thermal expansion, generating shear forces across every bonded interface. The physical boundary where cell surfaces, thermal interface materials, structural adhesives, cold plates, and busbars meet is often the primary location for long-term mechanical breakdown.
Contract manufacturers assemble these multi-material stacks according to customer-supplied engineering drawings, but the long-term integrity of these thermal pathways depends heavily on process parameters controlled on the factory floor.
A structural thermal degradation seam develops when cyclic mechanical strain causes localized delamination, micro-cracking, or void growth within thermal interface materials or adhesive bonds. This localized mechanical separation acts as a thermal barrier, choking heat dissipation from adjacent cells. Cells situated near a degraded seam run hotter than surrounding cells in the same module, driving accelerated electrochemistry, rapid capacity fade, and impedance growth.

Thermal Mechanical Interfaces in Custom Enclosures
Structural adhesion inside a pack serves dual roles: transferring mechanical loads during vibration and thermal expansion, and providing low thermal resistance pathing to heat sinks. In custom pack geometries where volumetric energy density is tightly constrained, engineers often eliminate traditional mechanical clamping hardware in favor of structural adhesives loaded with conductive ceramic fillers such as aluminum oxide or boron nitride. These filled chemistries exhibit distinct mechanical properties compared to neat resins.
Polymer chains filled with inorganic particulates show elevated bulk thermal conductivity, typically ranging between 1.5 and 3.5 W/m K, but experience reduced strain-to-failure limits and increased brittle behavior under cyclic mechanical loading.
Thermal fatigue in filled adhesives originates from coefficient of thermal expansion mismatch between aluminum or copper cell casings and polymer matrices. Aluminum expands at approximately 23 ppm/K, whereas unreinforced polyurethane or epoxy matrices expand at 50 to 100 ppm/K. During rapid charge and discharge cycles, localized heat generation elevates cell casing temperatures relative to structural frame elements. The resulting thermal expansion differential subjects the adhesive bond line to sustained lap shear strain.
Over thousands of operational hours, this repeated cycling initiates micro-fissures along the interface between the conductive filler particles and the polymer base. These micro-fissures coalesce into continuous delamination planes, elevating bulk thermal impedance across the interface.
Boundaries of Assembly Compliance
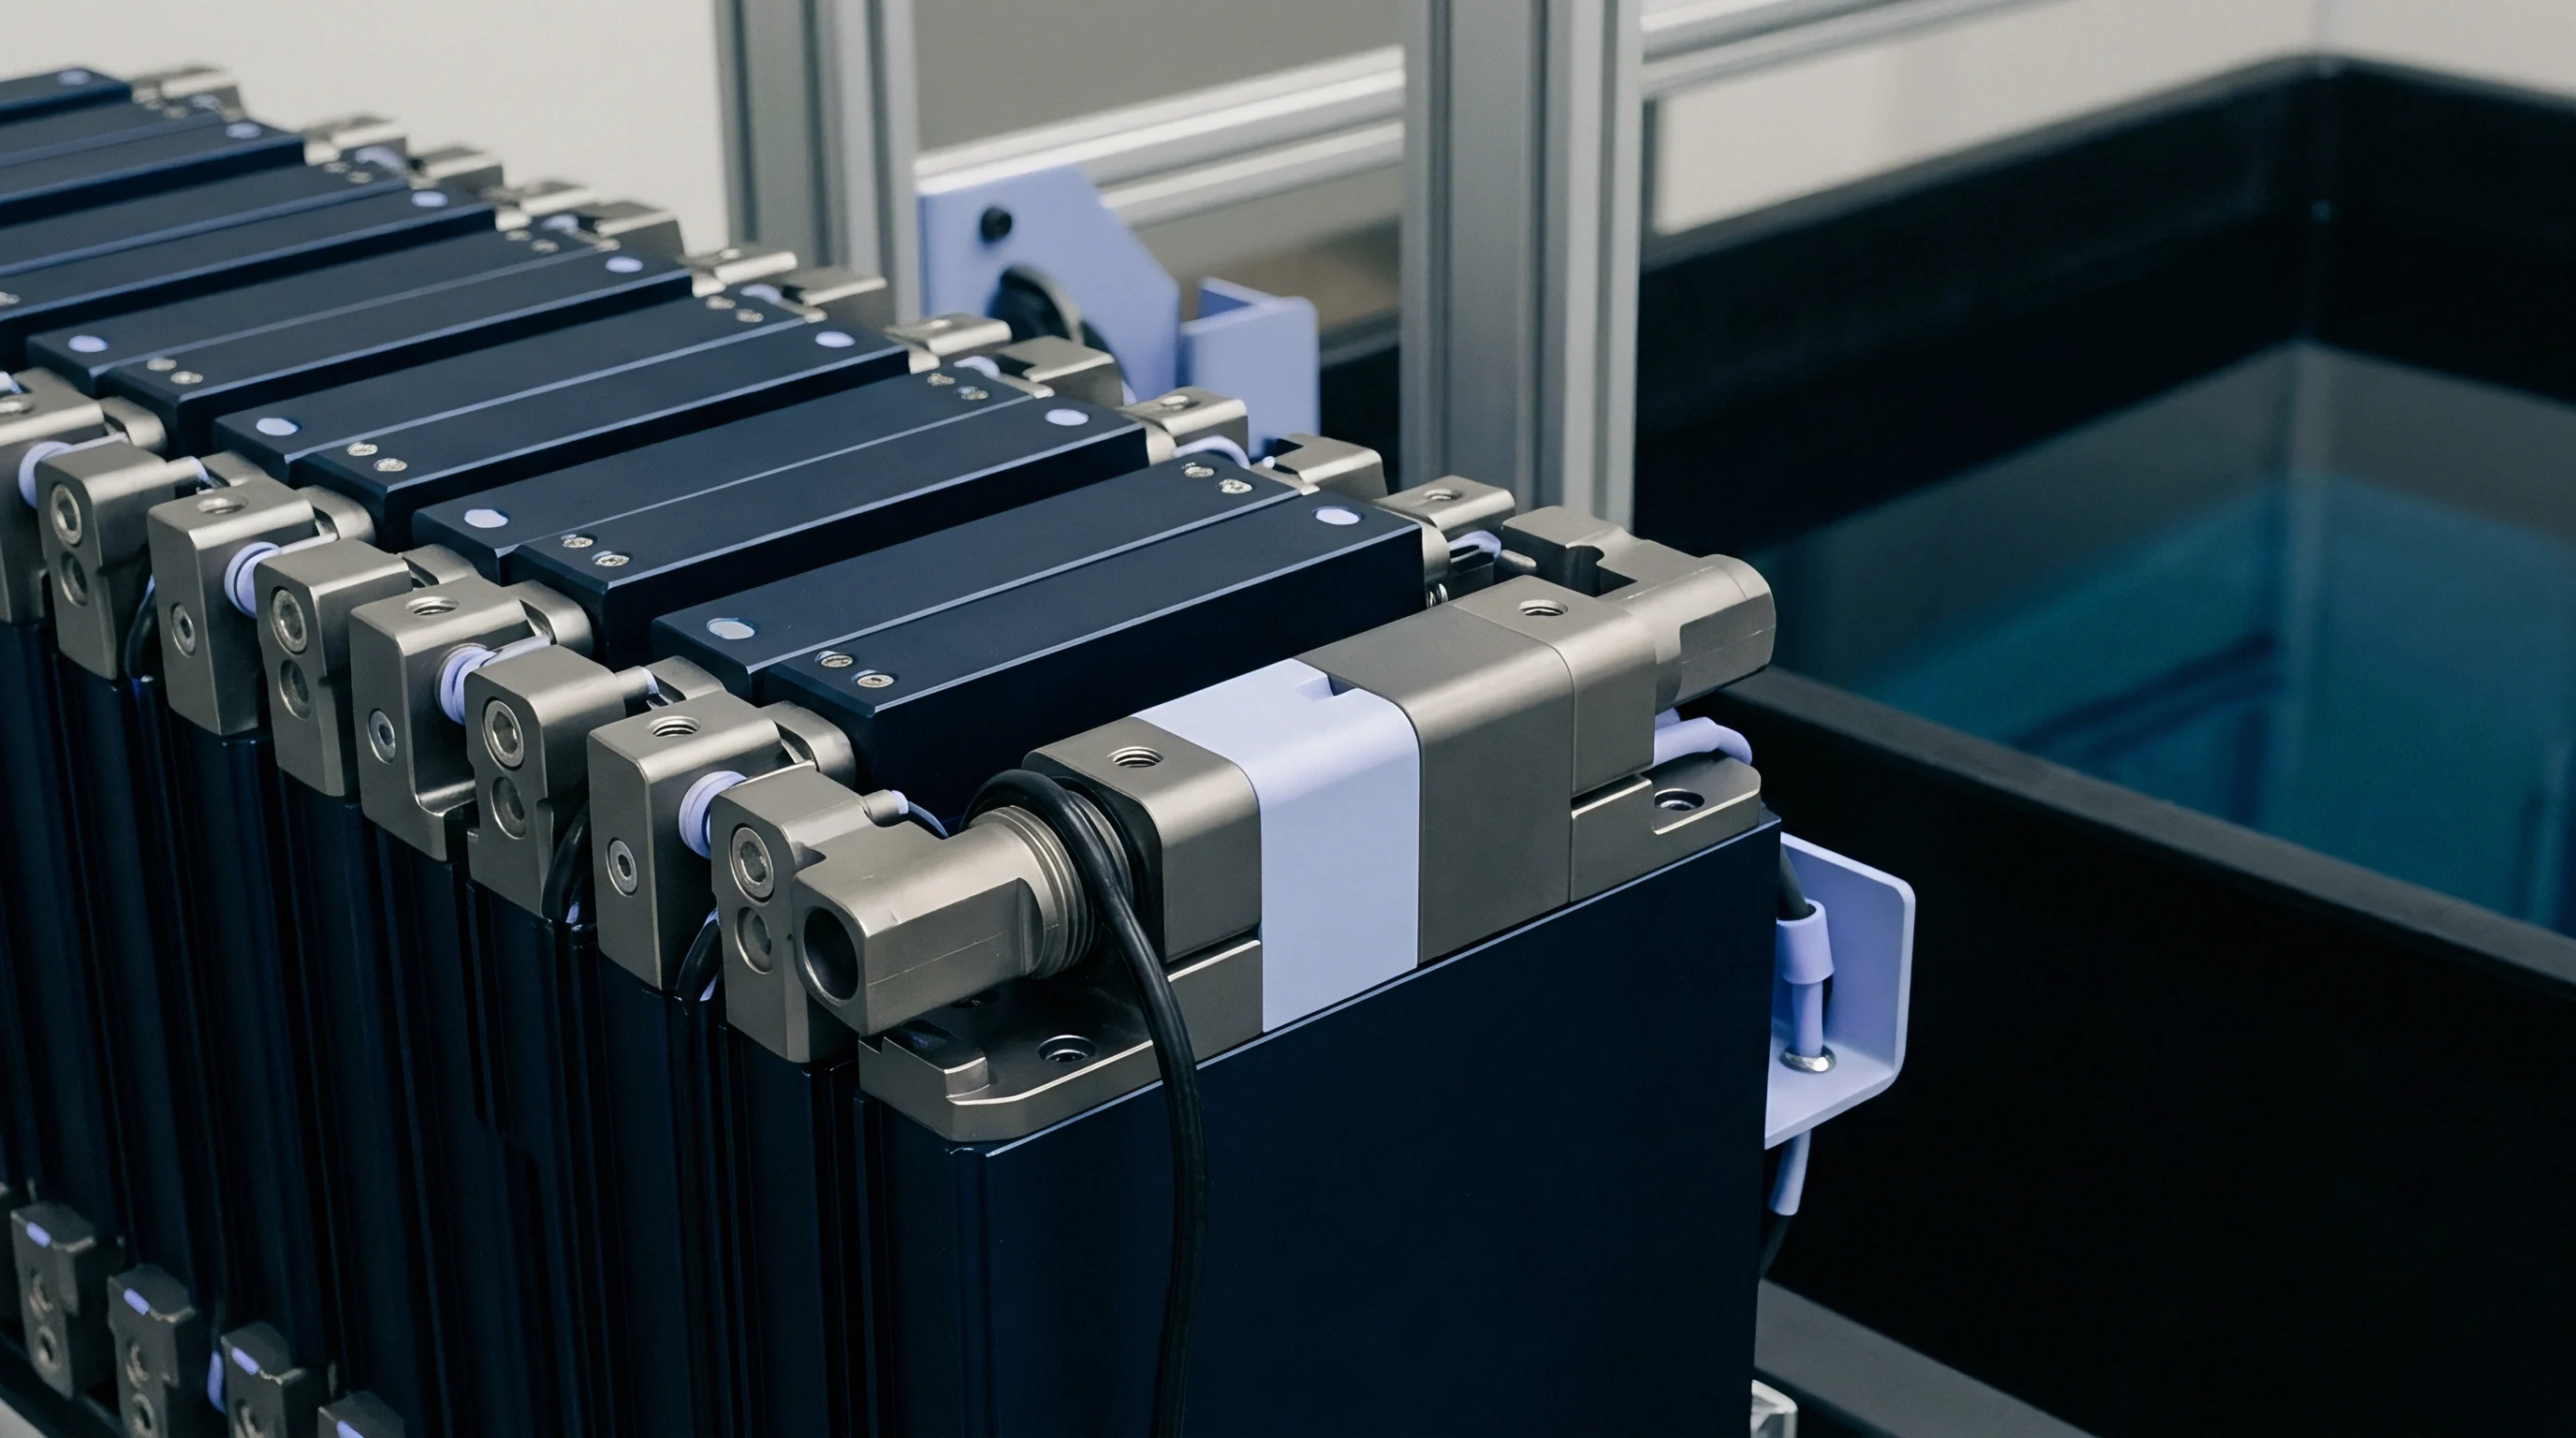
Contract manufacturing agreements frequently separate design authority from process execution authority. The design integrator provides the bill of materials, dimensional tolerances, curing profiles, and surface preparation specifications. The contract manufacturer executes surface pre-treatment, adhesive dispensing, cell stacking, compression fixture clamping, and curing line operations.
A common structural seam issue occurs during adhesive dispensing and curing. Minor variations in surface energy, substrate contamination, plasma treatment power, or dispensing head speed alter the bond line thickness and contact wet-out area.
If a contract assembler permits a 150-micrometer variation in thermal adhesive bond line thickness across a 12-cell module array, thermal resistance varies proportionally across the stack. Thicker adhesive sections present higher resistance to heat flow, raising local operating cell temperatures. Under thermal cycling, regions with higher bond line thickness experience higher absolute shear displacement, accelerating interface cracking.
The design integrator attributes the resulting thermal imbalance to poor process control on the assembly line, while the contract manufacturer contends that the specified mechanical tolerances and adhesive viscosity parameters inherently produce such bond line variations.
Physical separation along structural bond lines acts as a thermal barrier that converts uniform heat dissipation into localized hot spots.
When custom packs undergo design qualification, initial thermal performance testing rarely exposes latent interfacial delamination. Short-term thermal testing verifies nominal heat transfer rates across freshly cured interfaces. Thermal degradation seams appear only after cyclic mechanical and thermal stress accumulates over hundreds of operating cycles.
The contract manufacturer asserts that meeting initial drawing dimensions, curing schedules, and end-of-line flash testing fulfills their contractual obligation, framing subsequent interface cracking as an unavoidable consequence of underlying thermal design choices.


Flux
Dynamic heat generation during 3C discharge pulses creates transient thermal gradients across individual module stacks. Heat generation within lithium-ion cells stems from internal ohmic resistance and entropic changes inside electrode materials. In high-power storage applications, heat flux through cell sidewalls reaches peak values exceeding 15,000 W/m2.
Removing this thermal energy requires low thermal impedance interfaces from cell surfaces to liquid cooling plates. Any physical separation or voiding across the heat transfer interface increases interfacial thermal resistance, causing cell core temperatures to surge during rapid discharge events.
Interfacial thermal resistance measures the temperature drop across a boundary per unit of applied heat flux, expressed in K cm2/W or K/W. A pristine thermal interface layer with a bond line thickness of 0.2 millimeters and a bulk thermal conductivity of 2.0 W/m K provides a theoretical thermal resistance of 1.0 K cm2/W. If micro-cracking, void formation, or mechanical separation introduces a 0.02-millimeter air gap across 20 percent of the contact surface, local thermal resistance rises exponentially because the thermal conductivity of still air is only 0.026 W/m K. This steep resistance rise alters internal heat flow paths, directing heat flux through remaining intact bond regions and generating extreme localized thermal gradients.

Thermal Resistance Creep across Interface Media
Interfacial degradation behaves as a dynamic process driven by cyclic thermal expansion, chemical aging, and mechanical stress relaxation. Evaluating interfacial thermal resistance relies on pulsed transient plane source measurements under varied clamping forces. Silicones, polyurethanes, epoxies, and acrylics exhibit distinct degradation modes when subjected to sustained temperature cycling between -40 deg C and 85 deg C.
Silicone-based thermal gap fillers display liquid separation and oil bleed under cyclic pressure. Siloxane polymer chains migrate out of the filled matrix, reducing wet-out contact with metal substrates. Polyurethane adhesives resist oil bleed but suffer from hydrolytic degradation when exposed to moisture in non-hermetically sealed pack enclosures.
Epoxies offer excellent mechanical strength and high resistance to chemical aging, but their high elastic modulus prevents them from absorbing differential expansion strain, causing brittle interface fracturing under thermal shock conditions. Silicone-free acrylic gap fillers maintain mechanical stability across thermal cycles but exhibit significant compression set and stress relaxation, leading to contact pressure loss over long operating lifetimes.

Degradation Modes in Cell Bonding Layers
The progression of thermal interface degradation follows repeatable physical mechanisms that alter mechanical and thermal conductivity properties simultaneously. Tracking these mechanisms requires analyzing shear modulus shifts, void growth kinetics, and interface contact loss under accelerated aging conditions.
Structural thermal degradation mechanisms span across multiple failure categories depending on material formulation, dispensing accuracy, and operational stress levels.
- Interfacial Delamination occurs when mechanical strain exceeds the adhesive bond strength between the thermal compound and the substrate surface, resulting in complete planform separation and localized thermal isolation.
- Cohesive Shear Cracking develops inside the bulk matrix of high-modulus structural adhesives when differential thermal expansion imposes shear forces greater than the material ultimate tensile limit.
- Pump-Out and Migration affects low-modulus non-curing thermal pastes and liquid gap fillers, where repeated expansion and contraction cycles force material laterally out of the contact zone.
- Matrix Micro-Voiding forms as occluded volatile compounds or trapped air bubbles expand and coalesce during thermal cycling, creating internal insulating pockets within the conductive layer.
- Fill-Settling and Particle Agglomeration occurs in low-viscosity or improperly cured formulations, where ceramic filler particles drop out of suspension, leading to non-uniform thermal pathways.
Quantifying these degradation modes requires comparing baseline thermal impedance against aged values across controlled environmental stress screening intervals. The table below outlines material parameters, shear degradation rates, and primary degradation mechanisms for common thermal interface materials used in energy storage modules.
| Interface Material Type | Bulk Thermal Conductivity (W/m K) | Cyclic Shear Degradation Rate (% per 500 cycles) | Aged Resistance Delta (K cm2/W) | Dominant Failure Mode |
|---|---|---|---|---|
| Two-Part Structural Epoxy | 2.2 | 14.5 | +1.85 | Interfacial Micro-Cracking |
| Two-Part Polyurethane Adhesive | 1.8 | 8.2 | +0.92 | Cohesive Shear Delamination |
| Thermally Conductive Silicone Gap Filler | 3.0 | 18.0 | +2.40 | Material Pump-Out and Bleed |
| Non-Silicone Acrylic Gap Filler | 2.5 | 6.1 | +0.65 | Compression Set Pressure Loss |
| Phase Change Material Sheet | 3.5 | 11.3 | +1.40 | Substrate Dewetting |
When thermal degradation seams develop across a module, cell-to-cell temperature variations increase significantly. Increased temperature deltas across a module stack create current imbalance in parallel-connected cell strings, as cells running at higher temperatures exhibit lower internal impedance and carry a disproportionate share of the current during charge and discharge pulses. This current concentration accelerates aging in hot cells, driving a cascading failure sequence across the module.
Preventing this operational failure requires establishing precise mechanical strain limits and joint compliance during the early design phase.
A two-percent rise in thermal interface voiding under cyclic stress increases localized cell core temperatures by up to 4.5 degrees Celsius during peak discharge.
Thermal interfaces subjected to dynamic shear strain maintain structural contact only when mechanical boundary stiffness balances the thermal expansion force of adjacent materials.


Shear
Mechanical displacement caused by differential thermal expansion stresses every rigid junction inside a battery pack assembly. As prismatic cells charge and discharge, electrochemical lithium intercalation into graphite anodes drives macroscopic volume changes alongside thermal expansion. A typical commercial prismatic cell experiences a thickness swell of 1.5 percent to 4.0 percent over its operational lifespan, overlaid with transient thermal expansion during high-power operation.
When contract manufacturers assemble hundreds of these cells into rigid structural enclosures, cumulative mechanical displacement generates immense internal compression and shear forces.
If the mechanical enclosure restricts cell swelling, internal stress ramps up exponentially. Clamping forces applied during pack assembly must accommodate cell swelling while maintaining thermal contact against cooling plates. When mechanical stack tolerances compound with differential thermal expansion, localized strain concentrations exceed three percent.
Structural adhesives and thermal gap fillers positioned between cell sidewalls and module frames bear the brunt of these shear displacements. Laser welds connecting cell terminals to busbars experience tensile and shear fatigue as cells shift relative to structural cooling structures, introducing risk of combined thermal and electrical failures.

Tolerance Stacks and Thermal Expansion
Dimensional control in custom energy storage packs depends on the interaction between component manufacturing tolerances and thermal expansion behavior. Contract manufacturing assembly lines operate with specified tolerance bands for cell dimensions, insulation sheet thickness, structural side plate alignment, and cold plate flatness. A standard 12-cell prismatic module with a nominal tolerance of +/- 0.3 millimeters per cell can accumulate up to +/- 3.6 millimeters of dimensional stack variation across the module length prior to structural tie-rod torquing or outer frame welding.
Contract assemblers utilize compression fixtures to clamp cell stacks to a target dimension or target load before securing side plates or applying structural potting materials. If the assembly routine clamps to a fixed dimensional length, cells at the upper limit of manufacturing tolerance experience excessive pre-charge compression force. Under subsequent thermal cycling, these highly compressed cells generate elevated lateral expansion stress, exceeding the shear yield strength of thermal adhesives bonding the module base to the liquid cooling plate.
Conversely, clamping to a fixed pre-charge force on a stack with undersized components creates excessive bond line thickness, leading to high thermal resistance and reduced mechanical shear restraint.

Is Dynamic Thermal Expansion Bound to Contract Work?
Determining responsibility for thermal fatigue failures requires analyzing whether dimensional variations stem from drawing tolerances or factory process variation. Contract manufacturers build modules within agreed drawing tolerances, but minor shifts in line clamping pressure, adhesive cure temperature, or frame fixture alignment alter internal stress profiles significantly. Evaluating how assembly tolerances translate into operational thermal degradation involves executing structured audit steps on the assembly line.
- Measure incoming cell casing dimensions and end-plate flatness using automated optical coordinate measuring machines to verify baseline tolerance distributions.
- Record the applied clamping force and displacement profile in real time during module stack compression prior to side plate laser welding or mechanical fastening.
- Verify thermal adhesive dispense mass, bead placement geometry, and open time using vision systems integrated directly onto the dispensing robot arm.
- Monitor cure temperature profiles across thermal adhesive curing tunnels using embedded thermocouple data loggers to detect thermal gradients within the uncured bond lines.
- Perform non-destructive acoustic microscopy or active thermography on fully cured modules to map baseline interface voiding and bond line thickness variations.
When contract assemblers fail to control process variables during adhesive application and clamping, mechanical strain concentrates at specific bond lines rather than distributing evenly across the cell array. Structural thermal degradation seams manifest primarily along these strain-concentrated locations, causing localized interface debonding during thermal cycling. The table below quantifies how key manufacturing tolerance variations interact with operational thermal expansion to create shear strain across structural interface layers.
| Manufacturing Component Parameter | Nominal Tolerance Band | Assembly Stack Effect | Operational Stress Increment | Structural Thermal Impact |
|---|---|---|---|---|
| Prismatic Cell Thickness Variance | +/- 0.25 mm | Accumulated stack length drift up to +/- 3.0 mm | +12.5 MPa compressive stress under full charge | Accelerated adhesive lap shear cracking |
| Cold Plate Surface Flatness | 0.15 mm / 500 mm | Non-uniform thermal gap filler thickness (0.1 to 0.6 mm) | 3x variation in localized heat flux transfer rate | Hotspot generation at thick gap filler regions |
| Adhesive Dispense Bead Volume | +/- 8.0 % | Localized voiding and squeeze-out variation | Localized shear stress concentrations | Premature interface delamination seams |
| Frame Tie-Rod Pre-Tension | +/- 10.0 % | Variable cell restraint stiffness across stack | Differential cell swelling strain during aging | Busbar weld shear fatigue failure |
Mismanaging the balance between mechanical clamping tolerance and dynamic thermal expansion leads to permanent structural separation across heat transfer surfaces. When interface bonds fracture, thermal impedance jumps, cell temperatures surge, cell lifespan declines rapidly, and catastrophic thermal runaway risks escalate under high-power operating conditions.


Audit
In-process quality monitoring on contract manufacturing assembly lines captures immediate assembly defects but frequently misses progressive structural degradation mechanisms. Standard quality checks rely on optical measurement of external dimensions, electrical insulation resistance testing, manual visual inspection of dispense beads, and end-of-line open-circuit voltage verification. These conventional inspection routines confirm that a module meets drawing specifications upon exiting the line, but they provide no visibility into micro-structural defects, localized voiding, or residual stress states that initiate degradation seams under dynamic operation.
Advanced quality control protocols must integrate non-destructive testing methodologies capable of mapping internal thermal interface integrity before modules move to final pack assembly. Active transient thermography and ultrasonic acoustic imaging detect subsurface air pockets, uncured adhesive pockets, and micro-delaminations at production line speeds. Implementing these diagnostic routines enables engineers to establish quantitative baseline health metrics for structural thermal interfaces prior to committing modules to long-term field operation.

First Article Thermal Inspection Routines
First article inspection for custom energy storage packs establishes the quality baseline for all subsequent manufacturing runs. During first article builds, contract assemblers run pilot lots to validate assembly tooling, dispensing parameters, and fixture repeatability. Evaluating pilot units requires detailed non-destructive and destructive physical analysis to confirm that structural thermal pathways match engineering thermal models.
Transient plane source thermal conductivity testing verifies bulk thermal performance across multiple locations on the cold plate interface. Destructive teardowns of pilot modules allow precise measurement of adhesive bond line thickness, contact wet-out percentage, void size distribution, and lap shear bond strength. If destructive teardown reveals that thermal adhesive wet-out covers only 75 percent of the intended cell surface due to premature skinning during robot dispense delays, the contract manufacturer adjusts dispensing patterns, open times, or line speed to achieve the target 95 percent contact coverage.

Process Control Boundaries for Potting Dispensing
Potting compounds and structural foam encapsulants are widely used in custom packs to improve mechanical rigidity, prevent thermal runaway propagation, and provide environmental ingress protection. Dispensing automated two-part polyurethane or epoxy potting systems demands strict process control over fluid viscosity, mix ratio, temperature, degassing, and dispense rate. Minor process drifts produce microscopic air bubbles, incomplete matrix cross-linking, or density variations that impair both structural strength and thermal transport properties.
Quality control specifications must define explicit statistical process control limits for critical dispensing variables. Automated inline flow meters, dynamic mix head pressure sensors, and gravimetric shot-weight verification systems record real-time dispense data for every module processed. The decision list below details essential audit parameters that technical sourcing teams must enforce on contract manufacturing lines to prevent latent structural thermal seams.
- Fluid Temperature Control maintains two-part resin component viscosities within a +/- 1.5 degree Celsius window prior to mixing to ensure consistent dispense flow and substrate wetting behavior.
- Automated Degassing Verification monitors vacuum pressure inside feed tanks at less than 5 mbar to eliminate micro-bubble entrainment in the raw chemical supply streams.
- Inline Mix Ratio Monitoring utilizes dual-gear flowmeters to continuously verify that resin-to-hardener volumetric ratios stay within +/- 2.0 percent of target stoichiometry.
- Plasma Surface Activation Audit measures substrate surface energy using dyne test pens or automated contact angle goniometry to ensure surface energy exceeds 48 mN/m before adhesive application.
- Cure Kinetic Verification tracks shore hardness development and glass transition temperature via differential scanning calorimetry samples taken from each production shift lot.
When quality audits detect out-of-spec dispense parameters or surface contamination, contract assemblers isolate affected modules immediately. Non-conforming units undergo acoustic imaging to quantify void content across heat transfer interfaces. If internal voiding exceeds specified limits, affected modules are rejected, preventing units with latent thermal seams from entering the finished product supply chain.
Standard quality agreements mandate that contract assemblers record complete process telemetry, including automated dispense weights, surface pre-treatment energy levels, clamping forces, and thermal cure temperature curves, linking these data streams to individual module serial numbers inside the factory manufacturing execution system file.

Dispute
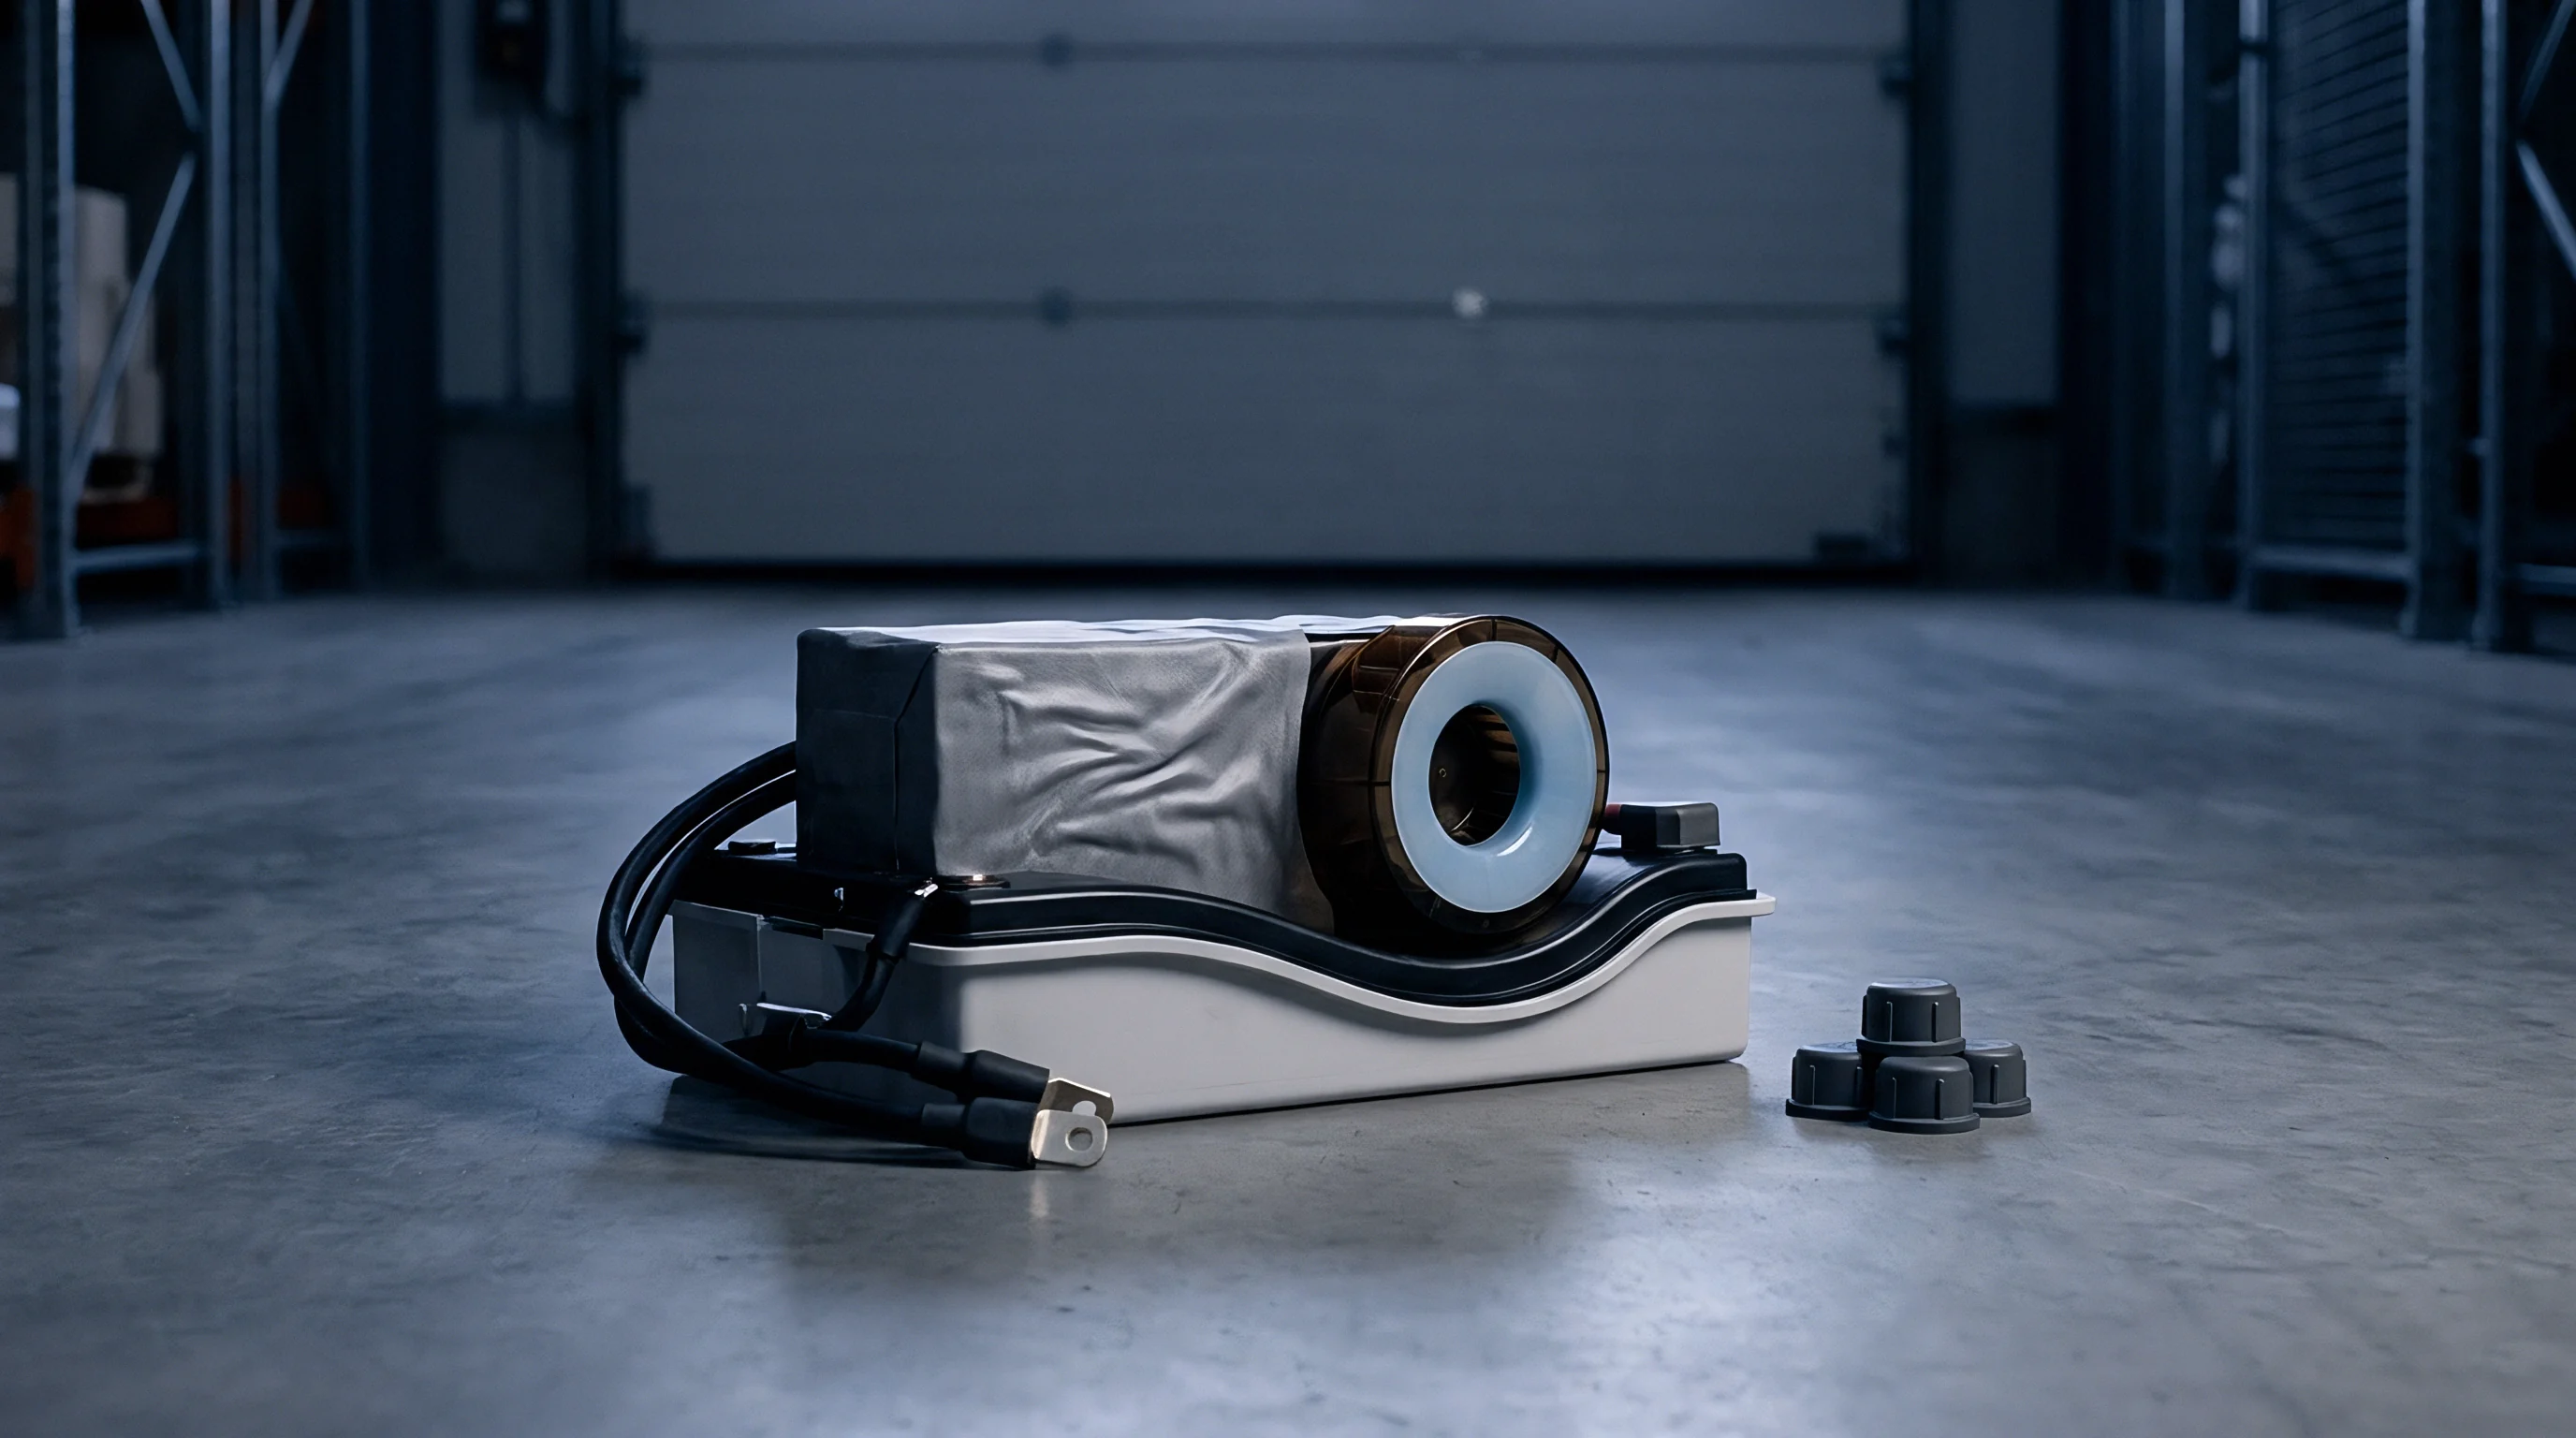
Commercial disagreements regarding battery field performance originate when thermal degradation invalidates original capacity degradation warranties. Custom energy storage pack buyers assume that rapid capacity fade or module thermal imbalance stems from manufacturing defects, claiming remedy under contract assembly workmanship warranties. Contract manufacturers counter that capacity loss reflects natural cell electrochemistry aging, dynamic user operational profiles, or underlying thermal management design flaws that fall entirely outside assembly scope.
Disentangling cell electrochemistry degradation from structural thermal seam degradation requires rigorous post-mortem root cause analysis. When structural thermal seams delaminate in the field, localized cell operating temperatures rise by 5 to 15 degrees Celsius above pack average. According to the Arrhenius relationship, chemical side-reaction rates inside lithium-ion cells double for every 10 degree Celsius temperature rise, accelerating solid electrolyte interphase layer growth, lithium plating, and active material loss.
The resulting capacity loss is electrochemical in nature, but its root cause is structural thermal interface separation.

Responsibility Boundaries in Contract Manufacturing
Defining clear responsibility boundaries inside contract manufacturing agreements requires explicit separation between design liabilities, component manufacturing liabilities, and assembly process liabilities. The contract responsibility matrix establishes which party bears financial risk for specific failure modes discovered during factory acceptance testing or field operation. Absent clear responsibility matrices, thermal performance disputes quickly descend into unresolvable liability standoffs.
The table below presents a definitive responsibility allocation matrix for structural thermal degradation failure modes, outlining specific metrics, root cause boundaries, and financial accountability across the design integrator, contract manufacturer, and cell vendor.
| Observed Failure Mode | Root Cause Boundary Check | Responsible Party | Contractual Remedy / Liability Trigger |
|---|---|---|---|
| Adhesive Interfacial Delamination | Surface contamination or improper plasma pre-treatment power on assembly line | Contract Manufacturer | Module rebuild cost, scrap material re-supply, line re-qualification fee |
| Cohesive Bulk Shear Cracking | Inadequate structural adhesive compliance under specified thermal expansion range | Design Integrator | Engineering change order funding, drawing update, NRE tooling modification |
| Thermal Gap Filler Pump-Out | Material selection selection lacks sufficient elasticity under dynamic cycling | Design Integrator | BOM material update cost, re-testing qualification expense allocation |
| Excessive Voiding in Potting Layer | Incorrect dispense nozzle speed, ambient humidity drift, or out-of-spec mix ratio | Contract Manufacturer | Workmanship warranty claim, lot sorting cost, scrap fee reimbursement |
| Internal Cell Impedance Spike | Baseline electrode manufacturing defect or electrolyte distribution anomaly | Cell Vendor | Cell replacement warranty, batch credit, supplier root-cause audit fee |

Warranty Seams between Cell Vendor and Integrator
A major commercial seam exists at the interface between cell vendor warranties, contract assembler workmanship guarantees, and integrator performance commitments to end customers. Cell vendors warrant individual cell performance based on strict operating temperature bounds, typically stipulating that cell surface temperatures must not exceed 45 degrees Celsius during charge or 55 degrees Celsius during discharge. If a structural thermal seam develops inside a module due to adhesive delamination, adjacent cells exceed these temperature limits during normal power operation.
When an integrator submits a warranty claim to the cell vendor for premature cell capacity loss, the cell vendor downloads BMS diagnostic logs. Upon discovering that cell operating temperatures exceeded warranted limits, the cell vendor voids the cell warranty. The integrator then turns to the contract manufacturer, claiming that thermal interface delamination caused the thermal excursion.
Contract responsibility matrices isolate cell swelling force from assembly line clamp force. The contract manufacturer defends themselves by producing line process logs demonstrating that adhesive dispense volume, cure time, and clamping pressure met drawing specifications during production, asserting that the specified adhesive formulation failed to withstand operational thermal strain.
Disproportional capacity loss across parallel cell strings serves as primary forensic evidence of localized thermal interface delamination inside aged modules.
Standard commercial supply contracts contain precise clauses governing warranty seam resolution, specifying that if a field failure cannot be conclusively attributed to a single party within 60 days of initial teardown inspection, the design integrator and contract manufacturer shall split the initial repair expense equally while independent laboratory arbitration proceeds.
Determining whether structural thermal delamination resulted from flawed adhesive choice or unrecorded process drift during robot dispensing remains a central point of contention in high-power energy storage litigation.


Ledger
Financial accounting for thermal failure risks inside energy storage projects demands explicit line-item allocation before volume tooling sign-off. Miscalculating the financial exposure associated with structural thermal degradation leads to severe budget overruns during mass production ramps. Non-recurring engineering expenses, pilot build re-qualification cycles, incoming component scrap rates, and field recall reserves directly correlate with the mechanical and thermal robustness of the chosen module geometry.
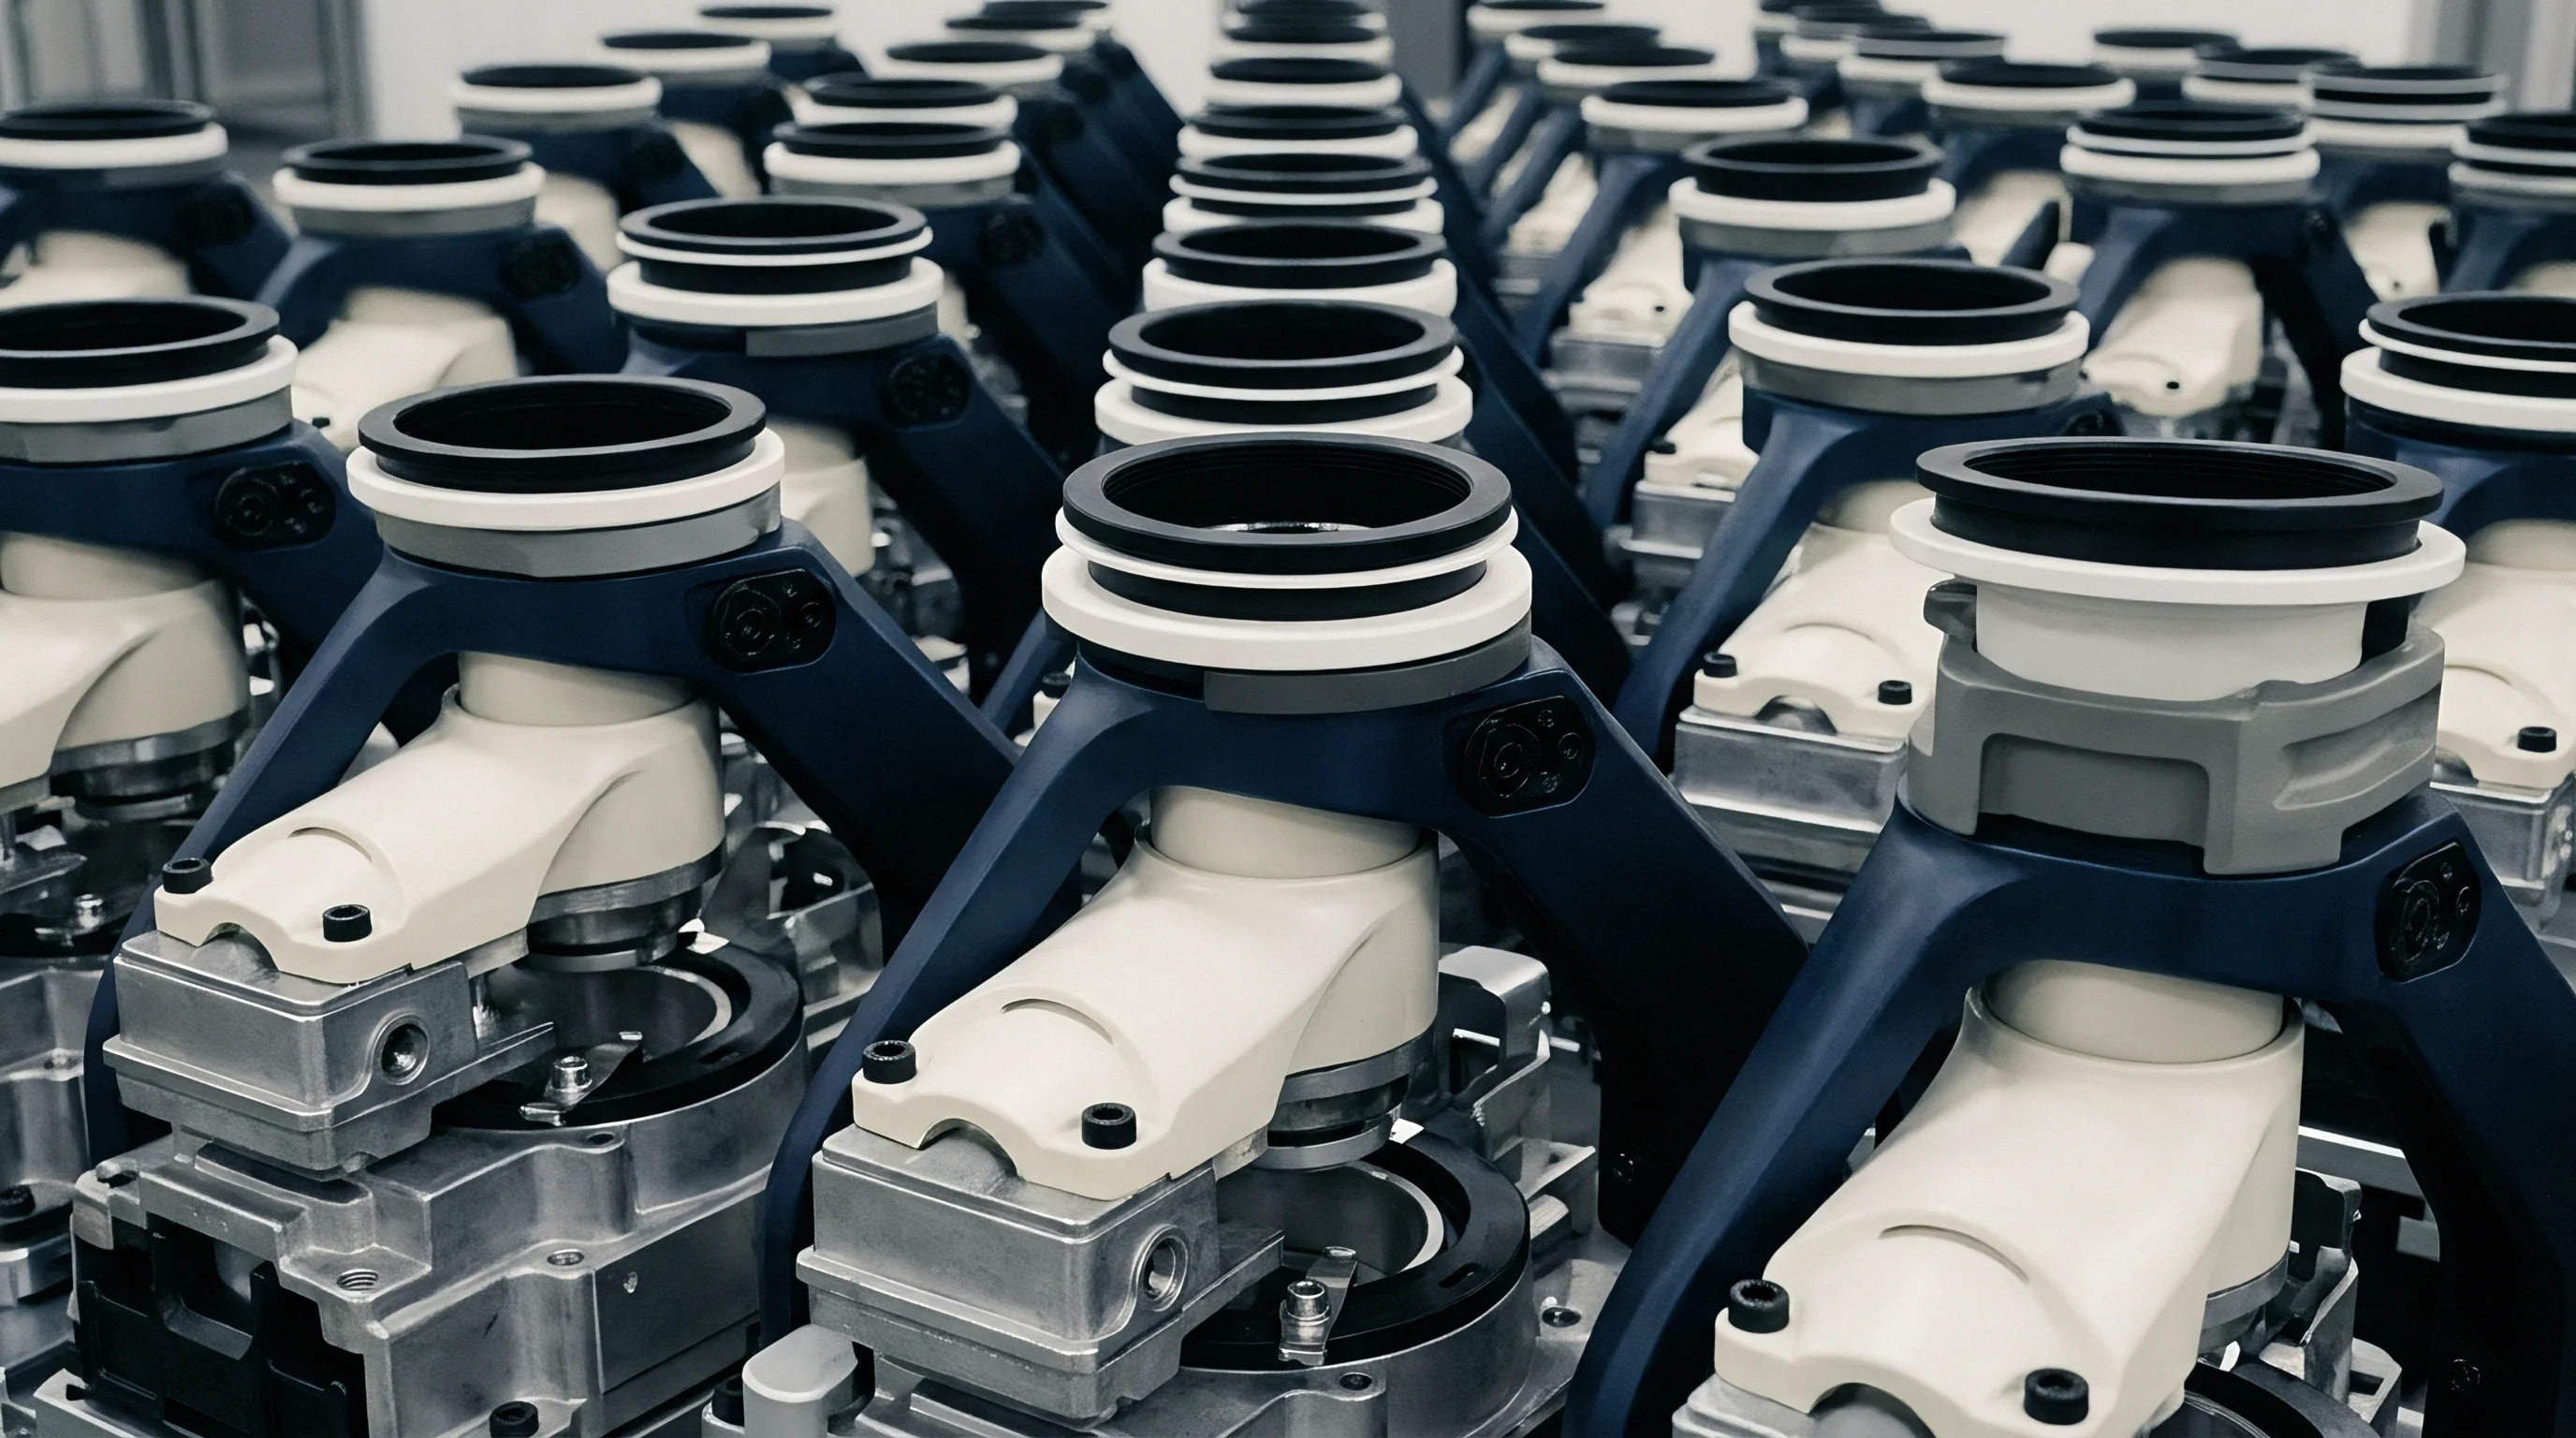
When structural thermal seams appear during design validation testing, retrofitting thermal interface media or redesigning module clamping mechanisms forces immediate engineering changes. Modifying injection molds, automated dispensing robot trajectories, or compression clamping fixtures requires substantial capital expenditure and delays mass production schedules. Procurement teams must account for these potential NRE amortization risks when evaluating competing contract assembly quotes.
Non-Recurring Engineering Amortization and Retest Liabilities
Amortizing NRE costs across initial production volumes requires setting aside dedicated contingency budgets for thermal design iterations. A standard custom pack tooling program involves specialized NRE line items including automated dispense tooling, ultrasonic welding horns, module compression fixtures, active thermography inspection stations, and thermal cure oven pallets. If initial environmental stress screening exposes interfacial shear cracking, resolving the defect demands re-tooling and comprehensive re-testing.
Re-qualifying a modified thermal interface design requires executing complete UN 38.3, UL 1973, and IEC 62619 safety certification sequences. Certification re-testing incurs direct laboratory testing fees ranging from $45,000 to $120,000 per module variant, alongside weeks of schedule delay. If contract agreements fail to establish clear financial liability for re-test costs stemming from factory process non-conformances, the design integrator absorbs these unexpected expenses, drastically altering project landed cost economics.

Landed Risk Calculations for Custom Storage Modules
Evaluating the total landed risk of custom energy storage modules requires building financial models that combine base contract assembly prices, scrap allowance allocations, warranty reserve provisions, and potential recall exposure. A low baseline assembly fee from a contract manufacturer often hides elevated financial risk if the facility lacks automated process controls for critical thermal interface dispensing and curing operations.
Calculating landed risk involves factoring in predicted field repair costs based on statistical interface degradation rates derived from accelerated life testing. The calculation sequence below establishes a comprehensive landed risk cost model per energy storage module produced.
- Calculate baseline unit manufacturing cost including cell bill of materials, enclosure hardware, thermal interface media, and direct contract assembly fees.
- Add process yield scrap allowance based on historical contract manufacturer scrap rates for automated gap filler dispense and curing operations, typically 1.5 percent to 3.5 percent.
- Compute thermal warranty reserve provision by multiplying projected field failure rate driven by interface degradation by the full module replacement labor and logistics cost.
- Incorporate NRE modification contingency reserves equal to ten percent of total line tooling capital expenditure to cover potential thermal pathway drawing revisions.
- Sum baseline manufacturing cost, process scrap allocation, thermal warranty reserve, and NRE contingency allowance to derive total landed risk unit cost.
Project financial models that neglect latent thermal degradation risks understate true landed unit costs significantly. A module with a nominal assembly cost of $1,200 can accumulate an additional $180 per unit in hidden risk liabilities if the assembly line relies on manual adhesive dispensing and visual surface inspection. Enforcing strict automated process controls, quantitative non-destructive testing, and clear contractual liability boundaries ensures that energy storage pack projects maintain financial viability throughout their operational deployment lifecycle.