Electrochemical Impedance Spectroscopy Criteria for Subzero Lithium Plating Detection under Fast Charging
Subzero fast charging induces metallic lithium plating detectable via mid-frequency impedance arc splitting and phase angle drops near zero degrees.

Arc
Lithium-ion cells subjected to fast charging below 0 °C force an immediate competition between lithium intercalation into the graphite host and metallic lithium deposition across the anode surface. Electrochemical impedance spectroscopy tracks this shift through dynamic changes in the high-to-mid frequency response. Within normal temperature bounds, the Nyquist spectrum displays a predictable high-frequency ohmic intercept followed by a depressed semicircle that reflects solid electrolyte interphase migration alongside charge transfer resistance.
Once subzero charging drives the negative electrode below 0 V versus Li/Li⁺, metallic lithium nucleates directly on the graphite boundary. This restructuring skews local charge-transfer kinetics, splitting the primary charge-transfer arc into two distinct relaxation features or surfacing a secondary high-frequency loop.
Resolving these spectral transitions under direct-current bias demands clean frequency sweeps between 10 kHz and 0.1 Hz. Right as plating begins, the real impedance drops briefly because the metallic deposit offers a low-resistance path, bypassing the steep activation energy barrier of graphite intercalation. At the same time, the imaginary trace flattens out. The drop is short-lived: freshly plated lithium reacts rapidly with the bulk liquid electrolyte, generating secondary solid electrolyte interphase species that drive an immediate mid-frequency impedance spike.
Mid-Frequency Semicircle Distortion under Anodic Overpotential
Real-time impedance monitoring during a 1.5C charge at -10 °C shows the mid-frequency arc tracking anode overpotential in real time. Below 30 percent state-of-charge, intercalation kinetics still clear the incoming lithium flux, keeping charge-transfer resistance relatively flat. Past 45 percent state-of-charge, lithium ions saturate the electrolyte pores of the anode.
Double-layer polarization then clears the thermodynamic threshold for lithium reduction, precipitating adatoms across the graphite particles.
The Nyquist trace transitions from an elliptical arc into a bi-modal spectrum. The newly formed high-frequency loop reflects direct reduction to metallic lithium, which carries a lower charge-transfer resistance than the neighboring intercalation route. Meanwhile, the mid-frequency arc drifts toward higher resistance values because the metallic deposit partially obstructs the open pore network.
Tracking the shifting ratio of these two resistances reveals whether incoming current is still intercalating safely or depositing as surface metal.
Dynamic impedance spectra collected at -15 °C under 2C charge bias show a 14 percent decrease in mid-frequency real resistance at the exact onset of metallic lithium nucleation.
Phase Angle Shifts as Early Indicators of Deposition
Single-frequency phase angle tracking gives battery management systems a fast alternative when full spectral sweeps demand too much onboard processing. At 100 Hz, a healthy cell in cold conditions exhibits straightforward capacitive double-layer behavior, holding steady between -5 degrees and -10 degrees. The first signs of plating alter interfacial capacitance and kinetic resistance simultaneously, collapsing the 100 Hz phase angle toward 0 degrees.
This phase deviation shows up as much as three minutes before pack terminals register an overpotential fault. The timing difference comes down to the high exchange current density of metallic deposition compared to the slow solid-state diffusion of lithium through chilled graphite. When current density varies across the electrode face, isolated patches begin plating while surrounding areas continue to intercalate, generating a blended phase response that mirrors micro-scale short circuits across the double layer.
Whether that secondary low-frequency signature persists after returning to open-circuit relaxation remains an open debate in the diagnostic literature.

Chill
Electrolyte viscosity climbs rapidly as operating temperatures drop from 25 °C toward -30 °C, choking both ionic conductivity and desolvation at the anode interface. In cells using conventional ethylene carbonate formulations, bulk conductivity falls from 10 mS/cm at 25 °C to less than 1.2 mS/cm at -20 °C. The resulting transport bottleneck steepens concentration gradients in the liquid phase, building severe overpotentials under fast-charge pulses.
Subzero temperatures fundamentally alter the kinetic balance. Graphite intercalation carries an activation energy between 40 kJ/mol and 60 kJ/mol, whereas metallic lithium deposition requires only 10 kJ/mol to 15 kJ/mol. At room temperature, intercalation wins out thermodynamically.
In the cold, however, the steep activation barrier suppresses the intercalation rate constant so heavily that metallic deposition becomes the easier kinetic pathway at high C-rates.
Solvated Lithium Ion Transport Limits at Subzero Temperatures
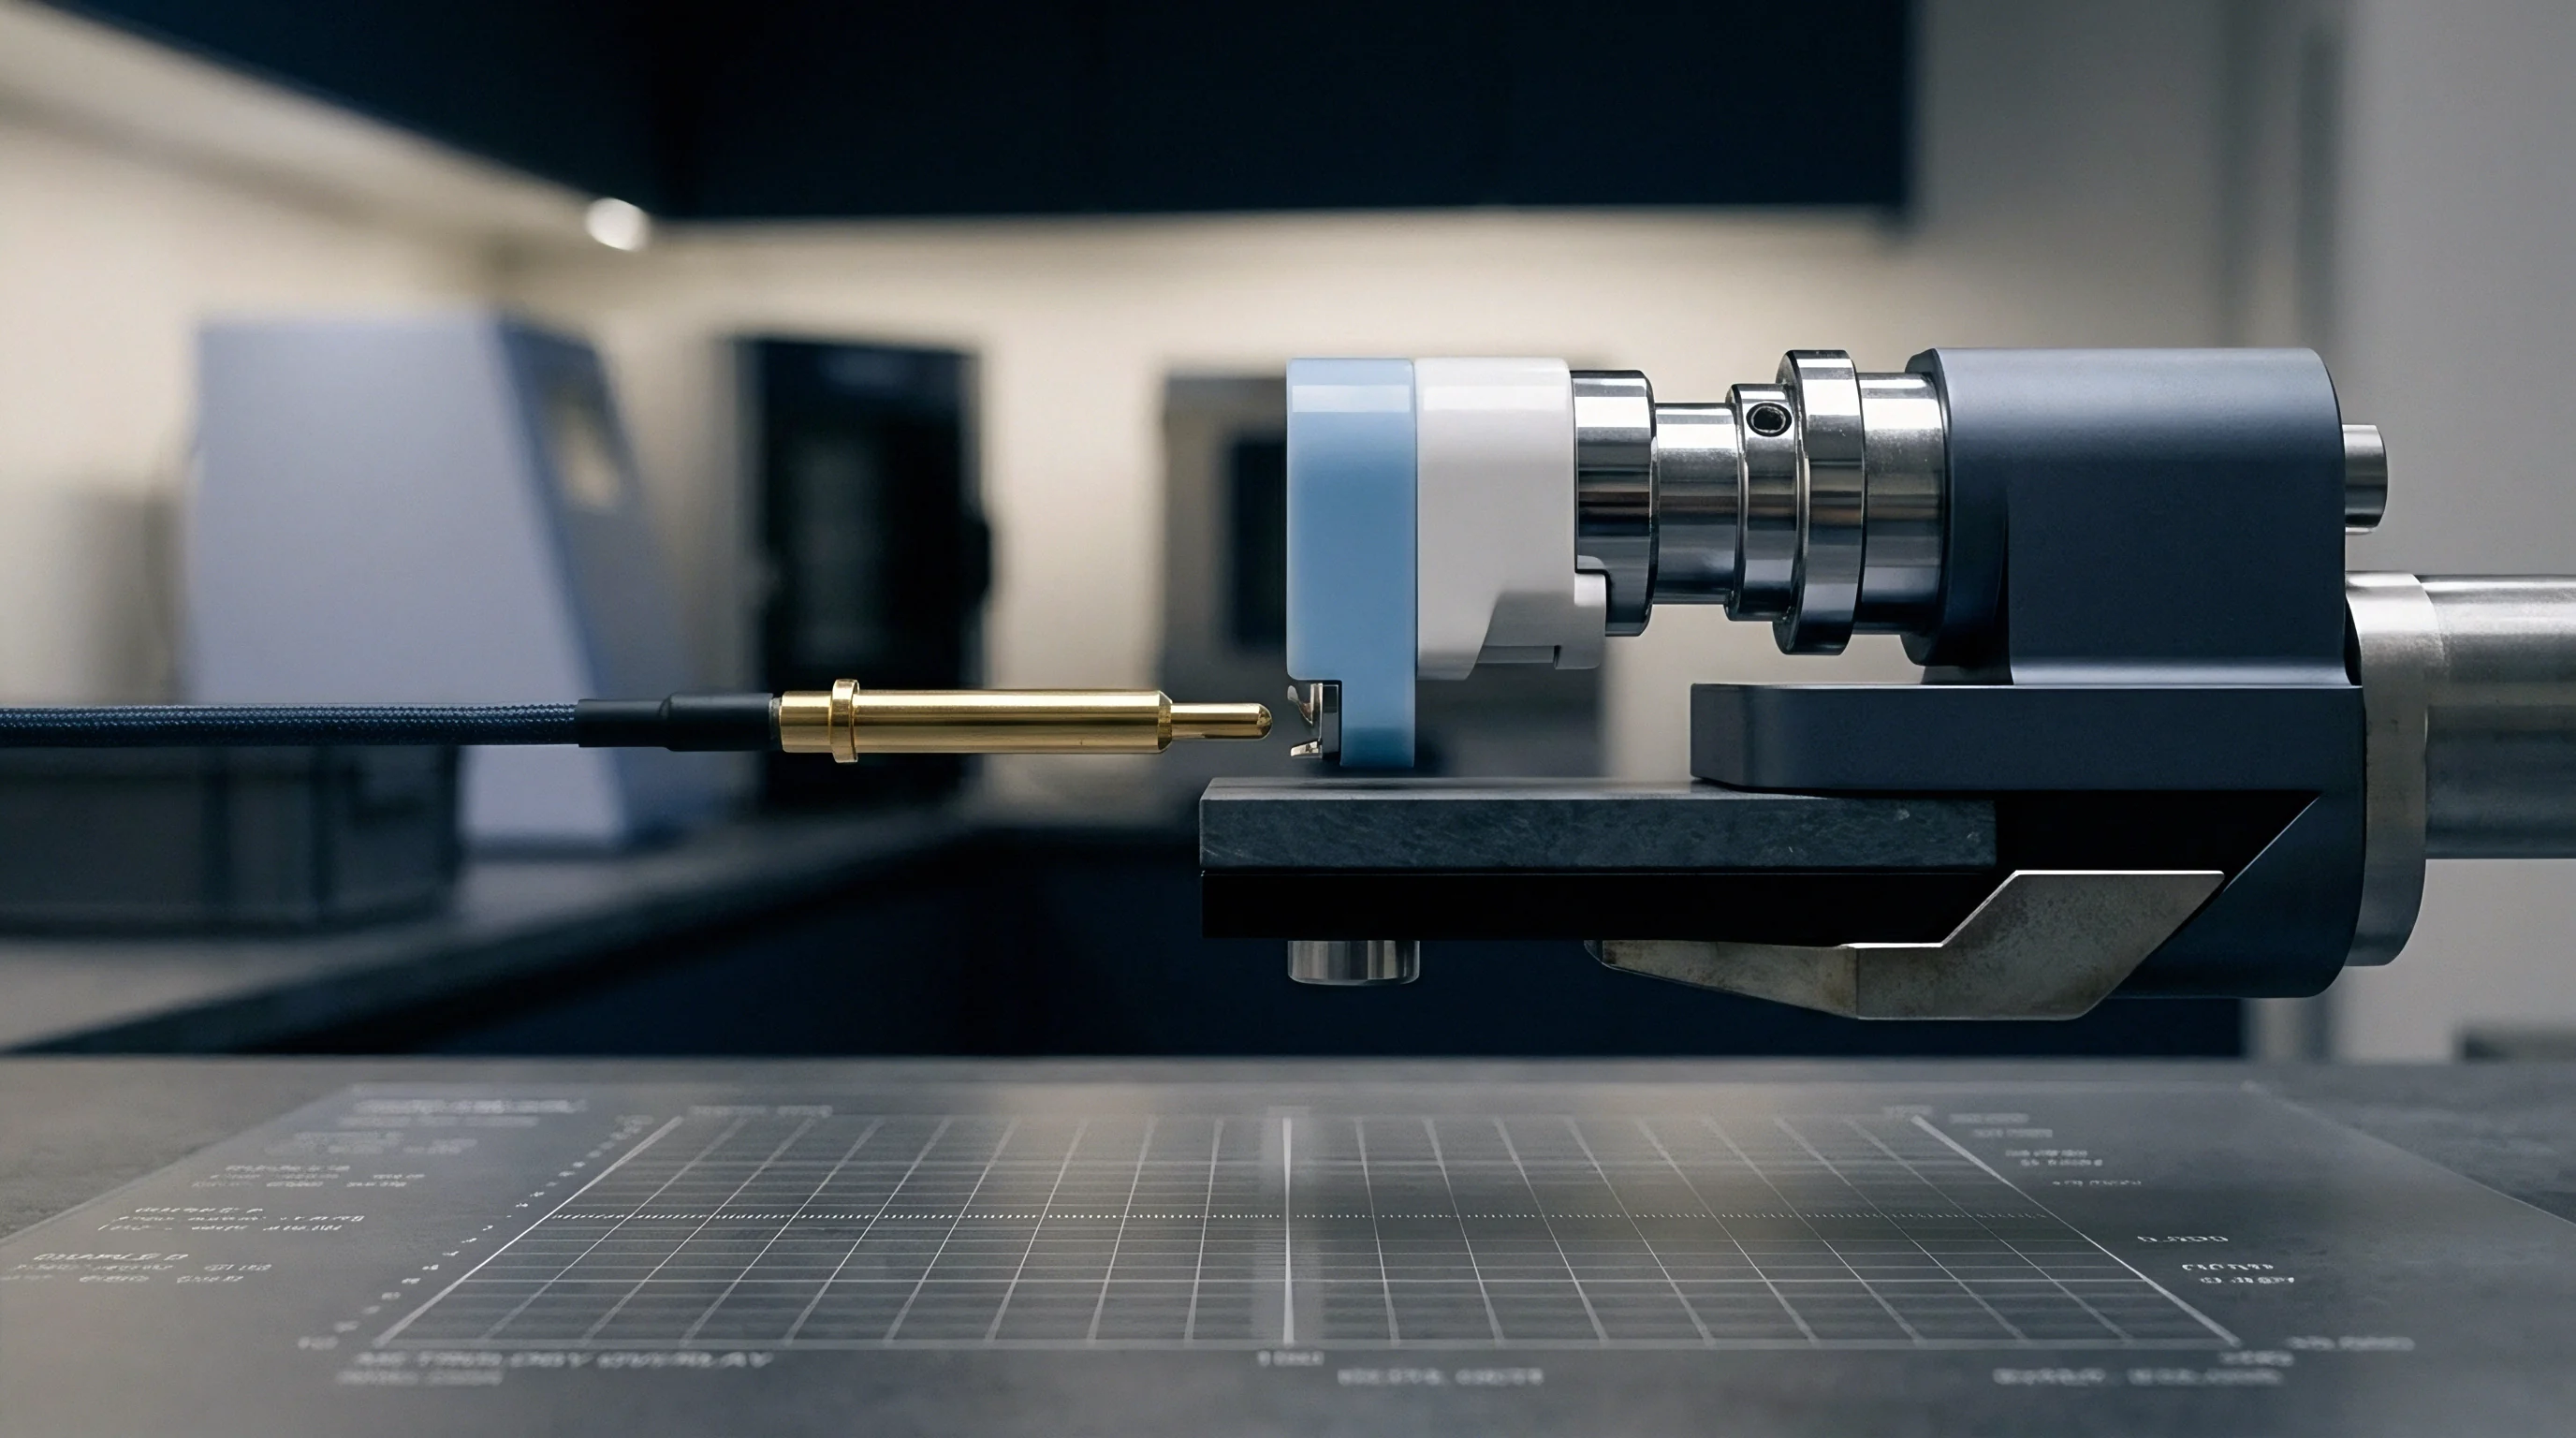
Stripping the solvent sheath from the lithium cation serves as the rate-limiting step for charge transfer through the solid electrolyte interphase. In subzero environments, strong coordination between the cation and carbonate molecules resists desolvation. Solvated ions back up at the outer Helmholtz plane, elevating interfacial capacitance and driving up high-frequency real impedance.
This pile-up of solvated ions establishes a steep local field across the interphase. When fast charging forces a heavy electron flux into the graphite, those electrons reduce coordinated cations right at the outer surface rather than waiting for desolvation and lattice insertion. The reaction yields amorphous, highly reactive metallic deposits that wrap around graphite particles and continuously consume liquid electrolyte.
| Temperature (°C) | Applied Charge Rate | Ohmic Resistance R0 (mΩ) | Charge Transfer Rct (mΩ) | Plating Onset SOC (%) |
|---|---|---|---|---|
| 25 | 1.0C | 1.2 | 4.5 | No Plating Observed |
| 0 | 1.5C | 2.1 | 18.3 | 78 |
| -10 | 1.5C | 3.4 | 42.6 | 42 |
| -20 | 2.0C | 5.8 | 115.0 | 18 |
| -30 | 0.5C | 9.2 | 230.4 | 12 |

Overpotential Thresholds for Metallic Lithium Nucleation
Pinpointing the real negative electrode potential requires isolating ohmic losses in the porous solid from concentration gradients in the liquid phase. Three-electrode cell tests confirm that whenever local anode potential dips below 0 V relative to Li/Li⁺, metallic lithium nucleation turns thermodynamically spontaneous. Standard two-electrode pack measurements hide this excursion because overall cell voltage is dominated by cathode polarization and bulk internal resistance.
Impedance tracking detects this crossing without internal reference pins. By monitoring the derivative of real impedance with respect to state-of-charge during constant-current steps, controllers identify the inflection point where plating starts. A sudden slope change in real impedance indicates that local anode overpotential has broken the zero-volt limit, shifting current from intercalation to surface plating.
Fast charging chilled cells without preheating will inevitably plate lithium once current outpaces desolvation at the solid electrolyte interphase.


Resonance
Distribution of Relaxation Times resolves overlapping Nyquist arcs into discrete frequency spectra without relying on pre-assumed equivalent circuits. Standard circuit fitting often breaks down at subzero temperatures because the time constants for interphase transport and interfacial charge transfer merge into a single indistinct semicircle. DRT analysis maps polarization mechanisms continuously along a logarithmic time axis, separating coupled electrochemical reactions into distinct peaks.
Tikhonov regularization of the imaginary spectrum produces a distribution function where individual peaks align with specific physical mechanisms. At ambient room temperatures, the charge-transfer time constant sits between 0.01 seconds and 0.1 seconds. Under subzero fast charging, that same process slows to between 1 second and 10 seconds, while metallic lithium nucleation appears at sub-millisecond time constants.
Time constants overlap in raw spectra.

Resolving Overlapping Time Constants via Relaxation Time Spectra
Deconvolving impedance data taken at -15 °C isolates three primary peaks in the relaxation spectrum. The earliest peak, centering near 10 kHz, tracks ion conduction through surface passivation layers. The second feature, spanning 100 Hz to 1 Hz, isolates charge-transfer resistance across the active interfaces, and peak splitting in this mid-frequency band provides the clearest marker of active lithium plating.
As metallic lithium collects on the graphite, this single charge-transfer peak splits in two. The faster sub-peak reflects direct reduction to lithium metal, while the slower peak tracks remaining ions forcing their way into partially clogged graphite pores. Monitoring the growth of these split peaks gives algorithms a quantitative metric for plating severity, pinpointing the moment metallic film growth starts carrying the balance of the current.
- High-Frequency Peak Suppression ~ Reduction in the solid electrolyte interphase resistance area due to localized thermal heating and micro-cracking caused by fresh metallic lithium dendrites penetrating the passivation layer.
- Mid-Frequency Peak Splitting ~ Separation of the broad charge transfer relaxation peak into two distinct time-constant centers, directly indicating dual simultaneous reduction mechanisms at the anode surface.
- Low-Frequency Peak Shift ~ Drift of the solid-state Warburg diffusion spectrum toward longer time constants as metallic deposits block open pore channels, restricting solid-state diffusion paths.
- Capacitive Loop Inversion ~ Inductive behavior emerging at low frequencies under heavy bias, caused by transient surface intermediate species during high-rate subzero plating.
Cell qualification specs must mandate dynamic impedance baseline testing at -10 °C across the entire operational window to validate fast-charge profiles against early metallic deposition limits.

Peak Identification for Metallic Film Formation
Integrating the area beneath deconvolved peaks allows tracking of dead lithium buildup across extended cycling. Over repeated subzero fast charges, a portion of the plated metal reacts irreversibly with electrolyte components, shedding electrically isolated dead lithium. Capacity retention drops under subzero charging.
This parasitic accumulation permanently distorts the baseline spectrum, broadening the solid electrolyte interphase peak and elevating low-frequency diffusion resistance.
Separating reversible deposits from permanently isolated dead lithium requires watching impedance decay during post-charge rest. Active metallic lithium chemically re-intercalates into the underlying graphite matrix over 10 to 30 minutes, producing a measurable drop in mid-frequency resistance during the pause. Leaving these deposits unresolved before initiating another charge pass accelerates dendrite penetration, raising the odds of internal shorts, thermal runaway, and voided warranty coverage.

Clamp
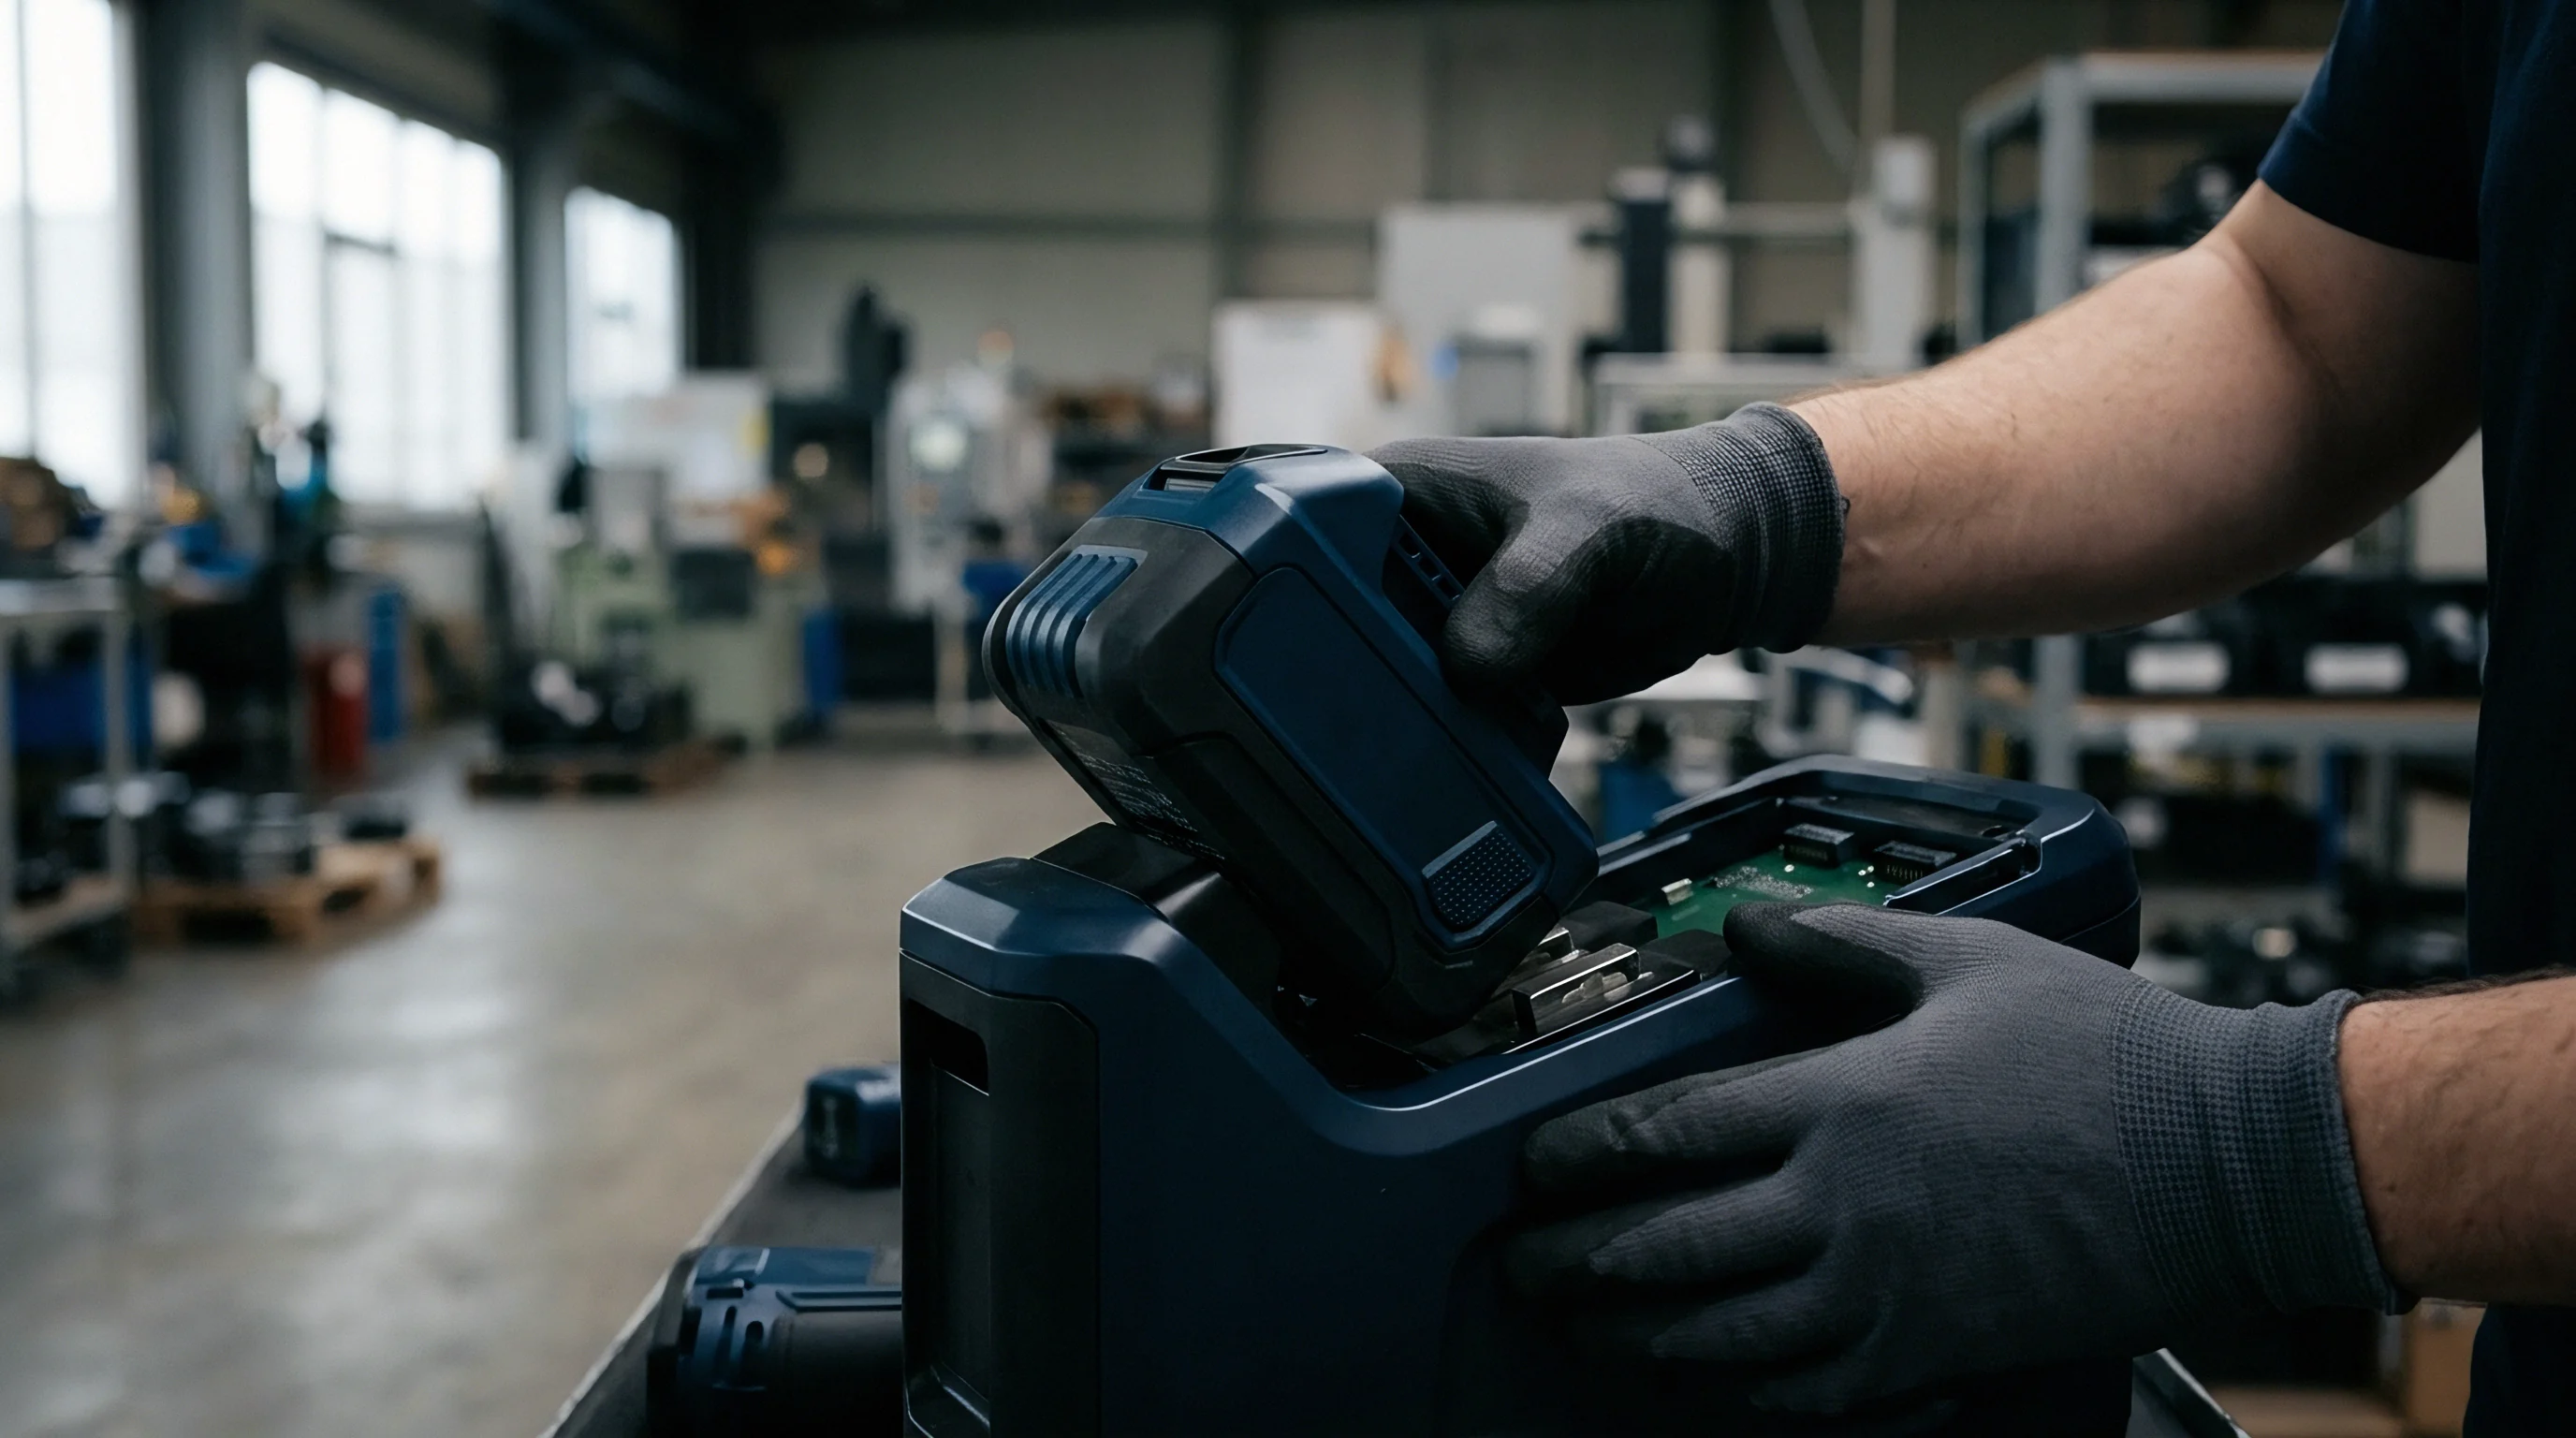
Mechanical pressure applied across pouch and prismatic faces changes internal contact resistance and shifts current density distributions during cold-temperature operation. Stack compression narrows the porous separator and electrode coatings, altering ionic pathways through the liquid phase. Without adequate clamping, thermal contraction at low temperatures opens micro-gaps and leaves uneven pressure profiles across the electrode area.
| Cell Format | Clamping Pressure (MPa) | Ohmic Shift R0 (mΩ) | Charge Transfer Rct (mΩ) | Plating Detection Sensitivity |
|---|---|---|---|---|
| Pouch 50Ah | 0.1 (Unclamped) | +1.8 | 52.1 | Low (Signal Masked by Contact Drift) |
| Pouch 50Ah | 0.5 (Nominal) | +0.2 | 38.4 | High (Clear DRT Peak Separation) |
| Pouch 50Ah | 1.5 (Over-compressed) | +0.9 | 46.2 | Moderate (Separator Pore Closure) |
| Prismatic 100Ah | 0.8 (Constrained) | +0.1 | 31.2 | High (Uniform Current Distribution) |
| Cylindrical 21700 | Internal Jellyroll Strain | +0.4 | 44.0 | Moderate (Radial Pressure Gradient) |

What Distinguishes Plating Inflections from Film Growth?
Separating active plating from routine solid electrolyte interphase growth requires checking the impedance trajectory against mechanical load and thermal conditions. Solid electrolyte interphase growth builds gradually across hundreds of cycles, showing up as a slow, steady climb in real resistance. Metallic lithium plating, by contrast, creates an abrupt, non-linear break in both real resistance and phase angle during a single cold-temperature charge.
Dynamic bias measurements confirm that passive film thickening expands the diameter of the high-frequency semicircle while preserving its characteristic frequency. Plating instead shifts the characteristic frequency of the mid-frequency arc, lowering charge-transfer resistance momentarily before driving a sharp post-charge rebound. That immediate within-cycle inflection distinguishes active metal deposition from standard chemical aging.
Optimal stack pressure eliminates local contact gaps, stabilizing impedance baselines so that subzero lithium plating signatures are clearly isolated from mechanical displacement noise.
Stack Pressure Modulation of Interfacial Charge Resistance
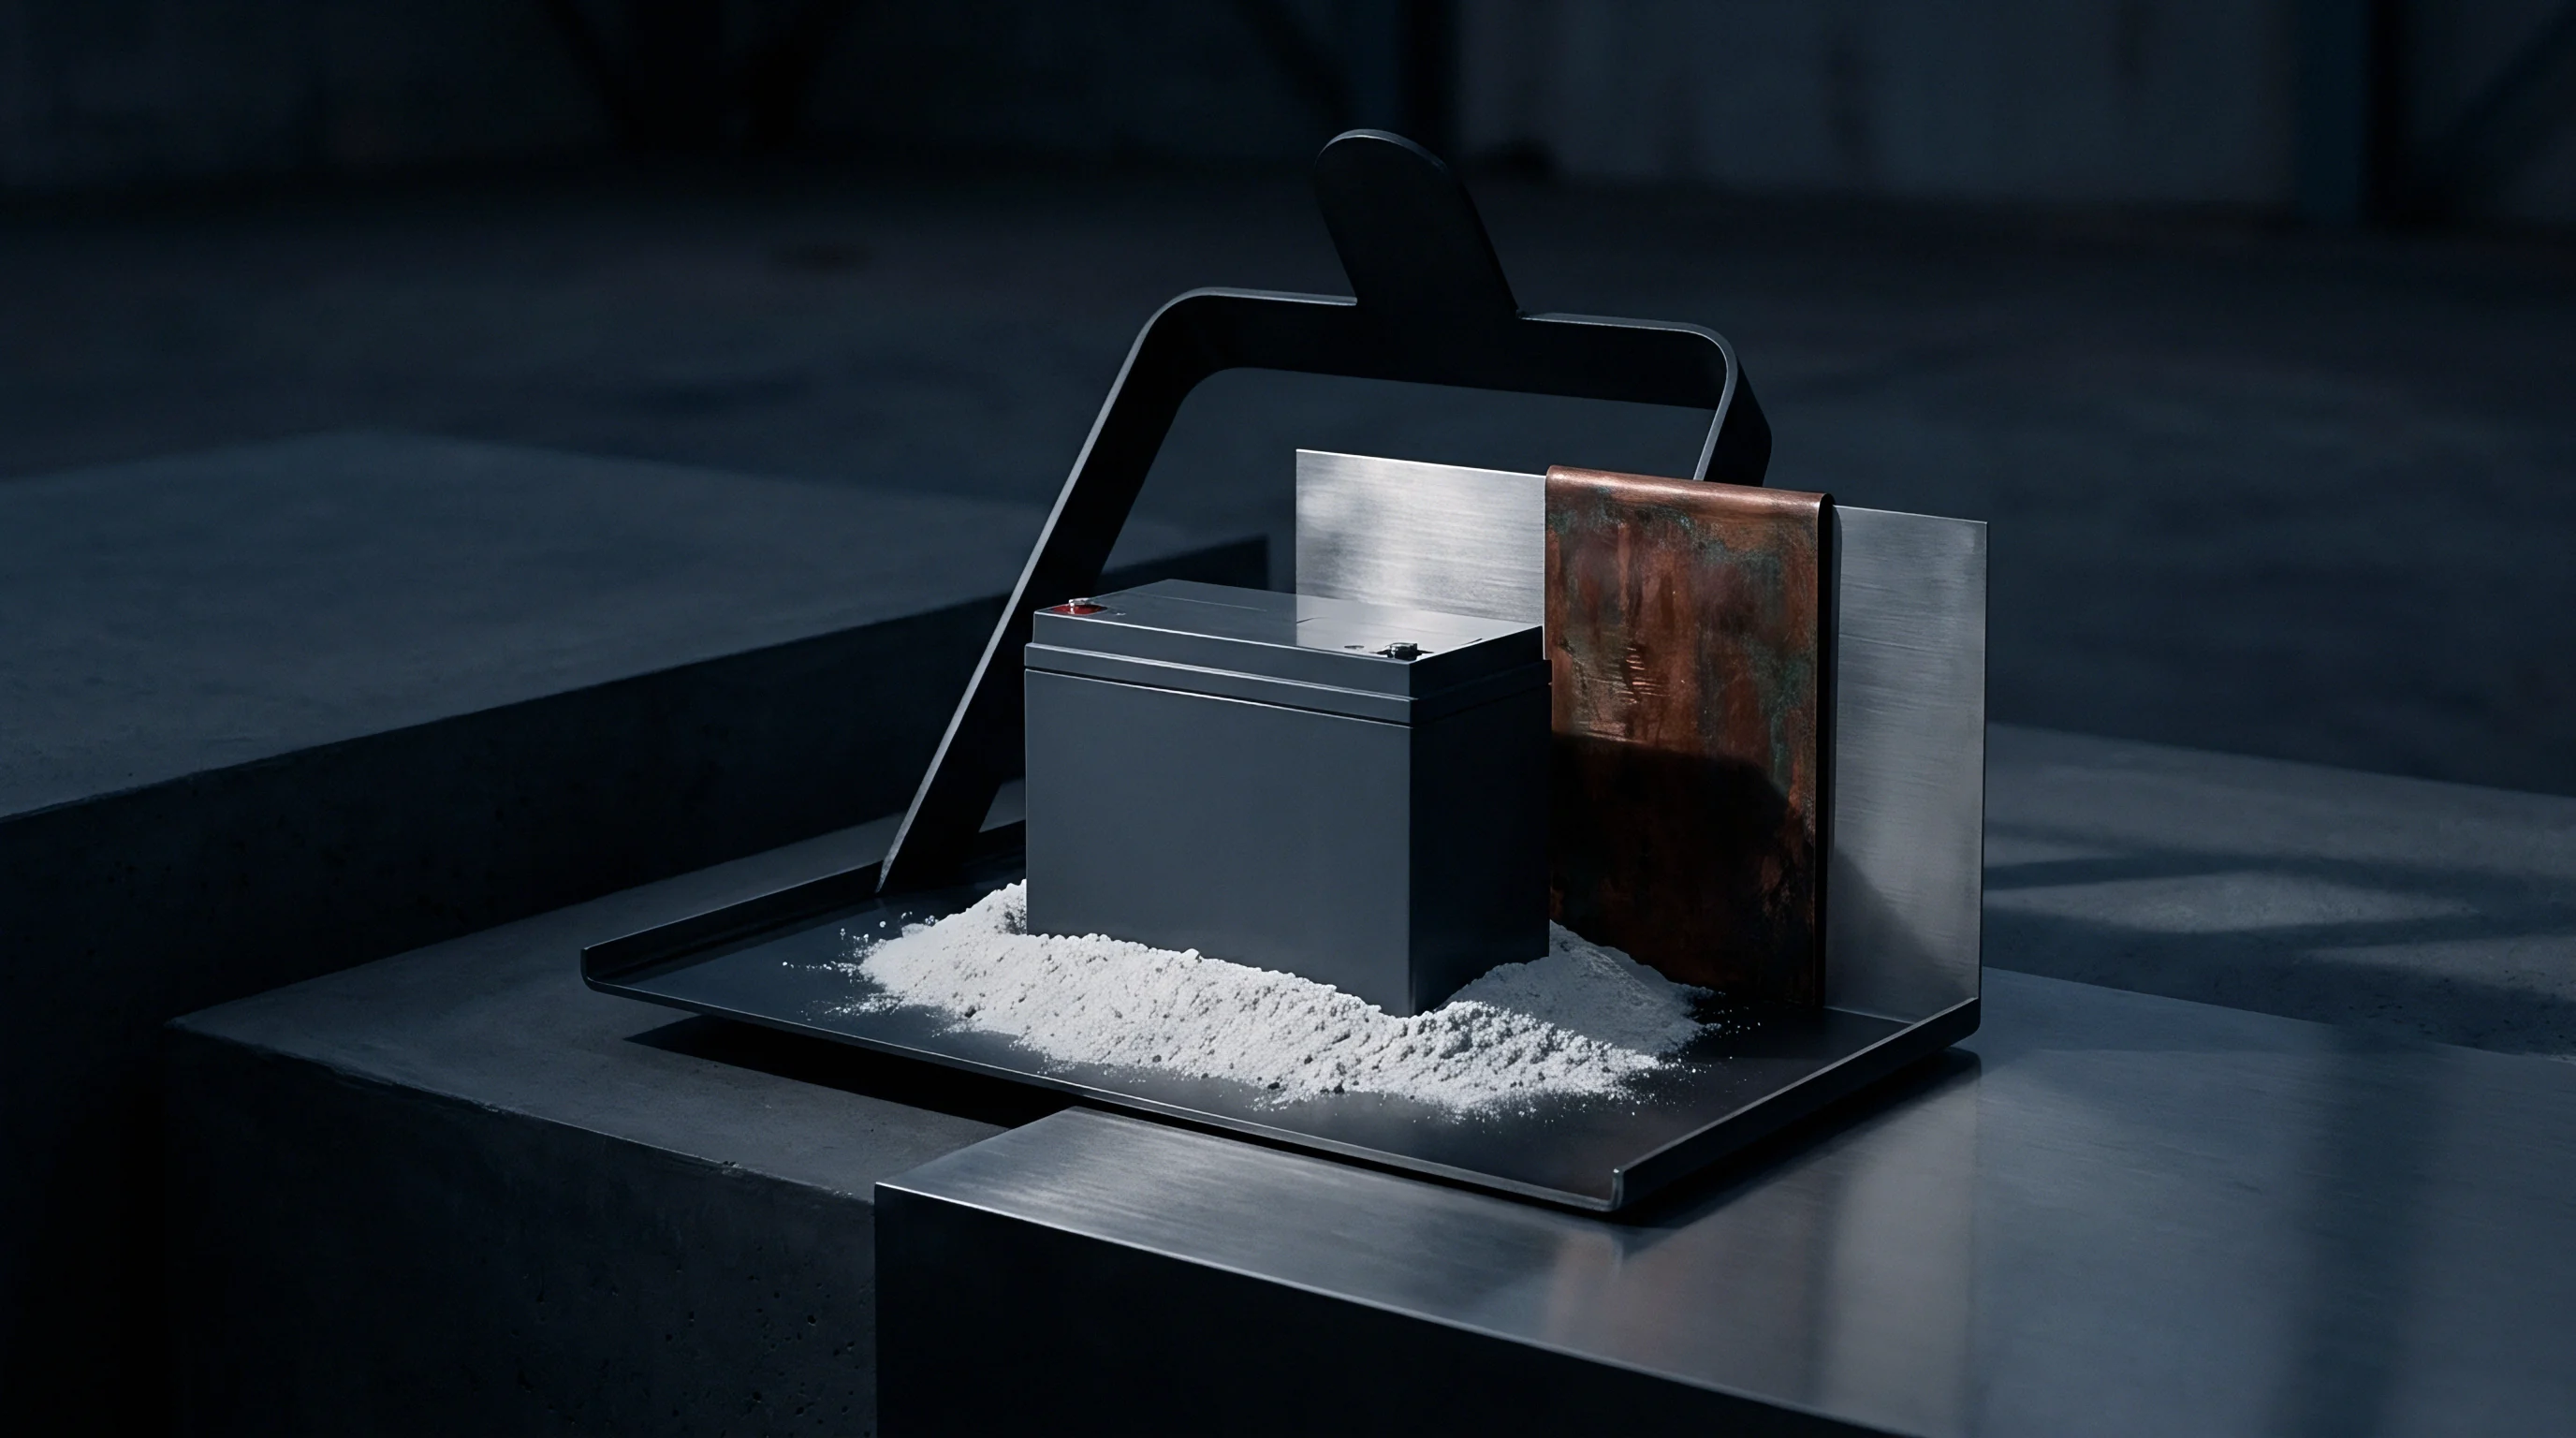
Cell packaging geometry dictates how mechanical stress influences impedance under cold fast charging. Cylindrical cans maintain considerable internal radial tension from winding, ensuring tight contact between active coatings and foil substrates. The rigid shell prevents outward expansion, which concentrates internal pressure gradients when lithium plates and expands inside the core.
Pouch cells depend on external module retention frames to maintain contact across the stack. Applying roughly 0.5 MPa maintains low contact resistance while leaving sufficient room for minor cyclic breathing. Clamping beyond 1.5 MPa pinches the separator pores, reducing local electrolyte retention and triggering earlier lithium plating under concentration polarization.
High subzero internal impedance can stem from bulk electrolyte freezing rather than premature lithium plating brought on by poor internal tab welds or incomplete separator wetting.


Protocol
Running online impedance spectroscopy inside automotive and industrial battery systems requires high-speed frequency sweeps during continuous charge injection. Standard laboratory impedance tests require long resting periods in environmental chambers, which cannot support dynamic charging control. Online protocols superimpose brief, low-amplitude AC perturbations directly onto the primary fast-charge profile, reading voltage deviations on the fly.
Digital processing routines must filter small perturbation responses out of the substantial direct-current baseline generated by charging current and rising state-of-charge. Windowed Fourier transforms on the response voltage yield instantaneous complex impedance coordinates. Limiting interrogation to a targeted set of diagnostic frequencies keeps microcontroller workloads manageable while preserving sensitivity to subzero deposition.
- Establish baseline impedance values across frequencies from 1 kHz down to 1 Hz under low-current subzero thermal equilibrium conditions.
- Initiate fast-charge current injection while applying a secondary sinusoidal perturbation signal focused on the 100 Hz and 10 Hz diagnostic target frequencies.
- Sample differential voltage and current responses at a minimum rate of 100 kHz using high-resolution analog-to-digital converters to prevent phase distortion.
- Execute real-time fast Fourier transform analysis on sliding ten-cycle window frames to extract real and imaginary impedance components continuously.
- Compare real-time charge-transfer resistance shifts against pre-calibrated temperature-dependent overpotential look-up tables.
- Trigger immediate charge derating protocols if the 100 Hz phase angle drops below the pre-set -2 degree lithium plating safety threshold.
Real-Time Excitation Frequencies for Subzero Fast Charge Monitoring
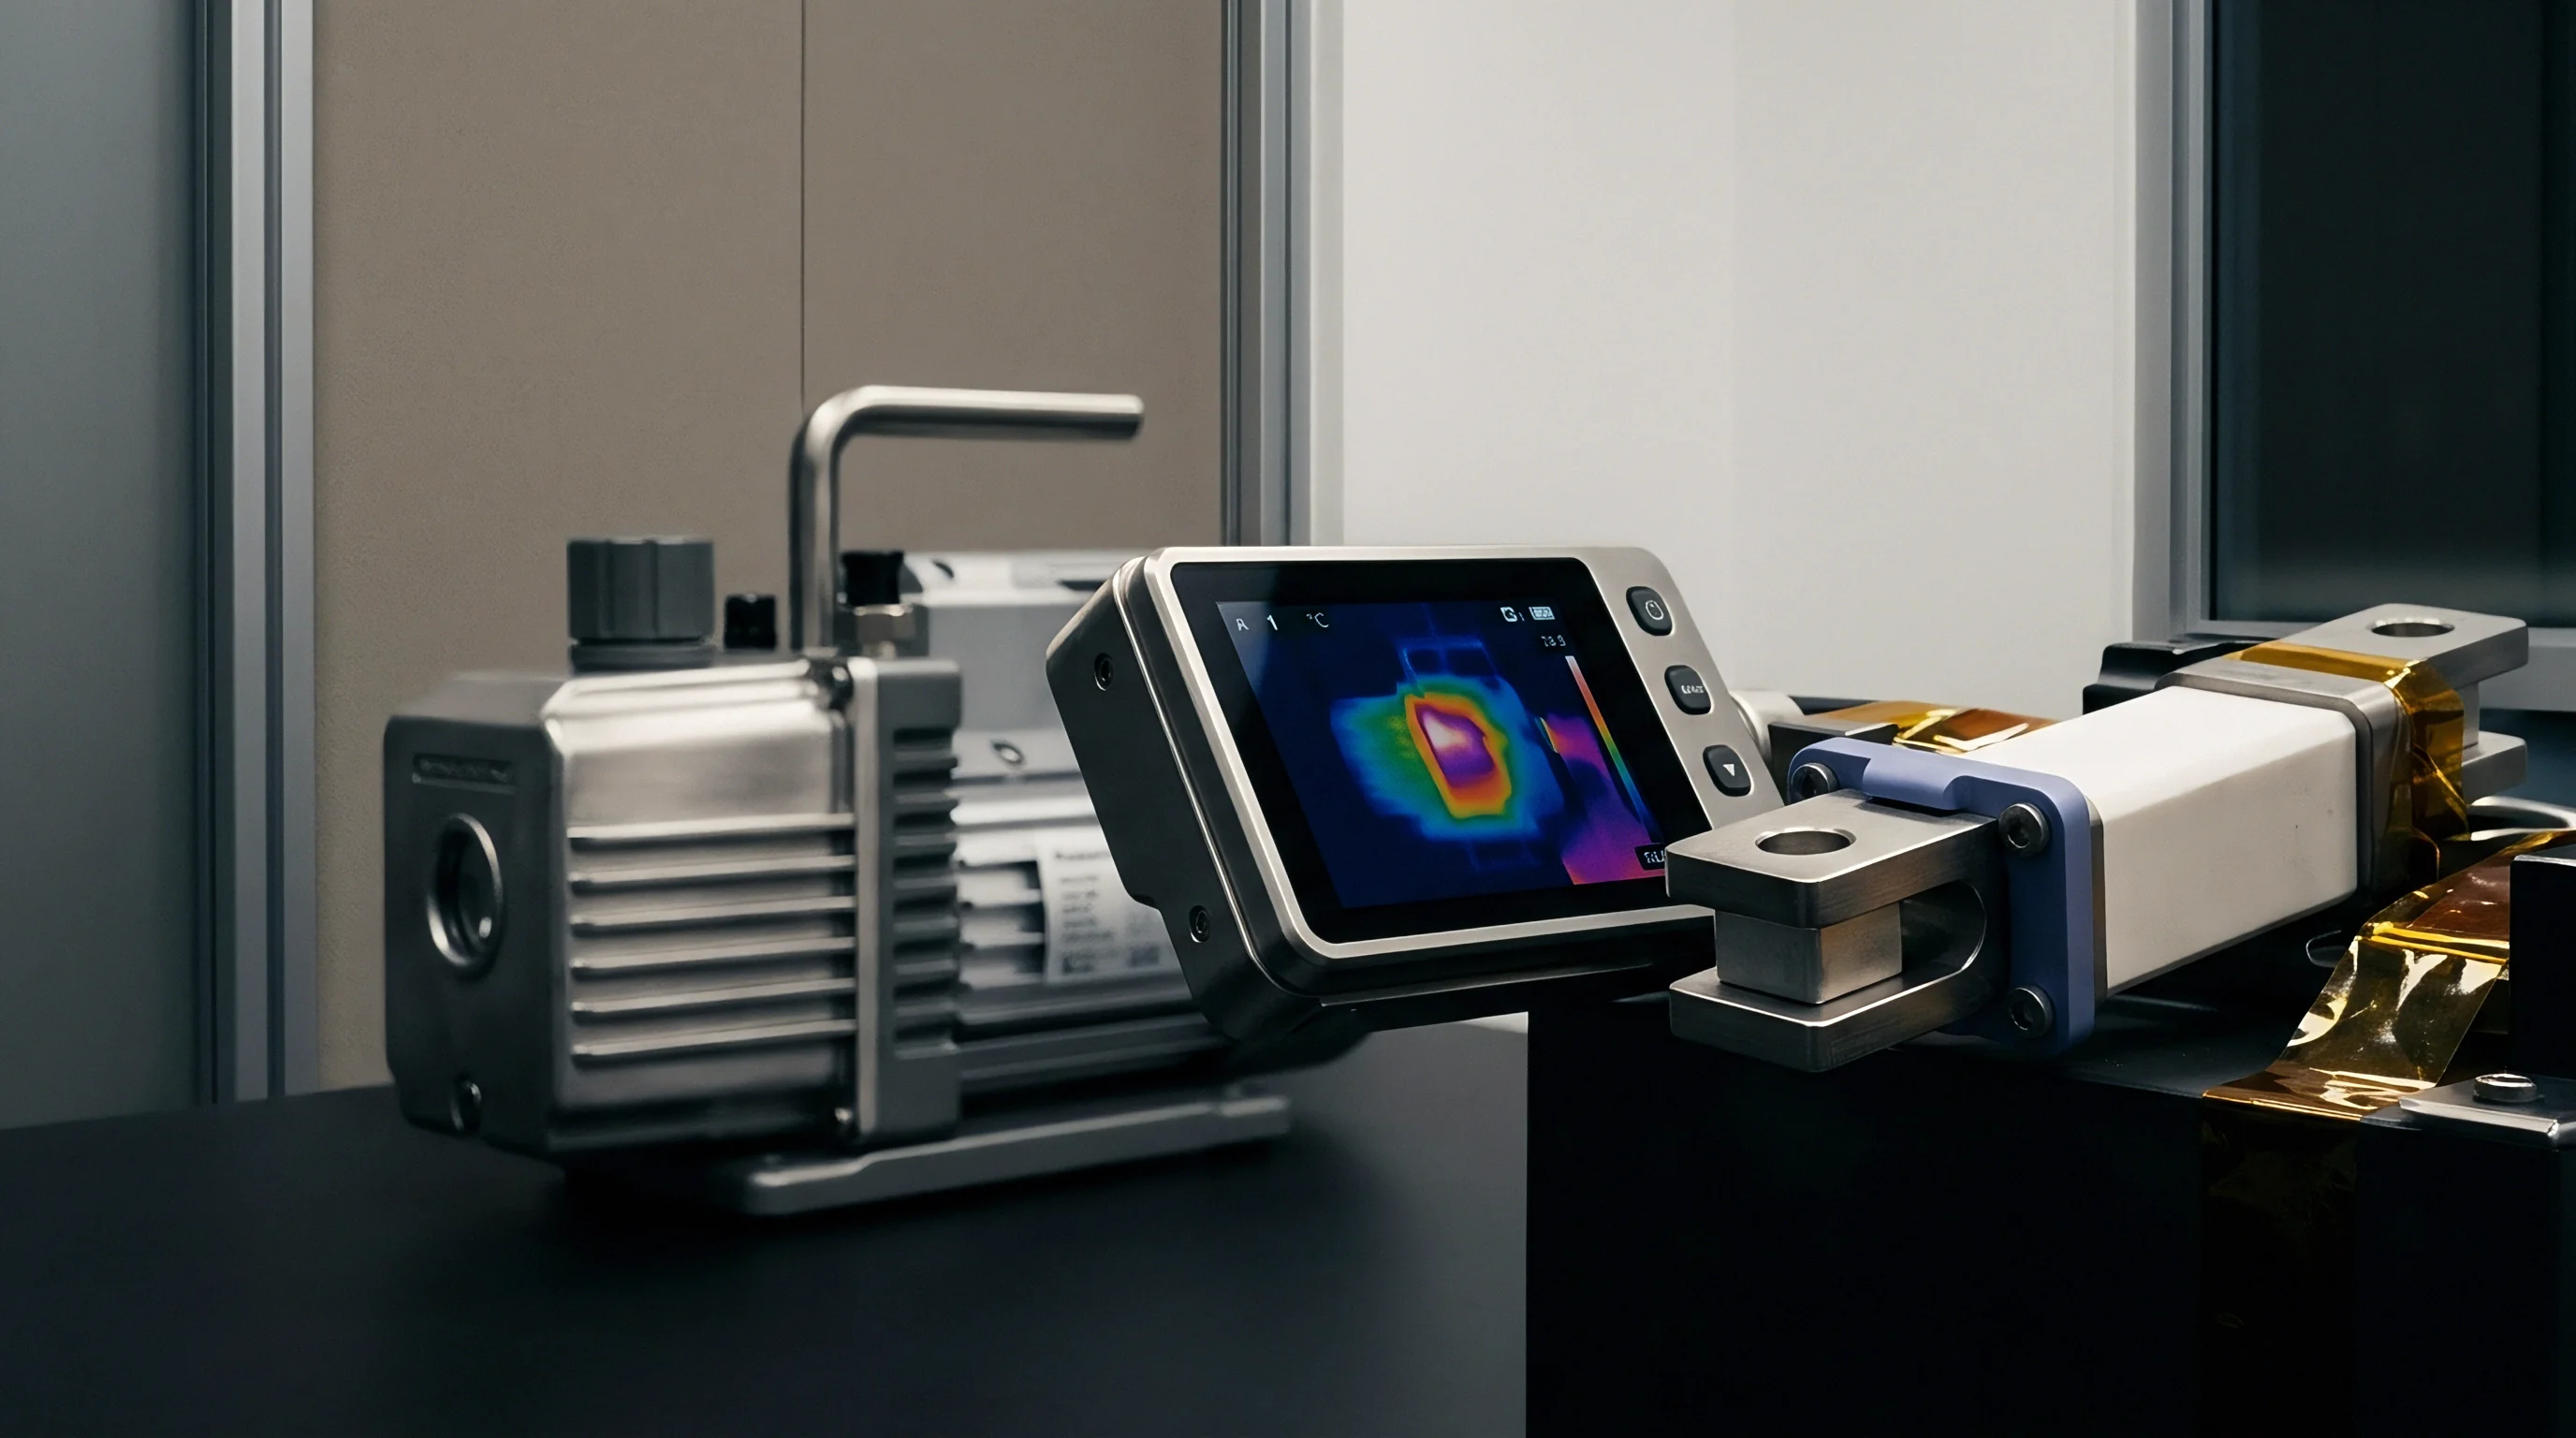
Multi-sine pulse injection cuts spectrum capture times from minutes down to a fraction of a second. By injecting a synthesized wave of five to eight frequencies between 500 Hz and 1 Hz simultaneously, the controller captures the relevant high-to-mid frequency arc in a single evaluation window.
The targeted frequencies depend on core temperature and cell chemistry. For nickel-manganese-cobalt cells at -10 °C, the sensitive window for early plating centers around 250 Hz, 100 Hz, and 10 Hz. For lithium iron phosphate under identical conditions, slower interfacial transfer drops those monitoring targets to 50 Hz, 5 Hz, and 0.5 Hz. Concentrating computing power on these specific points minimizes circuit overhead while safeguarding against dendrite growth.
Standard supply agreements for fast-charging energy storage systems must define non-destructive impedance inspection procedures to validate that subzero charge profiles do not induce active lithium deposition.
Signal-to-Noise Ratio Optimization in Continuous Pulsing
Switching noise from fast-charging station power electronics can obscure the minor impedance shifts caused by lithium plating. Inverters using silicon carbide or gallium nitride switches bleed high-frequency noise into the instrumentation lines above 10 kHz. Installing active analog filters with steep cutoffs attenuates these artifacts ahead of digital conversion.
Synchronous demodulation isolates the perturbation signal from lingering background hash. Multiplying raw voltage feedback against an in-phase reference generated at the perturbation frequency strips out uncorrelated noise, leaving a clean complex impedance reading. This sensitivity keeps slight impedance dips visible even in noisy high-power charging cabinets.
Under supply contract clause Annex B, any cell batch exhibiting more than a 10 percent increase in charge-transfer resistance drift after twenty subzero fast-charge cycles faces rejection at the supplier’s expense.
Ledger
Deploying subzero fast-charging commercial systems requires balancing charge speed against long-term asset health and warranty liabilities. Cell manufacturers regularly publish fast-charge specifications gathered at 25 °C, but those rates fail in subzero operating conditions. Uncontrolled subzero plating permanently strips cycling capacity, consumes cyclable lithium inventory, and heightens the risk of separator breach via dendrite growth.
Factoring subzero degradation into pack management requires feeding impedance thresholds directly into dynamic derating routines. Fixed look-up tables hold current conservatively low across the entire cold band, preserving cells at the expense of vehicle uptime. Dynamic derating guided by live impedance sensing pushes current straight to the plating limit, dialing the rate up as resistive losses heat the core from within.
Translating Impedance Thresholds into Dynamic Charge Derating
Closed-loop charging relies on live charge-transfer resistance as its primary feedback signal. Whenever the online analyzer spots arc flattening or a phase angle collapse signaling plating onset, the management system trims charging current in 5 percent increments. That reduction lowers anode polarization immediately, lifting negative electrode potential back above 0 V versus Li/Li⁺.
As charging continues, internal Joule heating raises core temperature, reducing the desolvation barrier and lifting electrolyte conductivity. Charge-transfer resistance decreases in response, allowing the controller to ramp current back up without triggering new plating. This dynamic loop shaves up to 35 percent off subzero charge times relative to static conservative curves while keeping the graphite surface free of metallic deposits.
| Control Strategy | Charge Time (-10°C, 10-80%) | Cycle Life to 80% Capacity | Total Delivered Energy (MWh) | Landed Cost per Delivered kWh |
|---|---|---|---|---|
| Uncontrolled Fast Charge (2.0C constant) | 28 minutes | 140 cycles | 12.6 | $0.42 |
| Conservative Static Derating | 85 minutes | 1,500 cycles | 135.0 | $0.06 |
| Dynamic EIS-Guided Derating | 42 minutes | 1,250 cycles | 112.5 | $0.07 |
Commercial Quantification of Capacity Loss from Subzero Plating
Unmonitored subzero charging can turn high-energy packs into scrap well before their target service life ends. Field logs from cold-climate fleets indicate that charging below -5 °C without derating speeds up capacity loss by a factor of seven relative to baseline ambient cycling. That cost lands across direct module replacements, towing, and roadside downtime.
Logging impedance data directly into pack health histories provides clear documentation for warranty disputes between pack assemblers, OEMs, and cell vendors. Onboard impedance records show whether lost capacity stems from initial solid electrolyte interphase manufacturing defects or from operational abuse under subzero fast charging. Writing unambiguous impedance thresholds into procurement contracts grounds warranty settlements in physical operational records rather than disputed modeling assumptions.
The financial benefit of impedance monitoring extends to end-of-life residual values. Packs kept free of subzero plating degrade more evenly cell to cell, making them far better candidates for second-life stationary storage. Second-life off-takers demand verified health documentation and will pay higher prices for modules with logged proof that they avoided dendrite-forming subzero charging events during their primary service life.