Evaluating Graphite Anode Lithium Plating during Subzero Fast Charging
Subzero fast charging forces graphite polarization below zero volts, causing metallic lithium plating detectable via voltage relaxation and gas titration.

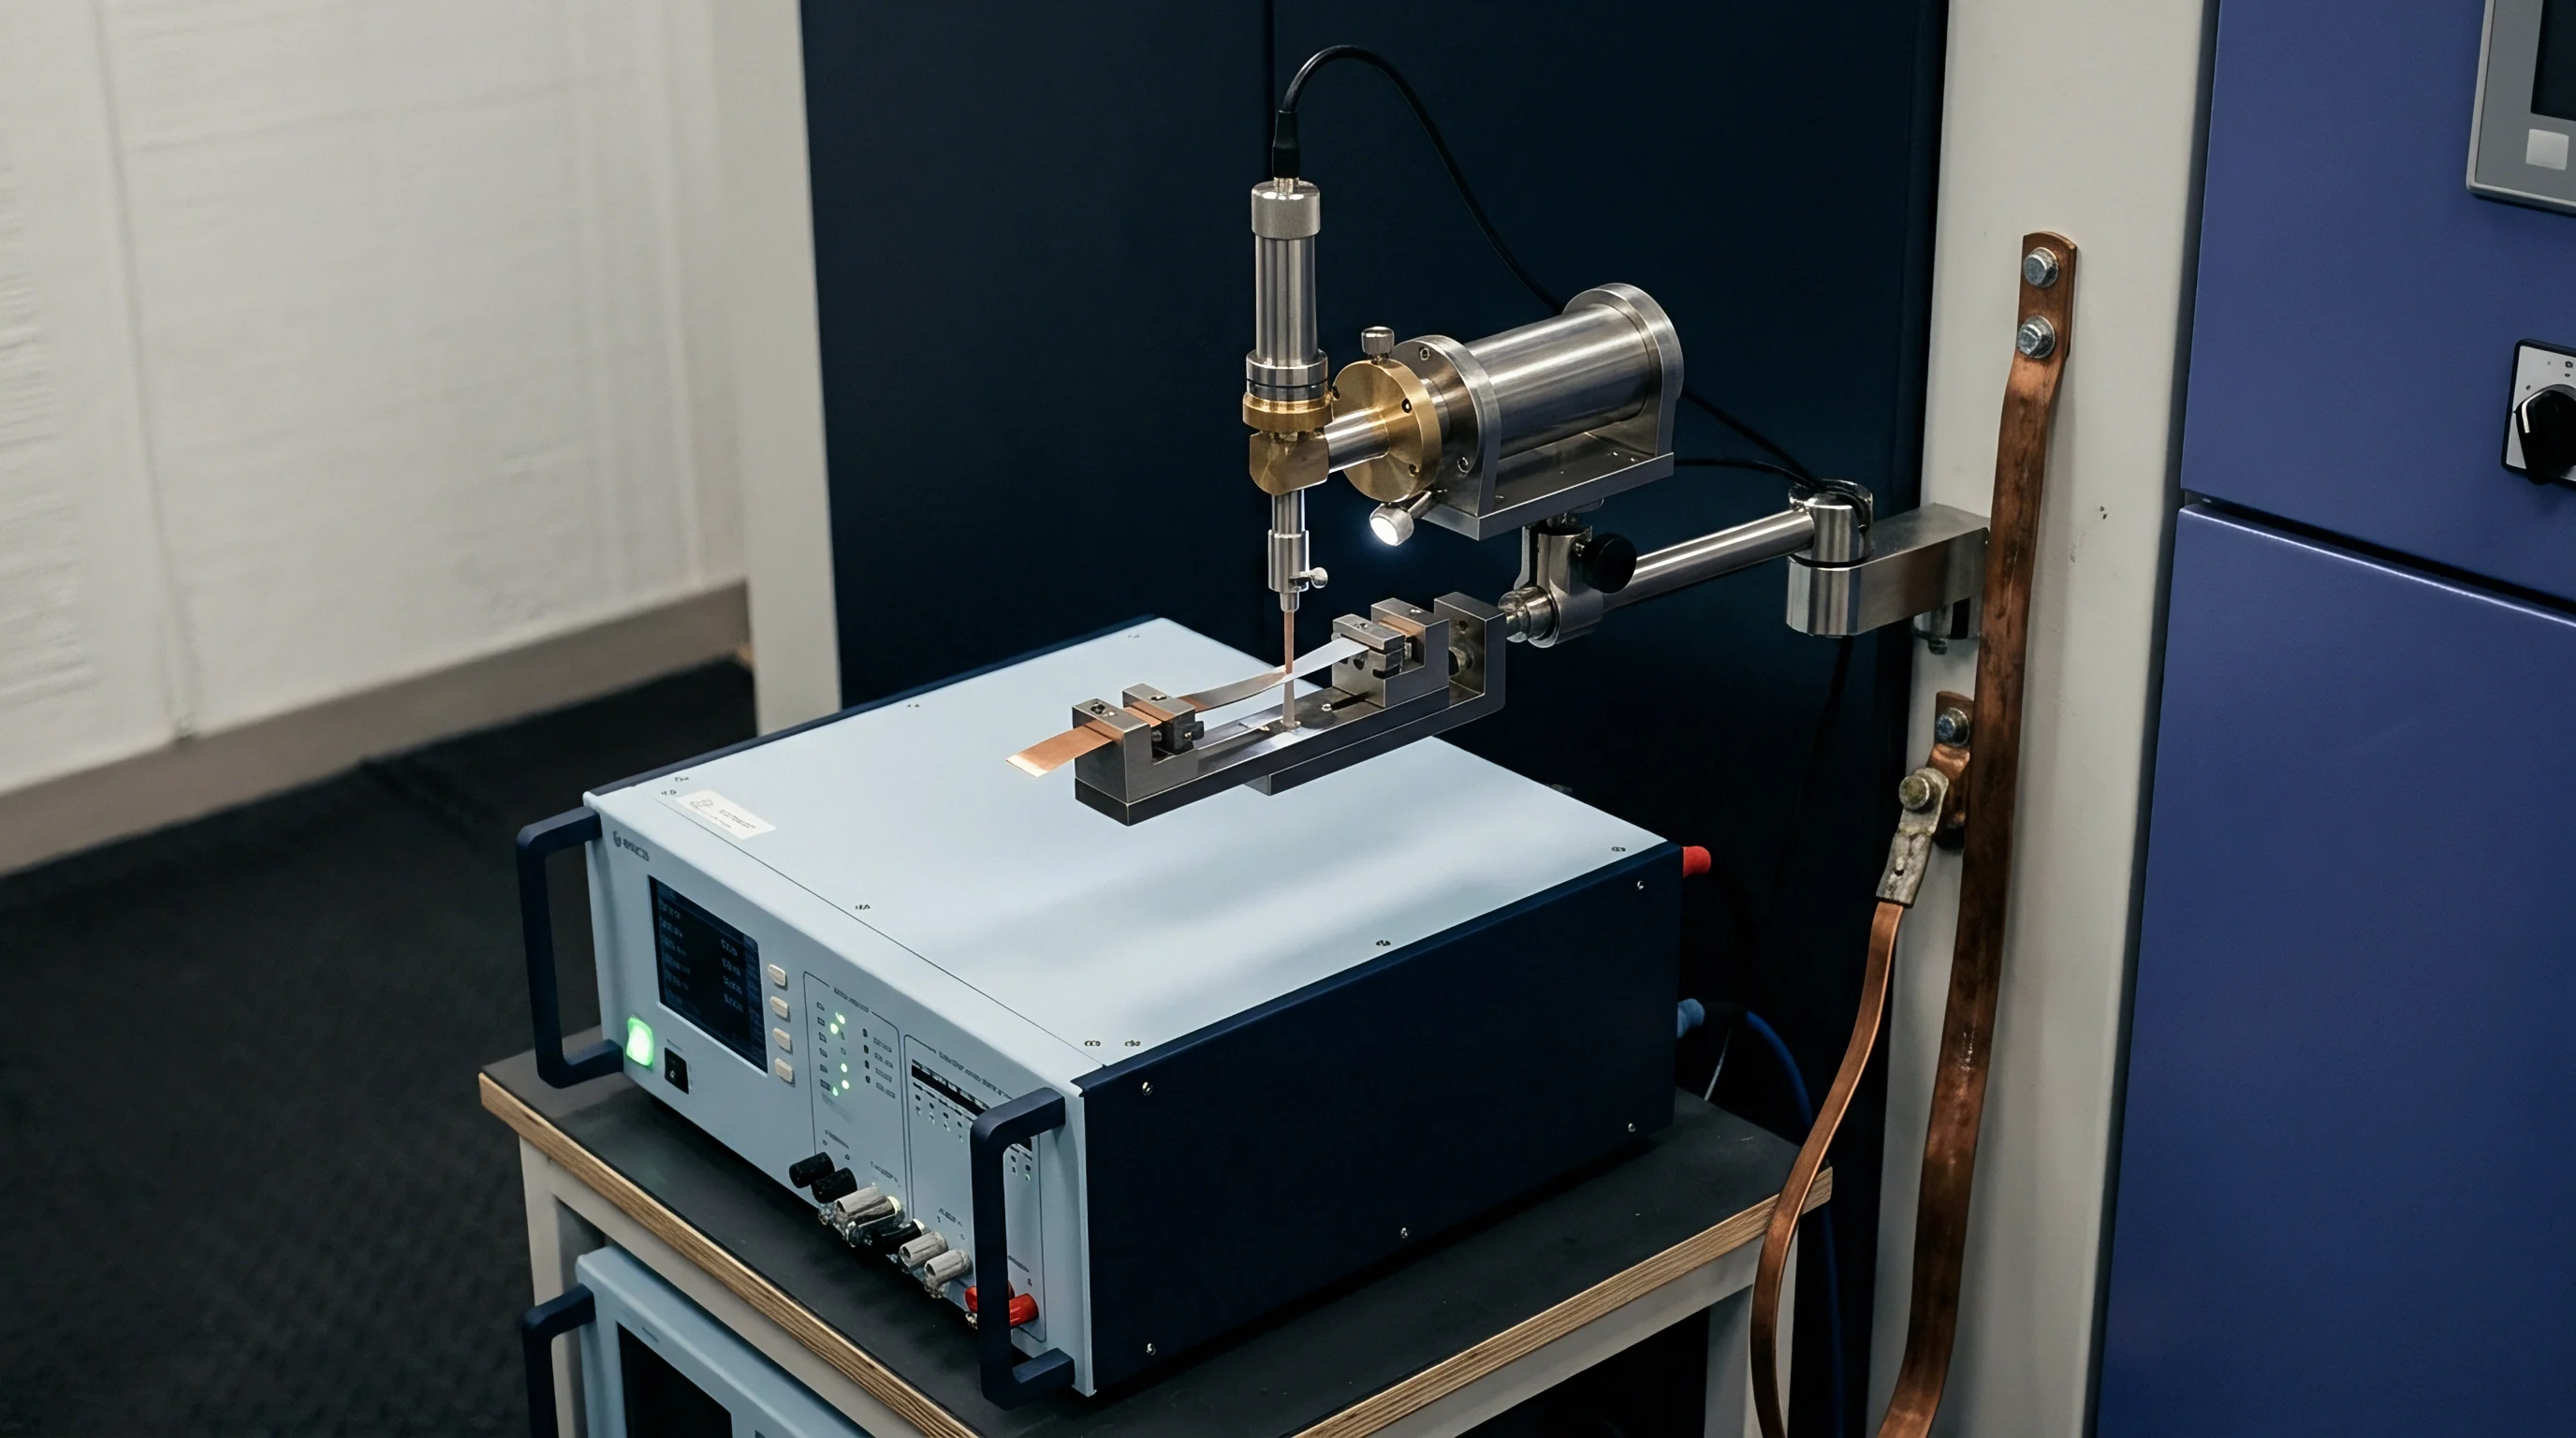
Overpotential

Thermodynamic Thresholds beneath Freezing
Negative electrode polarization governs whether lithium intercalates into the graphite host or deposits as metallic film on the particle surface. At room temperature, the equilibrium potential of graphite staging ranges from 0.20 V down to approximately 0.08 V versus Li/Li⁺ for the LiC₆ phase. When ambient conditions drop beneath 0 °C, the charge-transfer resistance across the solid electrolyte interphase escalates exponentially, while the solid-state diffusion coefficient of lithium ions inside the graphite lattice collapses by two to three orders of magnitude.
Forcing a high charging current through this sluggish interface drives the local negative electrode potential below 0.00 V versus Li/Li⁺. Metallic lithium deposition initiates the moment this threshold crosses negative values.
The total negative electrode potential during current excitation equals the open-circuit potential minus the sum of the ohmic drop, the charge-transfer overpotential, and the solid-state diffusion overpotential. Under high-rate charging at minus 20 °C, the charge-transfer overpotential and concentration gradients dominate the expression. The local overpotential frequently exceeds minus 150 mV at the graphite-separator interface, even while the full-cell terminal voltage remains well below the standard 4.20 V constant-current cutoff.
A cell management system monitoring purely terminal potential misses the onset of metallic plating entirely. The thermodynamic driving force switches from staging insertion to direct electrochemical reduction of solvated lithium ions onto existing metallic seeds.
Plating initiates whenever graphite solid surface polarization forces the local electrode potential negative relative to the lithium reference.
Quantifying this transition requires parsing the distribution of resistance across the operating temperature spectrum. Liquid electrolyte bulk conductivity drops at subzero temperatures, yet the desolvation energy barrier of lithium ions crossing the interphase represents the true kinetic bottleneck. The desolvation activation energy generally sits between 50 kJ/mol and 70 kJ/mol for standard carbonate solvents containing ethylene carbonate.
Table 1 establishes the operational parameter boundaries where graphite anodes transition from pure intercalation to mixed-mode metallic deposition during constant-current steps.
| Temperature (°C) | Diffusion Coefficient (cm²/s) | Charge-Transfer Resistance (Ω·cm²) | Plating Onset C-Rate | Deposition Risk Tier |
|---|---|---|---|---|
| 25 | 1.0 × 10⁻¹⁰ to 5.0 × 10⁻¹⁰ | 5 to 15 | Greater than 2.0C | Negligible |
| 0 | 2.0 × 10⁻¹¹ to 6.0 × 10⁻¹¹ | 40 to 90 | 0.7C to 1.0C | Moderate |
| -10 | 5.0 × 10⁻¹² to 1.5 × 10⁻¹¹ | 120 to 300 | 0.3C to 0.5C | Elevated |
| -20 | 8.0 × 10⁻¹³ to 3.0 × 10⁻¹² | 450 to 1200 | 0.08C to 0.15C | Severe |
| -30 | 1.0 × 10⁻¹³ to 5.0 × 10⁻¹³ | 1800 to 4500 | Less than 0.05C | Critical |
The transition boundary moves based on local particle morphology and electrode coating thickness. Thick industrial coatings with areal capacities above 3.5 mAh/cm² develop severe through-plane concentration gradients. The outer boundary layer adjacent to the separator polarizes into the plating zone while the graphite material near the copper current collector remains underutilized.
Designers specify thin coatings or tiered porosity architectures to delay this crossover, yet subzero charging at rates above 0.5C invariably breaches the thermodynamic limit in standard commercial designs.
A supplier often claims that internal cell warming generated by early high-current pulses safely prevents this overpotential crossover before plating takes root.

Relaxation

Extracting Phase Signatures from Open Circuit Data
Once current interruptions occur, the thermodynamic difference between metallic lithium and intercalated graphite creates a distinct relaxation voltage response. Metallic lithium deposited on graphite surfaces exhibits an open-circuit potential of 0.00 V versus Li/Li⁺. The underlying partially lithiated graphite sits at an open-circuit potential between 0.08 V and 0.15 V versus Li/Li⁺.
This electrochemical mismatch drives a spontaneous chemical reaction during rest periods known as chemical stripping or self-intercalation. The plated metallic lithium dissolves electrochemically into ions, re-intercalating into the adjacent under-saturated graphite particles.
This mixed potential manifests as a distinct voltage plateau during the cell relaxation curve following a cold charge step. The cell terminal voltage rebounds immediately due to the elimination of the ohmic drop, followed by an inflection point and a prolonged secondary plateau before transitioning into standard solid-state diffusion relaxation. The duration of this plateau directly correlates with the quantity of reversible metallic lithium remaining on the graphite surface.
Taking the differential of the relaxation voltage with respect to time isolates this signature with high mathematical precision.
Relaxation curves expose metallic lithium through the differential voltage plateau formed by spontaneous re-intercalation into vacant graphite sites.
Differential voltage analysis calculates dV/dt over the resting period. In a cell without metallic deposition, dV/dt decays monotonically toward zero as concentration gradients equilibrate throughout the electrolyte and active particles. In a cell carrying surface-plated lithium, dV/dt displays an initial decline, forms a distinct valley, rises to a local maximum corresponding to the complete consumption of the reversible metallic layer, and subsequently resumes normal diffusion decay.
Figure tracking and algorithmic extraction of this peak point isolate reversible plating from irreversibly lost inventory.
Irreversible deposition cannot be identified solely through relaxation tracking. A fraction of the metallic lithium reacts directly with liquid electrolyte solvents, forming thick, secondary solid electrolyte interphase products. Another portion loses mechanical contact with the conductive graphite matrix during aggressive dissolution, becoming isolated dead lithium.
Both mechanisms permanently consume active cyclable lithium inventory. The stripping plateau captures only the reversible fraction that successfully re-enters the graphite matrix during the dwell window.
Extracting accurate plateau durations requires strict thermal stabilization. Temperature variations during cell rest induce thermal expansion, change equilibrium open-circuit voltages, and shift electrolyte transport rates. A temperature drift as small as 0.5 °C can distort the dV/dt derivative curve, masking the local peak or generating false positive inflection signals.
Cell screening benches operate within strict liquid-coupled thermal chambers to maintain isothermal boundary conditions across the multi-hour rest sequences.
The method leaves open whether small localized clusters of metallic lithium can dissolve completely into the graphite before the bulk terminal voltage registers a measurable derivative plateau.

Coulometry
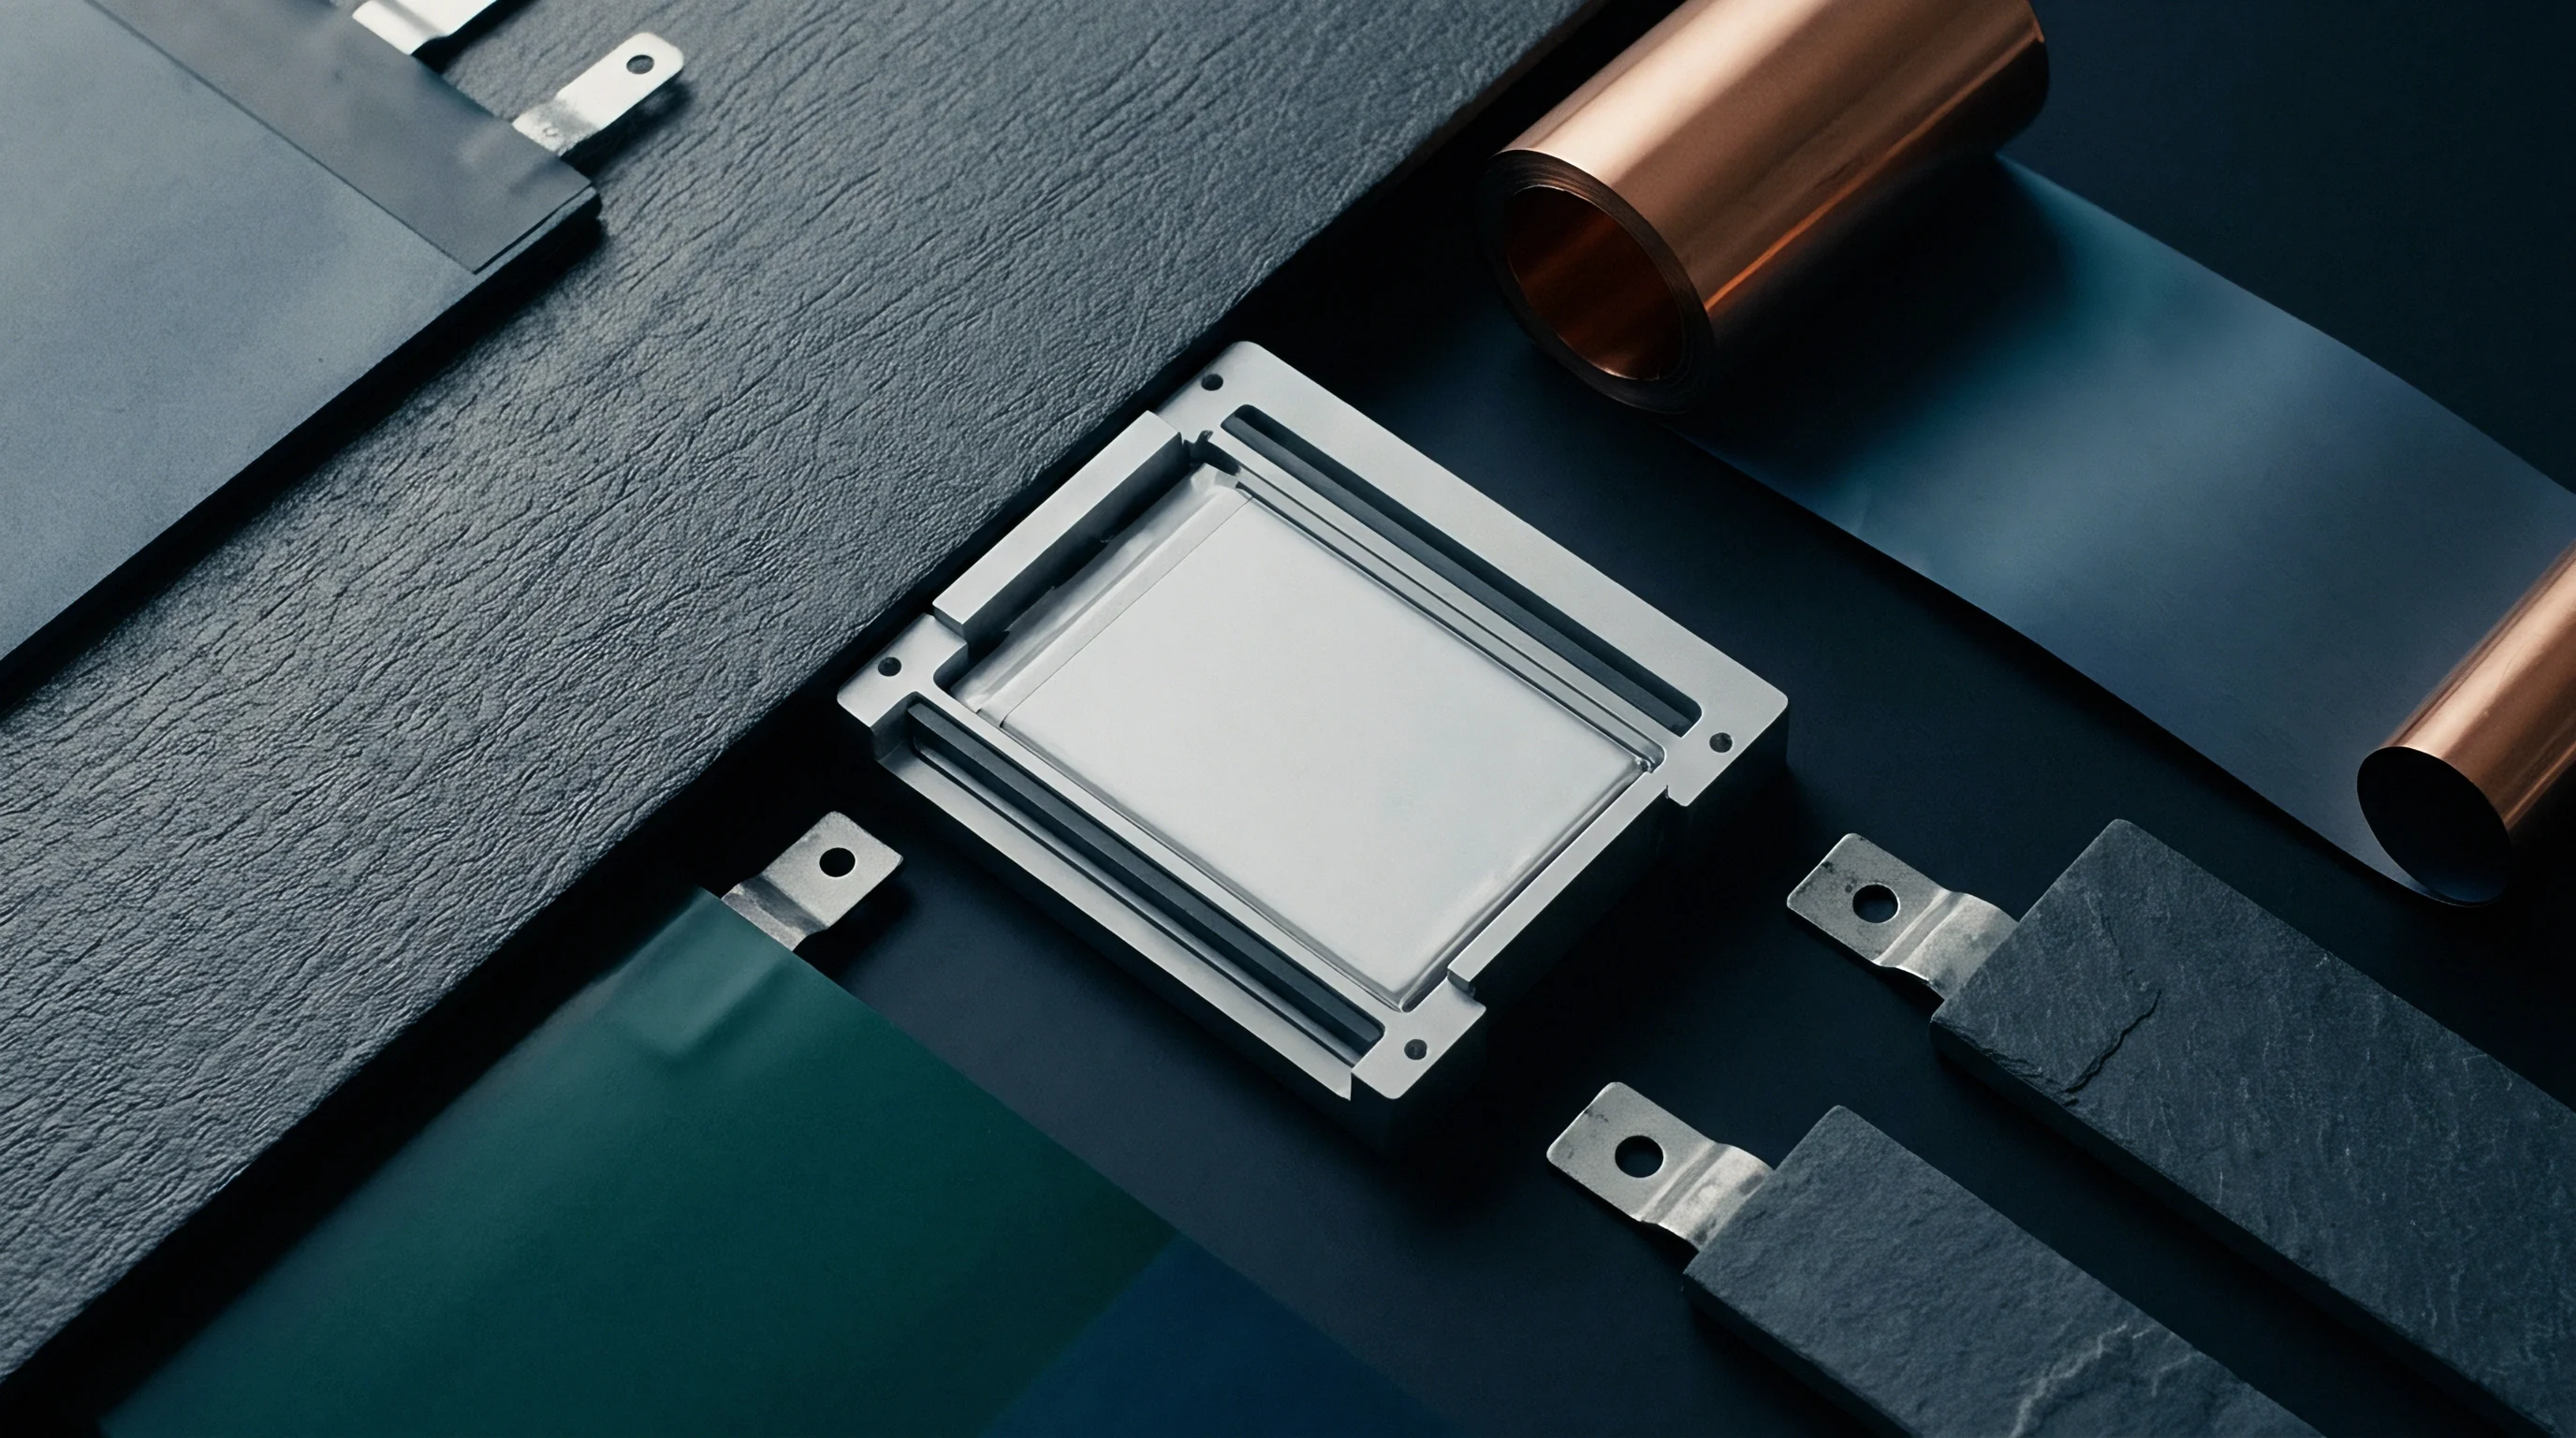
Capacity Discrepancies and Reversible Stripping Yields
Tracking electron flow across controlled charge, rest, and discharge cycles provides the baseline quantitative standard for incoming cell verification. Coulombic efficiency testing isolates active lithium consumption by comparing extracted discharge capacity against injected charge capacity. At room temperature, a stabilized graphite cell exhibits coulombic efficiency exceeding 99.95% under low C-rates.
Subjecting that same cell to fast charging at minus 20 °C induces a sharp drop in immediate cycle efficiency, reflecting both electrolyte reduction reactions and the physical trapping of metallic deposits.
Direct discharge coulometry measures the reversible portion of plated lithium by executing an immediate discharge cycle directly following cold charging without an intervening warm-up. Metallic lithium strips at a slightly lower overpotential than deintercalation from stage-one graphite. In high-resolution differential capacity curves (dQ/dV), this stripping manifests as a distinct low-voltage oxidation peak occurring between 50 mV and 120 mV below the primary graphite deintercalation peaks.
Integrating the area beneath this stripping peak yields the exact milliampere-hour quantity of electrically connected metallic lithium recovered.
Execution of this diagnostic protocol requires precise hardware sequencing across four distinct phases:
- Subzero charge injection drives the specified constant-current or stepped-current fast charge inside an environmental chamber held at the target subzero temperature until reaching the upper safety voltage limit.
- High-speed rest dwell records high-frequency voltage data at intervals no wider than 10 milliseconds for sixty minutes while tracking potential stabilization and dV/dt morphology without changing ambient temperature.
- Subzero diagnostic stripping applies a controlled galvanostatic discharge at 0.1C down to 2.50 V, logging the low-voltage dQ/dV stripping peak area to quantify immediately accessible reversible metallic lithium.
- Thermal recovery deintercalation heats the unconstrained cell to 25 °C over four hours followed by a standard reference performance cycle to assess persistent capacity loss caused by dead lithium formation.
The mathematical discrepancy between injected charge and recovered discharge capacity divides into distinct degradation channels. If a cell receives 2000 mAh at minus 15 °C but returns only 1820 mAh on immediate cold discharge, 180 mAh represents total unrecovered capacity. Upon warming to room temperature, the subsequent reference cycle may recover an additional 90 mAh through thermally accelerated solid diffusion and slow chemical assimilation of isolated clusters.
The remaining 90 mAh permanently vanishes from the cyclable lithium inventory, converted into dead metal fragments and dense fluorinated interphase compounds.
Long-term warranty liabilities compound rapidly when cold charging protocols fail to track this coulometric balance. Unchecked capacity deficits reduce pack field life from several thousand cycles down to fewer than two hundred cycles, transferring substantial replacement expenses to the integrator. Sizing the warranty reserve requires accurate empirical loss rates determined under actual field operational temperatures rather than relying on standard factory specification sheets.
Field operating specifications enforce strict coulometric bounds by stating that any cold charge cycle returning less than 98.0% coulombic efficiency after thermal equilibration constitutes an unapproved operating condition that invalidates cell performance warranties.


Titration
Chemical Quantification of Inactive Lithium Pools
Electrical diagnostics cannot directly distinguish between metallic lithium and parasitic interphase species once active contact breaks. Destructive physical verification resolves this ambiguity through chemical titration of harvested negative electrodes. Operators transfer aged, subzero-cycled cells into an argon-filled glove box maintaining moisture and oxygen levels strictly below 0.1 parts per million.
The cell casing is mechanically breached, the jelly roll or electrode stack extracted, and the graphite active material harvested from the copper current collector without exposure to atmospheric air.
Operando mass spectrometry titration and gas chromatography titration distinguish metallic lithium (Li⁰) from the lithium compounds comprising the interphase (Li₂CO₃, LiF, Li₂O, and alkyl carbonates). When active graphite samples contact pure anhydrous ethanol or purified water inside a closed reaction vessel, metallic lithium reacts rapidly to evolve stoichiometric hydrogen gas. Concurrently, interphase species such as lithium alkyl carbonates hydrolyze into methane, carbon dioxide, or dissolved lithium hydroxide without releasing elemental hydrogen.
Chemical gas titration isolates metallic zero-valent lithium from solid electrolyte interphase compounds by measuring stoichiometric hydrogen gas evolution upon alcohol reaction.
Quantifying the precise volume of evolved hydrogen gas via calibrated gas chromatography provides absolute molar accounting of zero-valent metallic lithium. Comparing this yield against inductively coupled plasma optical emission spectrometry of the total active mass reveals the exact partitioning of lithium inventory. The total inventory splits into intercalated lithium, electrically isolated zero-valent dead lithium, and passivated interphase salt lithium.
Table 2 details typical inventory partitioning observed in graphite electrodes subjected to varying subzero fast-charging severities.
| Cycle Profile | Reversible Intercalated (%) | Dead Metallic Li⁰ (%) | Secondary SEI Compounds (%) | Uncycled Graphite Reserve (%) |
|---|---|---|---|---|
| 0.2C at 0 °C (Baseline) | 88.5 | 0.4 | 2.1 | 9.0 |
| 0.5C at -10 °C | 76.2 | 4.8 | 6.3 | 12.7 |
| 1.0C at -10 °C | 61.3 | 14.2 | 11.8 | 12.7 |
| 0.5C at -20 °C | 54.7 | 18.6 | 13.9 | 12.8 |
| 1.0C at -20 °C | 38.1 | 29.4 | 19.7 | 12.8 |
These destructive analytical findings directly challenge factory-floor life models that treat cold-temperature capacity fade purely as an impedance increase. The presence of significant zero-valent dead lithium fractions explains sudden capacity drop-offs observed during subsequent moderate-temperature use. As metallic deposits crack and shed, they expose fresh underlying graphite, accelerating continuous electrolyte consumption even after benign operating temperatures resume.
A rigorous supply specification mandates periodic destructive gas chromatography titration on qualification cells pulled from life-test chambers to audit that metallic lithium deposits remain beneath 0.5% of total rated capacity under defined cold operating envelopes.


Impedance

Interfacial Dynamics and Non-Destructive Screening
Electrochemical impedance spectroscopy captures the dynamic evolution of cell interfaces during subzero operation without dismantling the hermetic casing. Measuring cell frequency response across a band from 100 kHz down to 10 mHz reveals distinct physical phenomena separated by their characteristic relaxation times. The high-frequency intercept on the real axis marks pure ohmic resistance, encompassing the current collectors, separator porosity, and bulk electrolyte solution.
Intermediate frequency arcs characterize migration through the surface passivating films and charge-transfer resistance across the active interface.
Subjecting a cell to metallic plating alterations drastically shifts this impedance profile. When smooth lithium deposition initiates, the apparent charge-transfer resistance temporarily decreases due to the high surface area of nascent metallic moss and the intrinsically rapid charge-transfer kinetics of lithium deposition compared to graphite intercalation. This temporary drop provides a deceptive signal to basic diagnostic tools.
Once charging terminates and reactive metallic lithium consumes electrolyte, thick secondary surface layers form, driving intermediate-frequency resistance arcs up by several hundred percent within subsequent cycles.
Tracking the growth of low-frequency diffusion characteristics provides a secondary non-destructive marker. The Warburg diffusion impedance reflects the movement of lithium ions through the host solid structure. Severe plating blocks graphite surface pores with passivating reaction debris, choking access paths and distorting the finite-length diffusion response.
Distribution of relaxation times calculations process raw impedance spectra to resolve overlapping intermediate peaks, isolating surface film resistance changes from degradation inside active particle cores.
Incoming inspection docks utilize automated multi-frequency impedance screening at defined low-temperature setpoints to identify cell lots with defective coatings or non-uniform separator wetting. A batch exhibiting an unusually broad charge-transfer semicircle at minus 10 °C presents heightened plating vulnerability. Rejecting these outlier lots at incoming verification prevents assembling cells that would cross the zero-volt negative electrode boundary during standard fast-charging routines in cold environments.
Engineering teams frequently debate whether high-precision automated impedance screening at minus 10 °C reliably predicts field plating thresholds without supplemental three-electrode validation data on every distinct slurry lot.

Protocol

Adaptive Current De-Rating and Safe Operational Boundaries
Preventing metallic plating while maximizing charging speed demands dynamically responsive charging profiles rather than rigid multi-step constant currents. Traditional constant-current constant-voltage protocols hold a single current level until upper cutoff voltage occurs. At subzero temperatures, this practice forces negative electrode polarization below zero volts within the opening minutes of current delivery.
Adaptive protocols continually scale current injection based on instantaneous negative electrode potential estimates generated by onboard electrochemical observers.
An effective subzero charging map relies on multi-dimensional look-up tables or reduced-order physics models running inside the pack controller. The current limit functions as a direct calculation of state of charge, internal cell core temperature, and accumulated cycle aging. Because graphite staging potentials drop as lithium packing density increases, the allowable charging rate decreases sharply as state of charge advances.
A cell capable of accepting 0.5C at 10% state of charge and minus 15 °C may safely accept no more than 0.05C once state of charge reaches 50%.
Engineering a robust cold-charging control structure involves enforcing several non-negotiable operational safeguards:
- Core temperature preheating prioritizers lock out fast-charge current channels until pack internal heating pads or external liquid conditioning systems raise active jelly roll temperatures above 5 °C.
- Dynamic state-of-charge boundaries enforce linear reductions in peak permissible current steps as the cell passes 30% and 60% saturation levels to account for diminishing graphite staging potentials.
- High-resolution voltage relaxation interrogators trigger autonomous micro-rest periods every five minutes during subzero charging to sample dV/dt recovery profiles for metallic plating signatures.
- Autonomous thermal runaway mitigators immediately restrict charging current to a float trickle if intermediate impedance values jump, signaling dangerous dendritic growth across the separator matrix.
Applying pulsed current charging offers an alternative method to mitigate subzero mass transport limits. Short, high-amplitude current pulses alternate with depolarizing discharge pulses or zero-current rest periods. The zero-current or reverse phase allows lithium concentration gradients within the liquid electrolyte boundary layer and particle surfaces to dissipate, drawing the local negative potential back above the dangerous 0.00 V threshold before metallic nucleation solidifies.
Implementing pulse charging adds complexity and cost to power electronics hardware, limiting widespread automotive deployment compared to active liquid preheating.
Implementing an improperly tuned adaptive profile carries extreme consequences. A thermal management failure or inaccurate state-of-charge calculation that allows unmitigated subzero fast charging converts smooth lithium film deposition into needle-like dendritic structures. These crystalline dendrites mechanically pierce thin polymer separators, creating micro-shorts that trigger catastrophic thermal runaway inside sealed modules.

Metallurgy

Morphological Transitions from Moss to Dendritic Failure
Deposited metallic lithium adopts distinct physical architectures governed by local current density, temperature, and mechanical stack pressure. At temperatures above 15 °C, lithium deposits often take the form of smooth, nodular clusters. When conditions plunge below zero, lower adatom surface mobility and severe electrolyte diffusion limitations force metallic lithium into high-aspect-ratio morphologies.
Deposition splits into porous mossy structures and sharp, crystalline dendrites. Mossy lithium features high surface area, accelerating liquid electrolyte decomposition, whereas dendritic needles grow along localized electric field gradients directly toward the positive counter-electrode.
Cryogenic focused ion beam scanning electron microscopy captures these structures in their native state without thermal damage or atmospheric oxidation. Cross-sectional analysis reveals that subzero fast charging initiates metallic nucleation at surface defects, particle edges, and areas where binder coverage is uneven. Once a metallic nucleus establishes electrical contact with the graphite matrix, its localized electric field attracts incoming solvated lithium ions preferentially.
Deposition shifts from thermodynamic insertion across the whole particle surface into localized mass transport feeding the growing metallic tip.
Cryogenic electron microscopy confirms that subzero lithium deposition initiates preferentially along graphite particle edges, transforming into porous moss and high-aspect-ratio needles.
Mechanical compression within the cell module exerts a dominant influence over deposit morphology. Applying uniform mechanical stack pressure between 0.2 MPa and 0.5 MPa forces metallic lithium to grow laterally into available separator pores and particle voids rather than extending long, perpendicular dendrites. However, excessive stack pressure exceeding 1.0 MPa crushes separator porosity, restricts electrolyte diffusion pathways, and exacerbates through-plane concentration gradients.
Cell mechanical clamping systems maintain precise, spring-loaded dimensional constraints to manage volumetric expansion across temperature extremes.
The separator material itself serves as the final physical barrier against dendritic penetration. Standard single-layer polyethylene separators with average pore sizes of 40 nanometers fail rapidly under sustained dendritic pressure. High-performance subzero designs incorporate ceramic coatings composed of alumina or boehmite particles suspended on polyolefin substrates.
The hard inorganic layer deflects dendritic growth laterally, extending the time required for a metallic filament to bridge the inter-electrode gap. Table 3 outlines the structural characteristics and resistance properties of primary separator configurations challenged by subzero metallic lithium growth.
| Separator Architecture | Total Thickness (µm) | Ceramic Layer Thickness (µm) | MacMullin Number | Puncture Strength (gf) |
|---|---|---|---|---|
| Uncoated Porous Polyethylene | 16 | 0 | 7.2 | 380 |
| Single-Side Al₂O₃ Coated PE | 20 | 4 | 9.8 | 520 |
| Double-Side Boehmite Coated PE | 22 | 6 | 11.4 | 610 |
| Ceramic-Impregnated Nonwoven | 25 | Integrated | 6.5 | 750 |
| Polyimide High-Modulus Film | 18 | 0 | 12.8 | 820 |
The physical composition of the solid electrolyte interphase covering metallic lithium differs fundamentally from the protective layer covering pristine graphite. Formed at subzero potentials, the deposition interphase contains elevated ratios of unstable organic species, including semicarbonates and solvent oligomers, alongside brittle inorganic lithium fluoride grains. This non-uniform layer fractures easily under the volume swings of charging and stripping, exposing fresh metallic surfaces to continuous chemical attack.
The resulting parasitic reactions consume available solvent molecules, driving rapid electrolyte dry-out and cell dry-out end-of-life failures.
Compressive mechanical pack architectures that maintain stable face pressures prevent mossy lithium expansion without choking low-temperature liquid transport channels across active layers.

Qualification

Audit Standards and Manufacturing Acceptance Gates
Validating that production cells resist subzero plating requires clear contractual criteria embedded directly into purchase agreements and quality control documentation. Factory datasheets often obscure subzero fast-charging risks by reporting cycle-life metrics derived exclusively at 25 °C. An engineering buyer auditing cell production lines validates that the manufacturer implements dedicated testing protocols designed to identify low-temperature plating thresholds before approving batch shipments.
A rigorous qualification file cross-references international battery standards while enforcing stricter internal operational benchmarks. Standard safety certifications, such as IEC 62133 and UL 1642, assess safety under gross mechanical, electrical, and thermal abuse. They do not evaluate operational degradation or sub-surface dendrite accumulation caused by cold charging.
Buyers enforce tailored qualification testing cycles that combine low-temperature continuous cycling with intermediate high-temperature dwell storage to force short circuits in cells harboring dormant metallic lithium filaments.
Incoming inspection procedures deploy a multi-tiered screening cascade to intercept non-compliant cells at receiving docks:
- Automated low-temperature impedance profiling measures batch samples inside a minus 10 °C environmental chamber across frequencies from 1 kHz to 0.1 Hz to identify lots exhibiting elevated charge-transfer resistance distributions.
- Diagnostic low-temperature fast-charge cycles apply the buyer-specified cold-charging profile for twenty consecutive cycles on sample groups, followed by sixty-minute voltage relaxation logging to detect dV/dt plateau development.
- Destructive chemical gas chromatography titration breaks down two cells per manufacturing lot following the cold cycling matrix to verify that accumulated zero-valent metallic lithium remains below 0.1% of nominal capacity.
- High-temperature post-exposure storage screening places cold-cycled qualification cells into a 45 °C soak chamber for fourteen days while tracking daily open-circuit potential decay to identify internal micro-shorts driven by dendritic separator degradation.
The commercial consequences of omitting these manufacturing gates appear directly in corporate balance sheets. When cells subject to subzero fast charging develop internal dendrites, field failures manifest months after product deployment. Recall costs, pack replacement labor, and warranty claims frequently exceed initial cell purchase costs by a factor of ten.
The purchasing contract must specify that supplier claims regarding low-temperature fast-charge resilience must be substantiated by full three-electrode laboratory test dossiers and coulometric data packages signed by the quality director before release.
Standard master purchase agreements secure this operational boundary by stating that any batch exhibiting evidence of metallic lithium deposition exceeding 50 mAh during reference qualification cycles is subject to total lot rejection at the supplier’s expense.