LiFePO4 Cycle Life Claims under Real Test Conditions
Datasheet cycle life claims overestimate real field performance by up to 45 percent under uncompressed thermal dynamic stress envelopes.

Rig
Inside manufacturing plants, cycle testing takes place under strictly guarded conditions. Testing rooms hold a steady twenty-five degrees Celsius, plus or minus two degrees, backed by active HVAC displacement to eliminate hot spots. Automated cyclers deliver clean direct current without the harmonic distortion or high-frequency ripple generated by solar inverters and industrial drives.
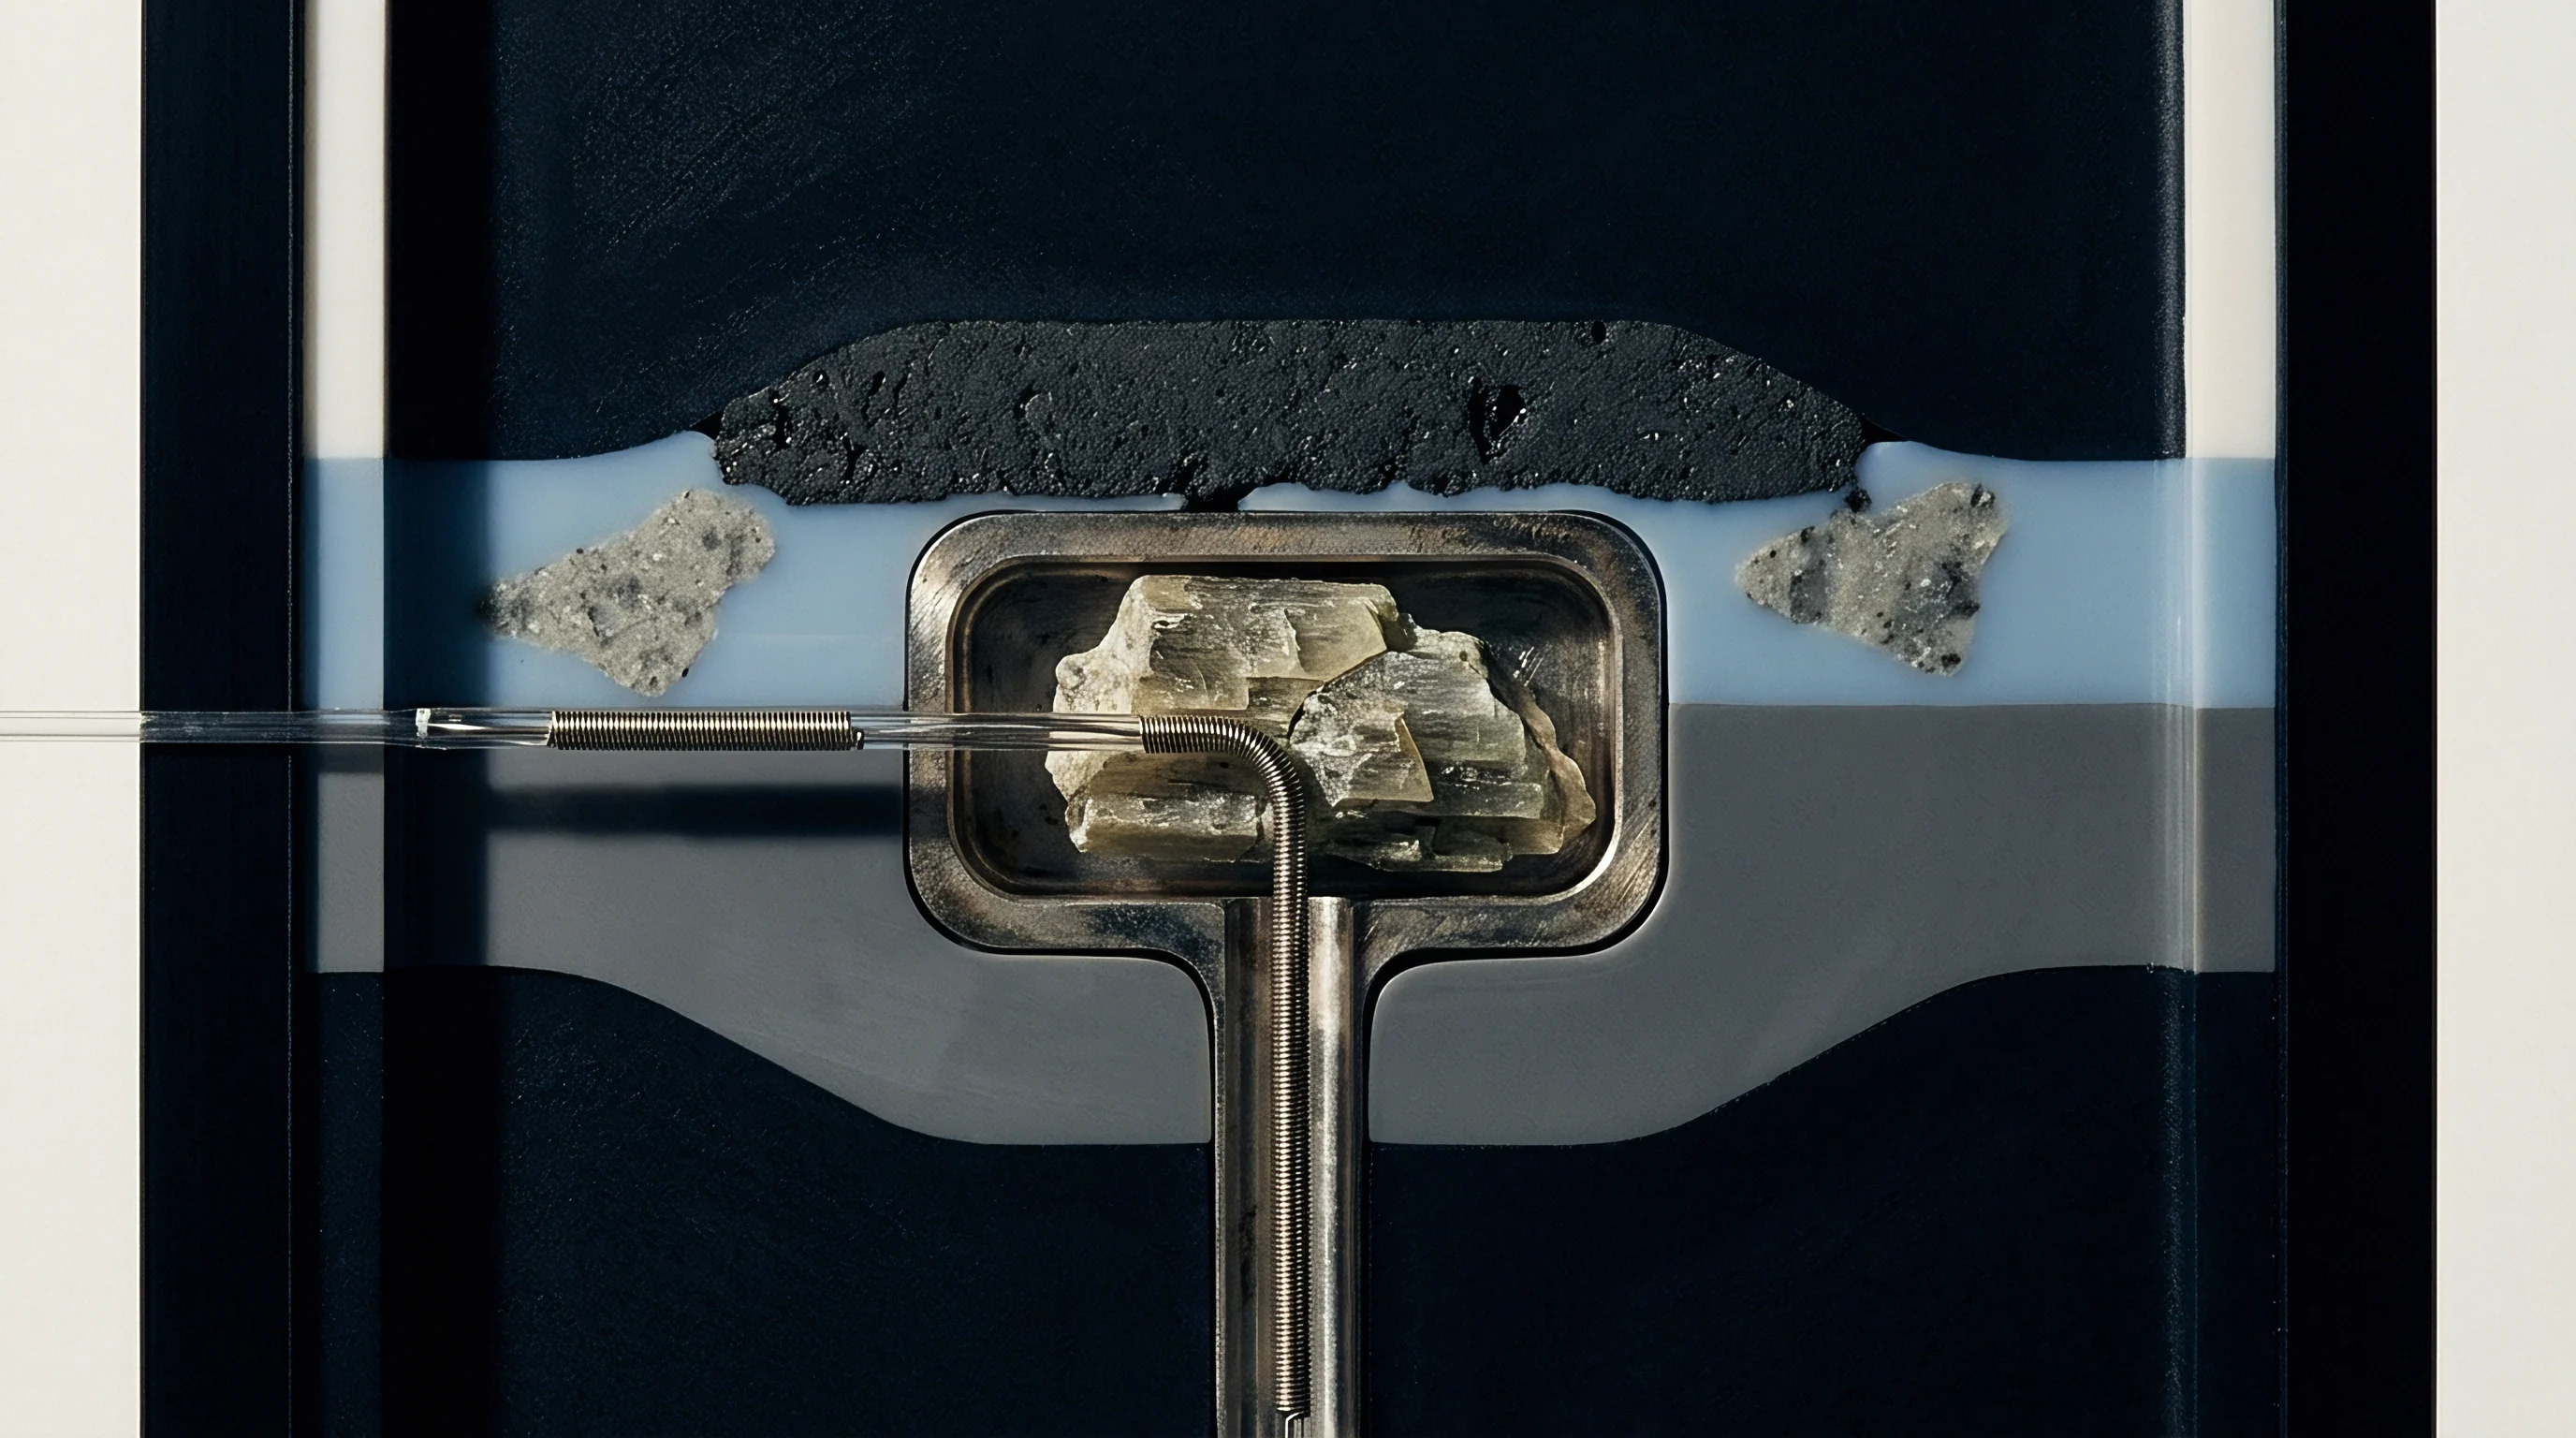
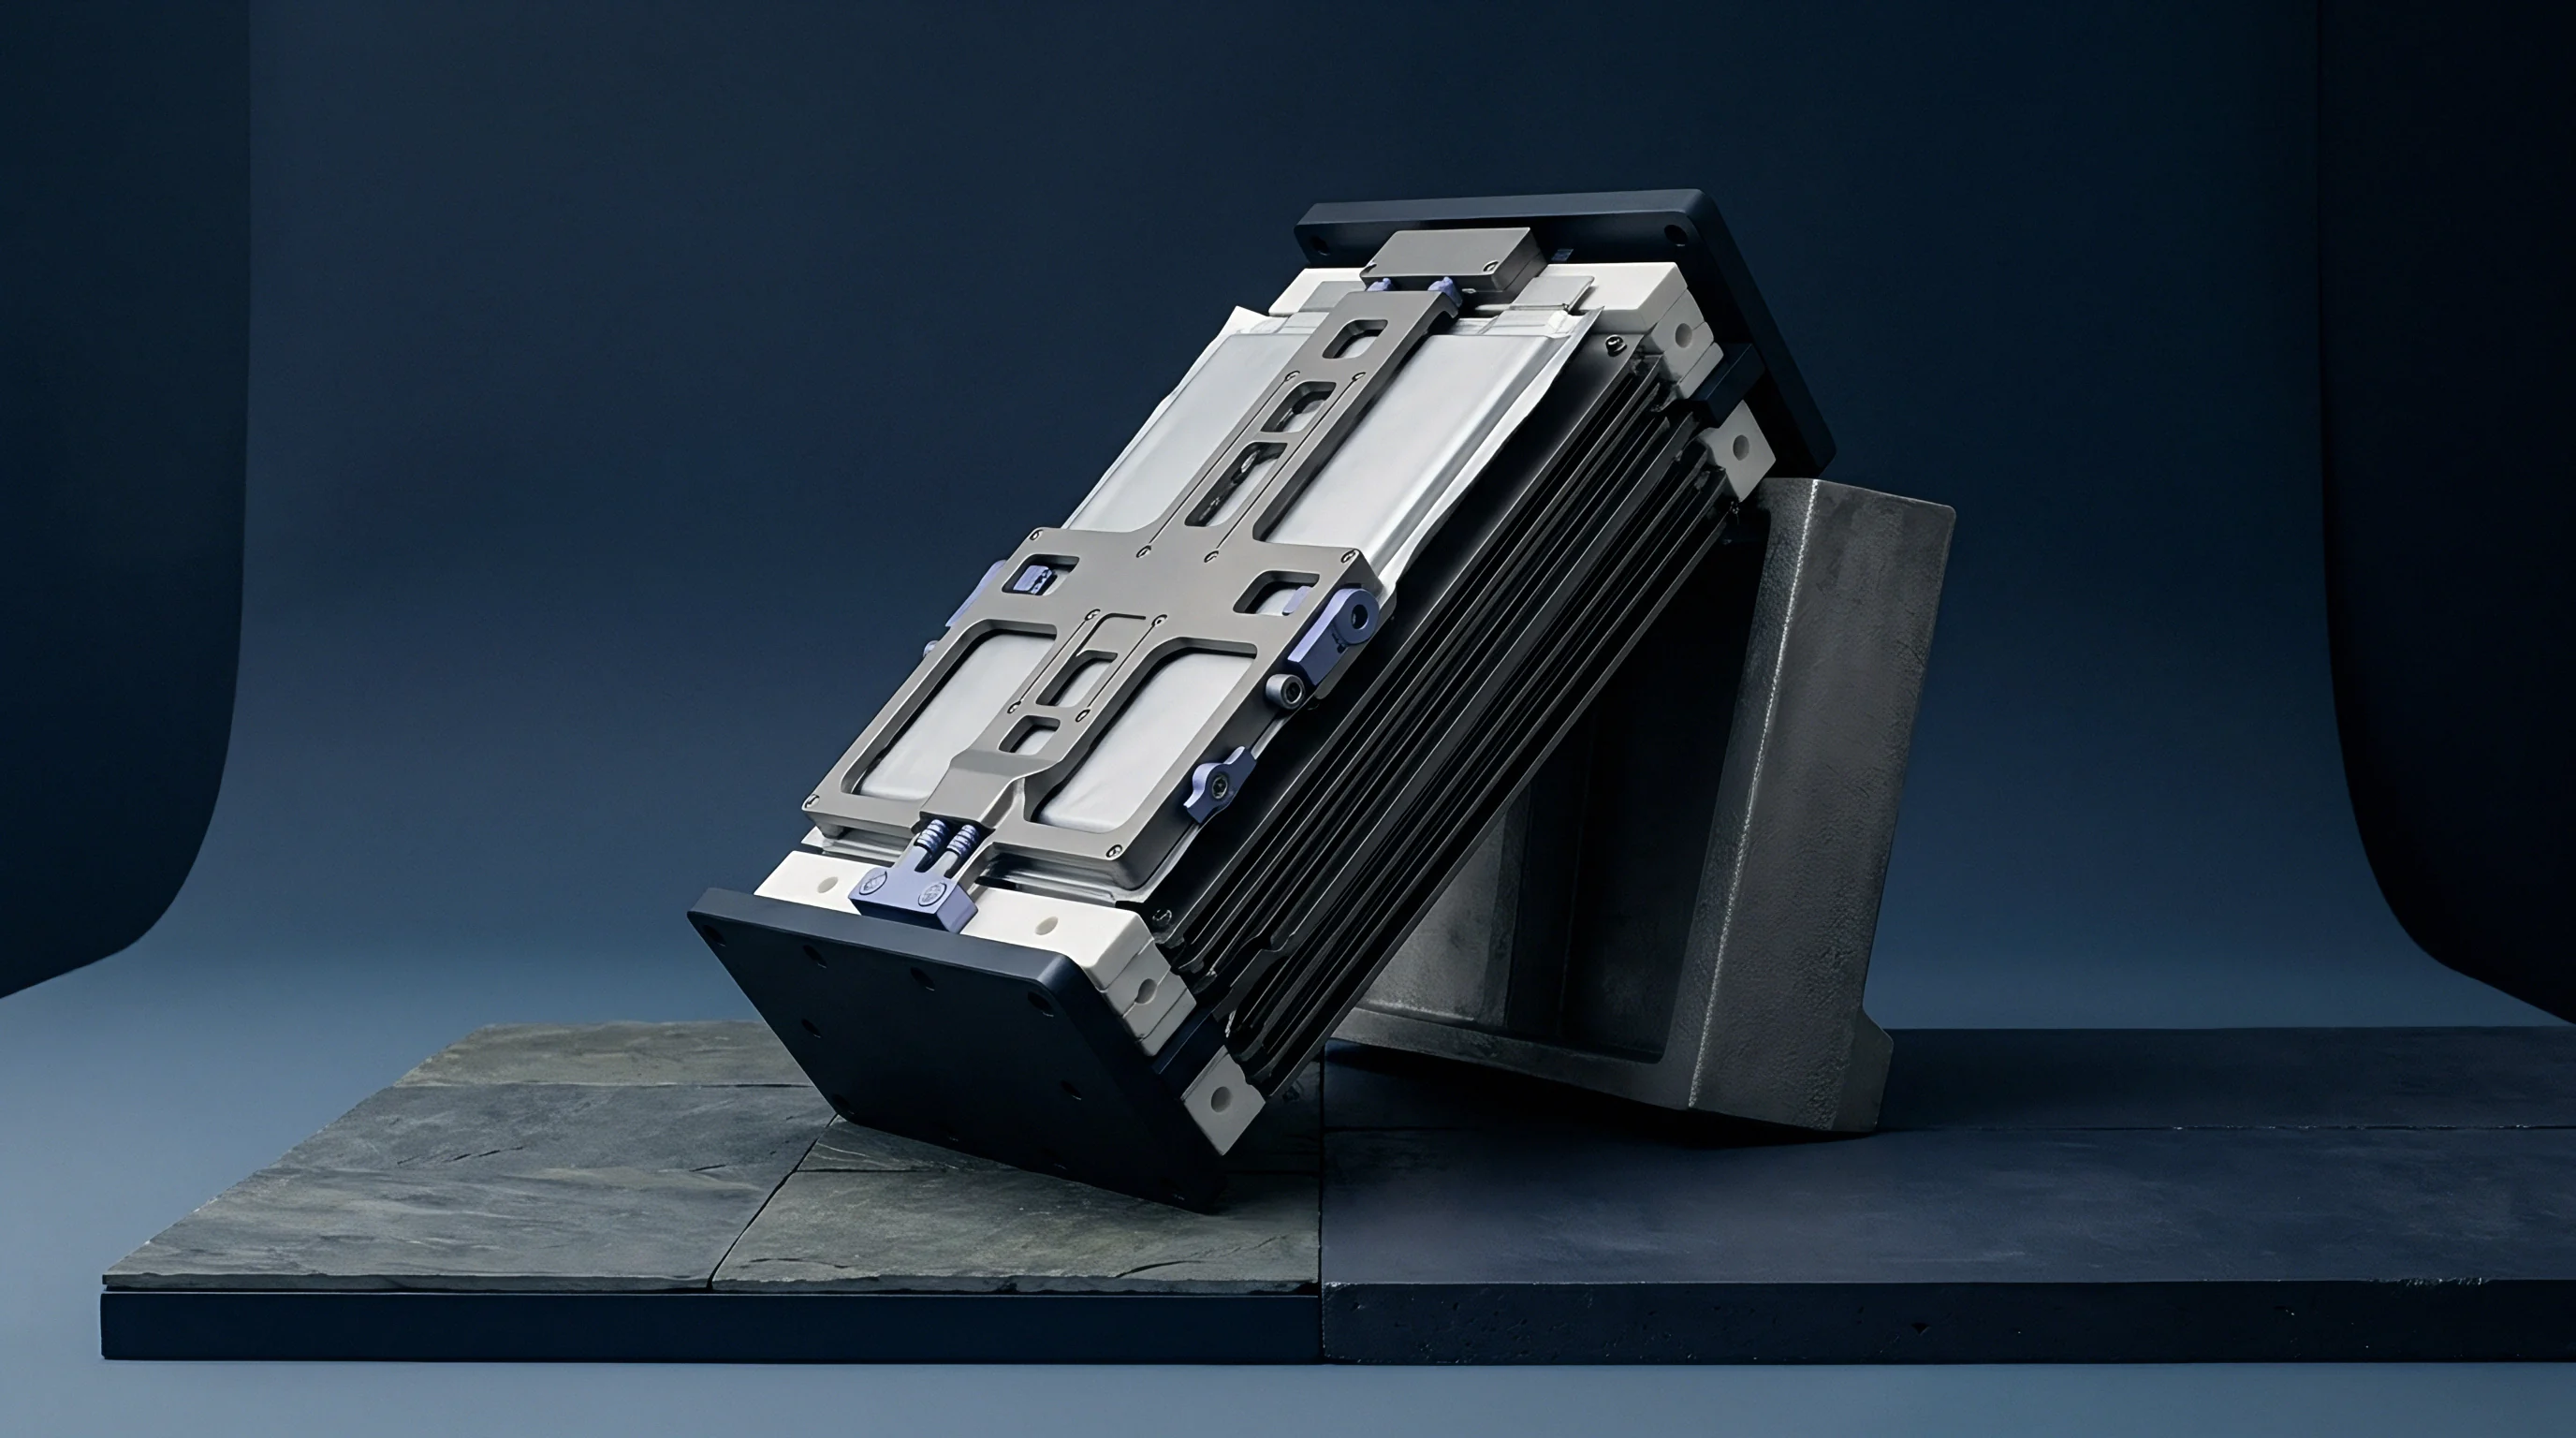
Rigid fixtures apply constant mechanical pressure across the broad faces of prismatic cells via calibrated aluminum end-plates and torque-rated springs. Datasheet claims of six thousand or eight thousand cycles to eighty percent state of health are derived entirely from these ideal bench setups. Placing that same lithium iron phosphate cell into an outdoor energy storage enclosure or heavy vehicle traction pack breaks those baseline assumptions immediately.
Real-world duty cycles rarely permit continuous, low-rate cycling at room temperature. Solar storage demands aggressive charging during peak solar windows, followed by prolonged discharge through evening peaks. Industrial mobility relies on sharp discharge spikes followed directly by high-temperature opportunity charging.
These demands elevate internal core temperatures, alter interfacial reaction kinetics, and accelerate structural degradation across both the lithium iron phosphate cathode and the graphite anode. Evaluating cycle life claims requires breaking down factory qualification parameters and comparing them directly against actual operating stresses.

Datasheet Cycling versus Field Operating Environments
Standard factory paperwork quotes four thousand to eight thousand cycles under mild laboratory baselines. A typical reference bench profile charges at zero-point-five C and discharges at zero-point-five C, allowing two hours for a full sweep in either direction. Ambient conditions remain fixed at twenty-five degrees Celsius, with cut-off voltages bounded strictly between two-point-five volts and three-point-six-five volts per cell.
A thirty-minute rest separates each charge and discharge phase, allowing internal diffusion gradients to balance and internal heat to dissipate before the next transition.
Field installations face far harsher environments. Enclosure interiors in hot climates routinely reach thirty-five to forty-five degrees Celsius during summer operation. Commercial storage systems frequently push charge rates to zero-point-seven-five C or one C during peak generation to avoid grid curtailment.
Continuous load swings eliminate rest intervals, keeping cells under unbroken electrical and thermal stress. As operating conditions pull away from factory baselines, usable cycle counts fall well short of datasheet figures.
Standard 0.5C charge and 0.5C discharge testing at 25 degrees Celsius overestimates field operational life by 35 percent under ambient 40 degrees Celsius working environments.
Continuous cycling generates resistive heat proportional to the square of the current multiplied by cell internal resistance. In large prismatic formats ~ such as 280 Ah or 314 Ah cells ~ heat generated deep within the core accumulates faster than the outer aluminum casing can reject it. Core temperatures frequently run eight to twelve degrees Celsius above surface measurements.
Running at these elevated internal temperatures accelerates parasitic side reactions between the liquid electrolyte and active electrode materials, driving rapid capacity loss.

Thermal Discrepancies in Life Expectancy Benchmarking
Baseline qualification keeps climate chambers locked at twenty-five degrees Celsius. However, Arrhenius kinetics dictate that parasitic chemical reactions roughly double in rate for every ten-degree Celsius rise. Cycling a cell at forty degrees Celsius instead of twenty-five significantly accelerates the growth of the solid electrolyte interphase on the anode.
Simultaneously, electrolyte solvent oxidation at the cathode speeds up, consuming active lithium inventory and permanently degrading usable storage capacity.
Sub-ambient operation is equally destructive to cycle life. Charging below fifteen degrees Celsius increases overpotential at the graphite anode, pulling the lithium ion reduction potential below zero volts against a metallic lithium reference. Instead of intercalating cleanly into the graphite lattice, metallic lithium plates directly onto the anode surface.
This plated lithium reacts irreversibly with electrolyte solvents to form resistive compounds, permanently removing active lithium from circulation. Over extended operation, chronic cold charging shifts the primary failure mechanism from linear fade to sudden internal micro-shorting.
Thermal gradients across multi-cell modules further compound degradation rates. In high-density battery racks, centrally located cells cannot shed heat as readily as those on the module perimeter. These interior units operate at higher baseline temperatures, degrading faster and creating persistent capacity imbalances across series-connected strings.
Because string capacity is constrained by its weakest cell, useful module operation often ends long before the average cell reaches eighty percent of its initial rating.
Mechanical Clamping and Physical Constraint Variations
Prismatic lithium iron phosphate cells physically expand and contract as lithium shuttles between electrodes. During charge, as lithium ions de-intercalate from the cathode’s olivine crystal matrix and enter the graphite anode, the anode lattice expands by approximately ten percent. Discharge reverses this volumetric shift.
Without proper physical restraint, continuous expansion and contraction generates mechanical fatigue across the electrode stack, eventually causing active coatings to delaminate from current collector foils.
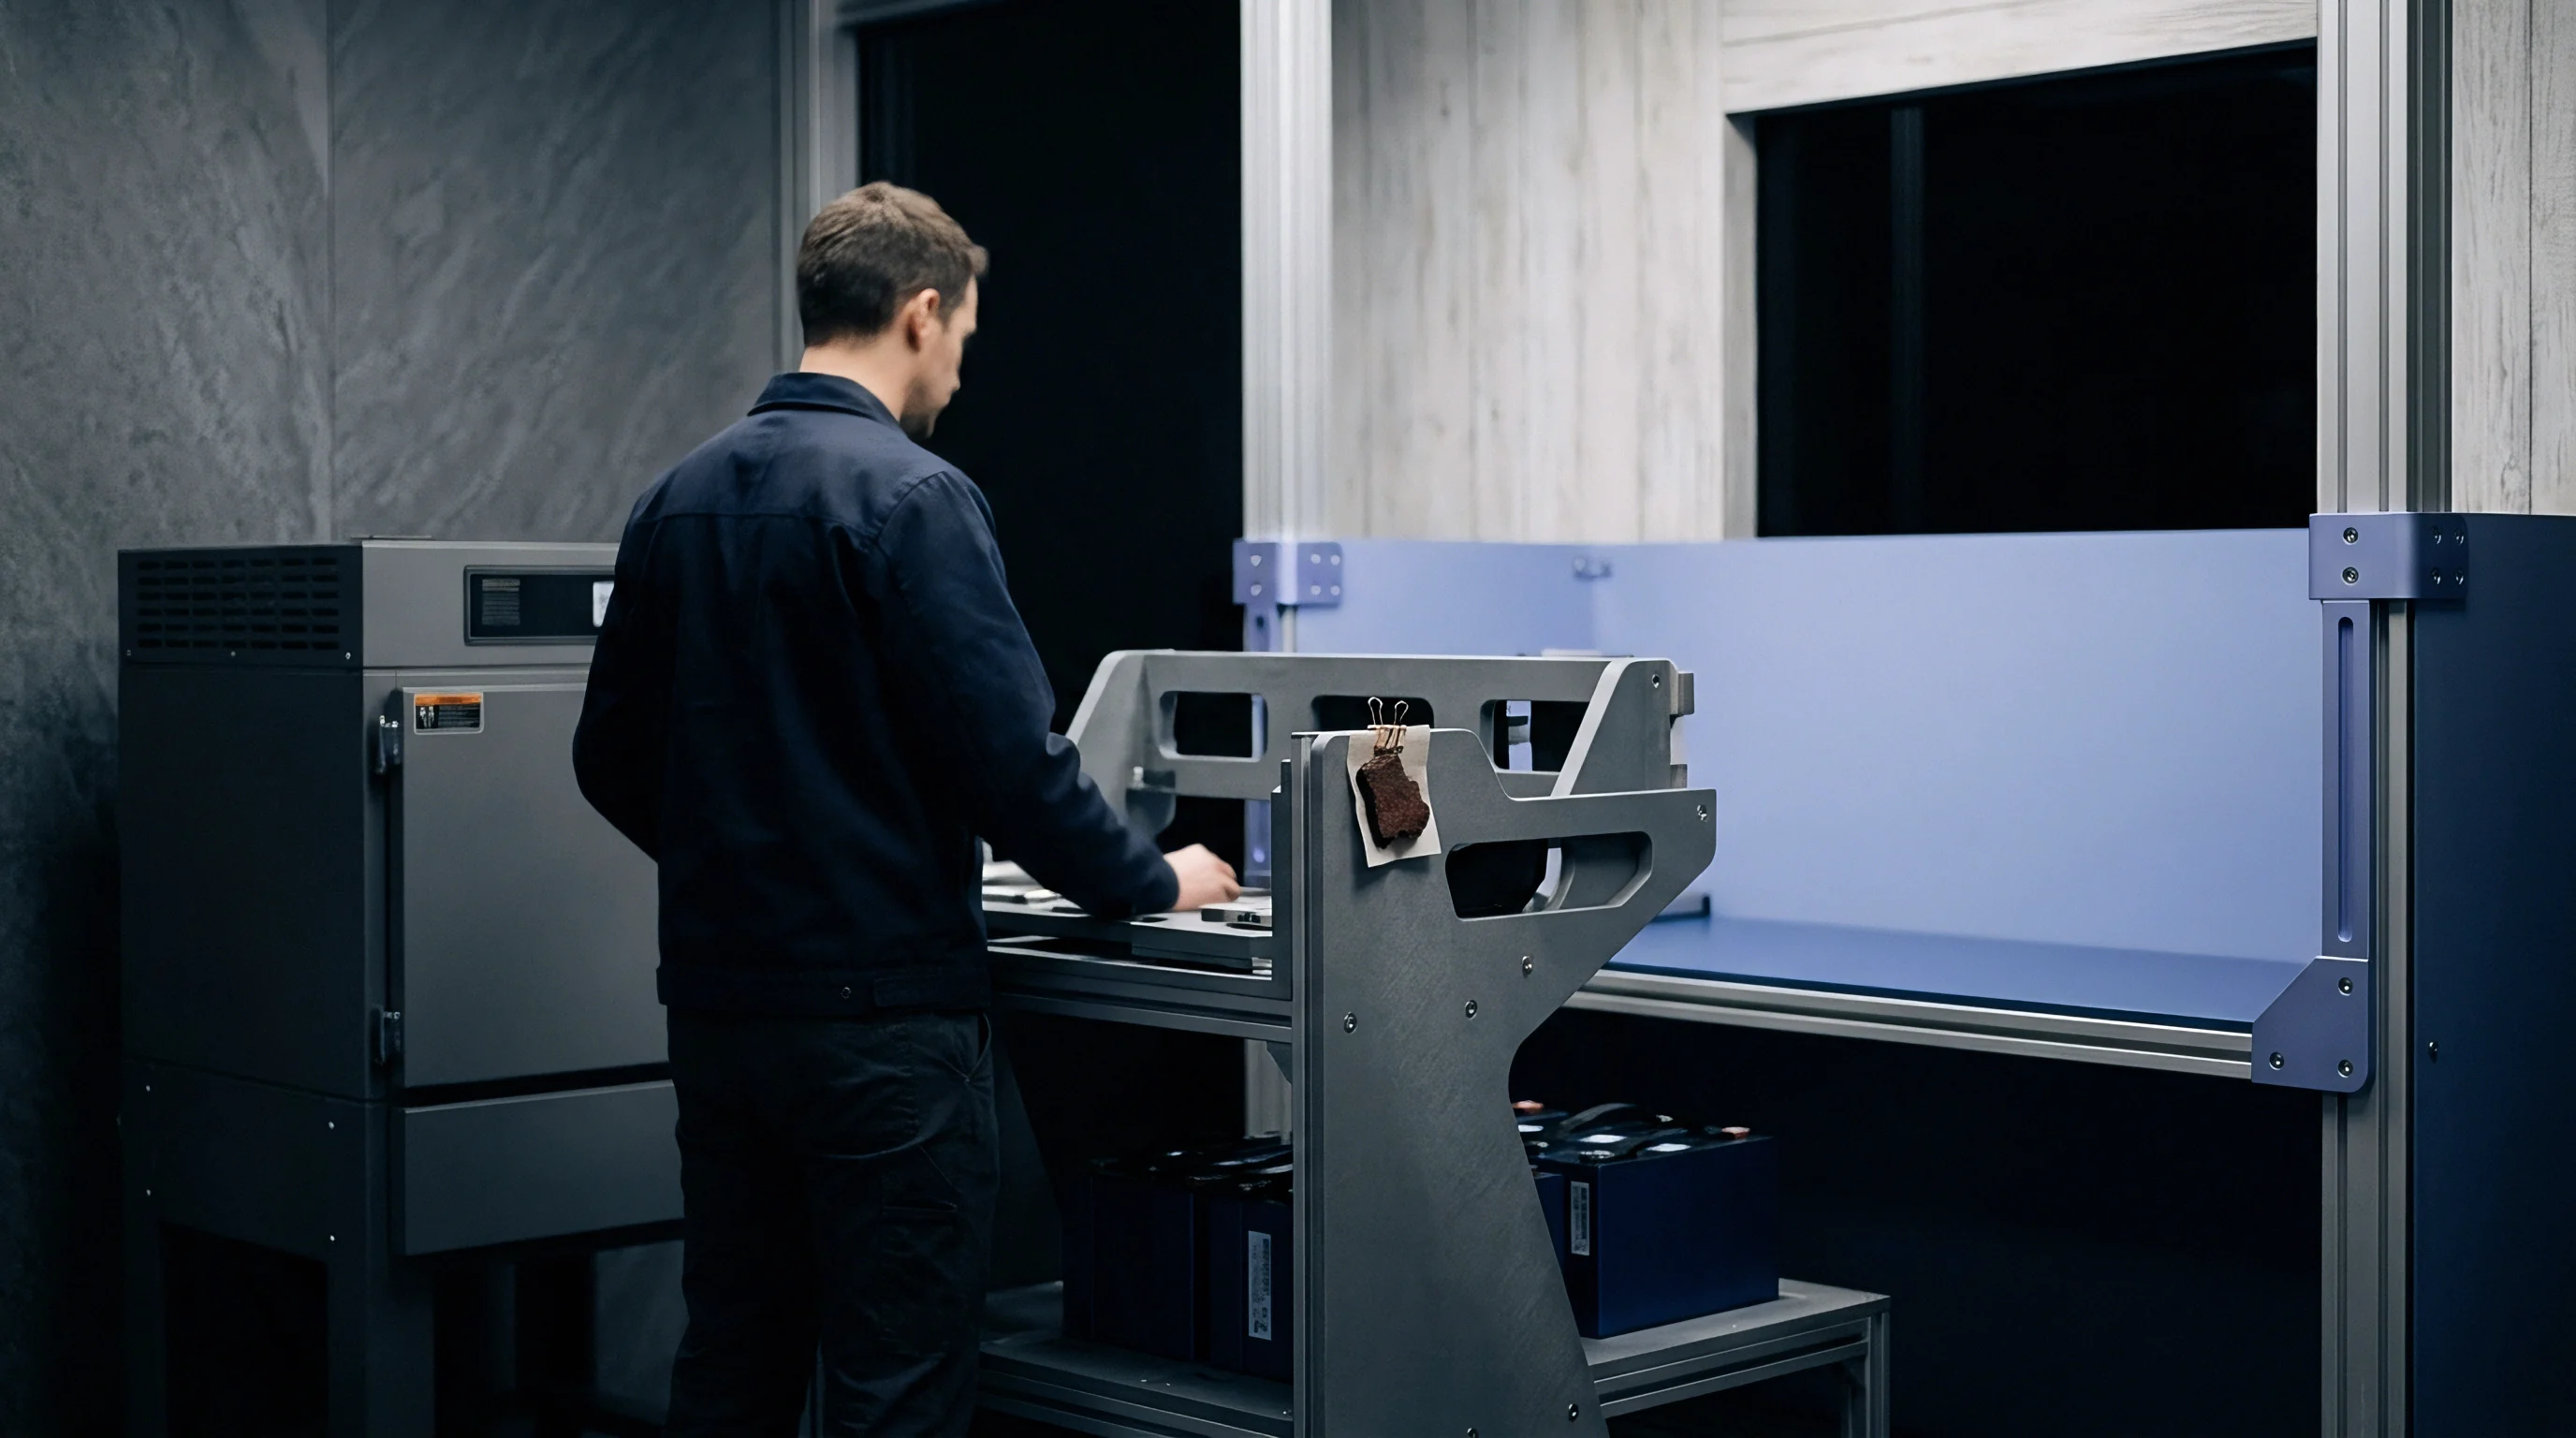
Factory qualification relies on heavy mechanical fixtures that apply uniform surface pressure across cell faces. Standard test protocols mandate three hundred to seven hundred kilopascals of continuous pressure maintained by rigid steel plates. This constant compression preserves tight interfacial contact, suppresses localized gas accumulation, and prevents graphite exfoliation across thousands of cycles.
Field pack enclosures often compromise on mechanical clamping to reduce structural mass and simplify assembly. Insufficient compression allows anode particles to separate from current collector foils as cells swell over time. Localized swelling creates physical gaps where liquid electrolyte pools, starving adjacent active material of ions and distorting local current density.
Regions subjected to elevated current densities degrade prematurely, accelerating overall capacity loss and pulling forward the replacement threshold.
| Test Parameter | Datasheet Test Baseline | Real Field Conditions | Impact on Degradation |
|---|---|---|---|
| Ambient Temperature | 25°C ± 2°C | 35°C to 50°C (Enclosure core) | Accelerated SEI growth, electrolyte decomposition |
| Charge Rate (Continuous) | 0.5C (0.5 to 1.0 C step) | 0.8C to 1.2C (Fast solar capture) | Elevated Joule heating, lithium plating risk |
| Discharge Rate (Continuous) | 0.5C | 1.0C to 2.0C (Peak shaving) | High internal thermal gradients, voltage sag |
| Mechanical Clamping | Uniform 300 to 500 kPa | Variable 0 to 150 kPa (Pack frame flex) | Electrode delamination, internal gas pooling |
| Rest Periods Between Cycles | 30 minutes minimum | 0 to 5 minutes (Continuous duty) | Sustained high internal core temperatures |
| Depth of Discharge (DOD) | 80% to 100% nominal | 100% full window utilization | Mechanical stress at voltage extremes |
Discharge Depth and Voltage Window Effects
Factory warranties are structured around full cycles executed between rigid voltage endpoints. Standard testing charges cells to three-point-six-five volts and discharges them down to two-point-five volts, establishing nominal one hundred percent depth of discharge. Lithium iron phosphate exhibits a flat voltage plateau around three-point-two volts, storing more than eighty percent of its total energy between three-point-three volts and three-point-one volts.
Operating near these voltage boundaries subjects cell chemistry to severe stress. Extended exposure to three-point-six-five volts raises cathode oxidation potential, accelerating the breakdown of organic carbonate solvents. At the lower boundary, discharging below two-point-five volts elevates anode potential, inducing oxidation and dissolution of the copper current collector foil.
During subsequent recharge cycles, dissolved copper ions migrate across the separator and precipitate as metallic copper dendrites, which can bridge separator pores and cause soft short circuits.
System integrators often restrict the operating state-of-charge window to prolong system life. Confining operation between twenty percent and eighty percent state of charge avoids high-voltage solvent oxidation and low-voltage copper dissolution. This operational adjustment can extend cycle life from four thousand cycles to beyond twelve thousand cycles, though it sacrifices roughly forty percent of usable nameplate energy density on day one.
Dimensional checks on incoming prismatic lots reveal clear shell expansion. Unclamped cells tested on open benches show an average width increase of three-point-two millimeters after one thousand cycles. By contrast, cells secured in rigid fixtures under four hundred kilopascals of pressure stay within zero-point-four millimeters of their original dimensions over that same period.
Physical constraints directly govern interfacial contact and long-term capacity retention.
Standard factory testing fails to account for high-frequency current ripple produced by power conversion electronics. Inverters inject AC ripple currents between one hundred Hertz and twenty kilohertz onto the DC bus. These fluctuations drive micro-cycling within electrode active particles, causing localized thermal spikes and mechanical fatigue along crystal grain boundaries.
Datasheet figures derived from pure DC sources omit this ripple-induced thermal stress entirely.
Factory test channels produce performance figures under operating bounds that field systems do not replicate. Published cycle life figures in marketing collateral reflect maximum electrochemical potential under ideal bench constraints, not expected performance inside customer enclosures.

Drift
Capacity loss in lithium iron phosphate follows distinct electrochemical mechanisms. Unlike nickel manganese cobalt chemistries, LFP utilizes an ordered olivine crystal structure stabilized by strong covalent iron-oxygen and phosphorus-oxygen bonds. This robust framework prevents destructive phase transitions during lithium extraction, making the cathode highly resistant to mechanical collapse and thermal runaway.
Degradation typically originates not from cathode breakdown, but from continuous consumption of mobile lithium inventory and rising internal cell impedance.
Across extended cycling, active lithium becomes trapped within secondary reaction products. Because the graphite anode operates below the thermodynamic reduction potential of liquid carbonate solvents, it requires a stable passivation layer to prevent solvent breakdown. Micro-cracking and repair of this layer during cycling continuously sequesters mobile lithium, driving up internal resistance over time.
Tracking long-term degradation requires monitoring solid electrolyte interphase growth, transition metal dissolution, and non-linear capacity drop points under actual field dynamics.

Solid Electrolyte Interphase Growth Kinetics
Growth of the passivation layer on the graphite anode is the primary mechanism consuming usable lithium. During initial formation cycling, electrolyte solvents reduce at the graphite surface, generating a thin solid electrolyte interphase composed of lithium carbonate, lithium alkyl carbonates, and lithium fluoride. In an ideal system, this film conducts lithium ions while blocking electron transfer, halting further solvent decomposition.
Mechanical strain during continuous cycling disrupts this passive state. Graphite particles expand and contract during intercalation, fracturing the inorganic outer layer of the interphase film. Newly exposed graphite surfaces react instantly with liquid electrolyte, consuming additional lithium ions to repair the passivation barrier.
Elevated operating temperatures accelerate these reaction rates, thickening the interphase film and raising cell internal resistance.
Cell compression plates that maintain uniform pressure prevent micro-delamination along the lithium iron phosphate cathode surface.
A thickening interphase restricts ion diffusion into graphite pores. The resulting rise in charge transfer resistance induces severe voltage polarization during high-current charging, causing the cell to reach its upper cut-off voltage prematurely. The battery management system terminates charging early, restricting accessible capacity even while the bulk cathode material remains electrochemically intact.

Iron Dissolution and Cathode Degradation Modes
Trace moisture within organic carbonate solvents reacts with hexafluorophosphate salt to generate hydrofluoric acid. This acid attacks the olivine cathode structure, dissolving divalent iron ions into the liquid electrolyte. Solvated iron ions diffuse through the microporous polymer separator toward the negative electrode, driven by concentration gradients and internal electric fields.
When iron deposits onto the graphite anode, it poisons the protective passivation layer. Deposited metallic iron acts as a catalytic site for electron transfer, accelerating electrolyte reduction and promoting further interphase growth. Trapping mobile lithium through these iron-catalyzed side reactions leads to rapid capacity fade.
Keeping electrolyte moisture below ten parts per million during production mitigates acid formation, but moisture ingress through external seals over multi-year deployments eventually reactivates iron dissolution.
High-voltage storage accelerates iron leaching. Holding cells at high states of charge elevates cathode potential above three-point-six volts, increasing iron solubility in the surrounding electrolyte. Consequently, standby systems held continuously at one hundred percent state of charge experience faster capacity decay than active systems cycled within intermediate charge bands.

Why Do Laboratory Tests Overstate Field Survival?
Continuous back-to-back cycling in test laboratories creates uniform thermal and chemical states that rarely match field reality. Laboratory cyclers transition immediately between charge and discharge, maintaining internal ion diffusion gradients in a quasi-steady state. In contrast, operational systems experience prolonged idle periods across fluctuating ambient temperatures, introducing substantial calendar aging alongside active cycling losses.
Calendar degradation proceeds continuously regardless of active throughput. Storage at forty degrees Celsius and elevated state of charge drives steady lithium loss via thermal solvent reduction. Cycle and calendar aging interact synergistically, degrading usable capacity faster than the simple sum of their isolated rates.
A six-month accelerated lab test fails to account for five to ten years of cumulative calendar aging.
Standard factory qualification relies on steady constant-current and constant-voltage profiles that ignore dynamic load spikes. Operational profiles ~ such as grid frequency regulation or heavy vehicle traction ~ subject cells to severe current pulses. These dynamic transients generate localized mechanical stress concentrations across electrode coatings, creating micro-fissures that accelerate electrolyte consumption and shorten operating life.
- Mount pristine sample cells into multi-channel impedance spectroscopy channels equipped with climate control.
- Record baseline electrochemical impedance spectrum from ten kilohertz down to ten millihertz under open circuit potential.
- Subject test samples to dynamic stress profiles featuring one hundred percent depth of discharge at specified ambient temperatures.
- Perform intermediate capacity measurement cycles every two hundred cycles using standard zero-point-five C charge and discharge rates.
- Extract charge transfer resistance and solid electrolyte interphase resistance components using non-linear complex non-linear least squares fit algorithms.
- Identify non-linear capacity drop acceleration points to establish true practical end of life boundaries.

Coulombic Efficiency and Non-Linear Capacity Knees
Precise coulombic efficiency measurements provide early insight into long-term active material retention. This metric defines the ratio of discharge capacity to charge capacity within an individual cycle. A cell operating at ninety-nine-point-nine percent coulombic efficiency consumes zero-point-one percent of its mobile lithium inventory on every full turn.
Achieving six thousand cycles under field conditions requires coulombic efficiency consistently exceeding ninety-nine-point-nine-nine percent.
Degradation trajectories rarely follow a straight line over a cell’s operating life. Initial capacity fade proceeds gradually while the solid electrolyte interphase layer stabilizes. After extended operation, the degradation curve bends sharply into a non-linear capacity knee.
Entering this knee phase signals rapid structural decline, where remaining capacity can drop from eighty percent to fifty percent within just a few hundred cycles.
The capacity knee occurs when cumulative lithium loss leaves the graphite anode under-saturated relative to the cathode during recharge. As usable active graphite mass diminishes, local zones saturate rapidly, preventing incoming lithium ions from intercalating cleanly. Local overpotential drops below zero volts, initiating metallic lithium plating.
Plated lithium reacts aggressively with liquid electrolyte, sharply increasing cell impedance and causing rapid capacity loss.
| Mechanism | Primary Stress Factor | Coulombic Efficiency Impact | Internal Resistance Growth Rate | Cycle Count to 80% SOH |
|---|---|---|---|---|
| Passive SEI Growth | Storage at high temp (45°C) | 99.95% steady baseline | +0.02 mΩ / 100 cycles | 3,500 to 4,500 |
| Anode Lithium Plating | Low temp charge (<10°C) | Drops below 99.50% | +0.08 mΩ / 100 cycles | 1,200 to 1,800 |
| Iron Dissolution Decay | Electrolyte moisture >20 ppm | 99.85% fluctuating | +0.05 mΩ / 100 cycles | 2,000 to 2,800 |
| Mechanical Delamination | Zero clamping pressure | 99.90% moderate drop | +0.04 mΩ / 100 cycles | 2,500 to 3,200 |
| Post-Knee Accelerated Fade | Extended cycling past EOL | Drops below 98.00% | +0.25 mΩ / 100 cycles | Additional 300 to 500 |
Teardown analyses show impedance doubling after 1,400 continuous cycles at elevated temperatures. This resistance growth shifts cell voltage curves downward during high-rate discharge. Under heavy loads, the system hits its lower discharge cut-off voltage prematurely, triggering protection trips even though usable active material remains within the cell matrix.
Capacity retention drops measurably when rest periods between rapid cycles are skipped. Omitting rests leaves concentration polarization gradients unrelaxed across the electrode thickness. Elevated lithium ion concentrations at electrode surfaces drive increased side reactions, stripping active lithium faster than uniform diffusion would allow.
Tracking landed cell costs against actual delivered kilowatt-hours over extended duty cycles shows how quickly economics deteriorate: a cell rated for eight thousand cycles on paper that hits a capacity knee at three thousand cycles in the field doubles total lifetime storage costs per kilowatt-hour. Procurement specs need to evaluate knee initiation thresholds rather than relying solely on early linear fade rates.
Micro-cracking develops within cathode particles under continuous lattice expansion and contraction. While lithium iron phosphate undergoes lower volumetric change than layered oxide chemistries, grain boundary strain still generates sub-micron fractures over thousands of cycles. These micro-cracks expose fresh active surfaces to acid attack, accelerating transition metal dissolution and compounding overall capacity fade.
Electrolyte depletion sets the ultimate ceiling on cell operating life. Ongoing interphase passivation and high-voltage solvent oxidation gradually consume available liquid electrolyte. Dry-out occurs when remaining electrolyte volume can no longer fully wet the separator pores and electrode interfaces.
Once dry-out occurs, internal impedance spikes sharply, permanently ending cell operation.
Capacity degradation accelerates rapidly once interphase growth consumes more than twenty percent of the initial active lithium inventory.
Paperwork
Commercial cell specifications define the baseline ratings buyers use to model asset returns. Datasheets outline capacity, gravimetric energy density, nominal voltage, and cycle life under laboratory constraints, with vendor documentation citing four thousand, six thousand, or eight thousand cycles to eighty percent state of health. Buyers who insert these figures directly into financial projections without qualifying the underlying test regimes risk substantial financial shortfalls.
Without legally binding qualification standards and explicit warranty terms, published datasheets serve primarily as marketing literature.
Supply contracts must close the gap between factory bench results and operational field profiles. Procurement terms should define precise testing boundaries, end-of-life criteria, capacity measurement protocols, and financial remediation schedules. Failing to bind cycle life warranties to actual operating profiles leaves project developers exposed to unbudgeted pack replacements, uncompensated plant downtime, and disputed warranty claims.
True vendor accountability requires contractual standards tied directly to field duty cycles.

Standardized Test Standards versus Real Profiles
International compliance standards establish baseline manufacturing safety and core functional envelopes rather than real-world durability. Norms such as IEC 62620, UL 1973, and UN 38.3 detail mandatory compliance hurdles for industrial and grid-scale cells. IEC 62620 outlines capacity verification, electrical endurance, and internal resistance testing at ambient room temperatures, running continuous cycling at standardized rates until capacity falls to eighty percent of nominal rating.
Standard regulatory compliance does not validate longevity under severe operational profiles. UN 38.3 focuses strictly on transportation safety, evaluating cell resilience against thermal shock, mechanical vibration, physical impact, external short circuits, and forced overcharge. Passing UN 38.3 confirms only that a cell will not catch fire or rupture during transit; it provides no data regarding capacity retention across years of field operation.
Similarly, UL 1973 tests electrical, mechanical, and environmental containment under destructive abuse conditions, omitting extended cycle endurance testing entirely.
IEC 62620 Section 6.6 specification testing fails to capture thermal acceleration during continuous 1C cycling without rest periods.
Commercial qualification requires benchmarking cells against duty cycles that replicate actual operational stress. Energy storage supply agreements must mandate testing profiles that combine elevated ambient temperatures, high charge rates, and zero rest intervals. Relying solely on standard IEC certificates to justify ten-year asset longevity represents a severe risk in project engineering.
Warranty Terms and End of Life Clause Structures
Supply agreements routinely limit financial recourse by defining end of life strictly at eighty percent retained capacity. Standard warranties promise five thousand cycles or ten operating years, but incorporate operational restrictions that void coverage if parameters deviate from narrow baseline envelopes. Exceeding thirty-five degrees Celsius ambient temperature for more than one hundred cumulative hours per year, for example, frequently serves as grounds for complete warranty cancellation.
Broad operational exclusions effectively transfer technical risk back to the asset owner. Suppliers audit field conditions using onboard battery management system logs. If logged telemetry shows an over-temperature excursion, a brief over-voltage transient, or a cycle rate above baseline specs, the manufacturer can reject degradation claims.
Procurement agreements must define clear boundaries separating normal field operations from actual operating abuse.
Capacity verification terms in warranty clauses are frequently structured to favor the manufacturer. Warranties often dictate that capacity claims be evaluated at low discharge rates ~ such as zero-point-two C at twenty-five degrees Celsius after a mandatory twenty-four-hour rest. A cell exhibiting seventy-five percent capacity under one C field operation might deliver eighty-two percent under zero-point-two C lab conditions, enabling the vendor to dismiss the claim.
Contracts must enforce capacity testing conducted at actual operating rates and ambient field temperatures.
- Standard test standard reference defines the international test standards used to measure initial cell capacity, internal resistance, and cycle degradation rates under ambient conditions.
- Operating envelope constraints specify maximum continuous charge rates, peak discharge currents, temperature thresholds, and mechanical compression forces required to maintain warranty coverage.
- Capacity measurement protocol outlines the exact discharge current, ambient temperature, cut-off voltages, and rest times used during warranty verification testing.
- Degradation tracking method defines how the battery management system records equivalent full cycles, temperature history, and average state of charge over the system lifetime.
- Remediation and compensation terms establish seller financial obligations, including cell replacement, labor costs, and liquidated damages when delivered capacity falls below contractual thresholds.
Landed Cost per Delivered Kilowatt Hour Arithmetic
Determining true energy storage costs requires measuring total lifetime energy throughput against total capital expenditure. Nameplate capital cost per kilowatt-hour covers only physical acquisition. Total landed cost incorporates cell purchase price, international shipping, dangerous goods freight surcharges, customs clearance, import tariffs, regional warehousing, and incoming quality verification.
Dividing total landed cost by lifetime delivered kilowatt-hours yields the true levelized cost of storage.
Accelerated capacity fade alters project financial returns. A cell costing eighty dollars per kilowatt-hour landed that achieves six thousand cycles delivers roughly sixteen megawatt-hours over its operational life, representing a storage cost of zero-point-zero-zero-five dollars per kilowatt-hour per cycle. If operational stress accelerates degradation and limits field life to two thousand five hundred cycles, lifetime delivered energy drops to six-point-six megawatt-hours, driving the effective storage cost up to zero-point-zero-one-two dollars per kilowatt-hour per cycle.
Factory grading practices introduce additional commercial exposure. Tier-1 manufacturers segregate production into Grade A, Grade B, and scrap lots based on capacity consistency, internal resistance, and self-discharge characteristics. Grade A cells meet the tight parameter distributions required for utility-scale integration.
Grade B cells exhibit wider capacity variance, elevated self-discharge rates, or minor physical blemishes. Unscrupulous distributors regularly source Grade B lots, re-sleeve them with counterfeit branding, and distribute them as Grade A inventory at discounted pricing.
| Protocol / Standard | Discharge Profile | Thermal Environment | Life Expectancy Gap | Commercial Risk Level |
|---|---|---|---|---|
| IEC 62620 Section 6.6 | 0.2C / 0.5C Continuous | 25°C Controlled | 30% to 45% Over-estimate | High (If unadjusted) |
| UL 1973 Safety Testing | Abuse / Short Circuit | Variable / Extreme | No Cycle Life Data | Critical (Safety only) |
| Custom Dynamic Duty Cycle | 1.0C Peak / Micro-pulse | 35°C to 45°C Field Ambient | 0% (Baseline Match) | Low (Validated) |
| UN 38.3 Transport Testing | Fixed Load Safety | -40°C to +75°C Shock | No Cycle Life Data | Regulatory Only |
Rigorous incoming quality inspection is essential to intercept sub-standard cell lots before pack assembly begins. Acceptance protocols under ISO 2859-1 mandate statistical lot sampling from arriving shipments. Testing samples for open-circuit voltage, AC internal resistance at one kilohertz, DC internal resistance, and dimensional conformity reveals manufacturing consistency.
Elevated variance in internal resistance across a sample indicates mixed production grades or inadequate factory process controls, pointing to high early failure rates.
Cell sorting and binning protocols prevent premature module-level degradation. Assembling series strings from cells with mismatched capacity or internal resistance causes the lowest-capacity unit to reach its cut-off voltage first during both charge and discharge cycles. The management system must then isolate the entire series string, rendering the remaining energy in adjacent cells inaccessible.
High-tier integrators re-screen incoming cells, sorting units into tight capacity bins within zero-point-five percent variance and internal resistance bins within two percent variance prior to module assembly.
Contract dispute mechanisms must outline unambiguous arbitration terms and specify an accredited third-party testing laboratory. Agreements should identify independent test facilities empowered to conduct binding verification tests using contractually defined test cycles. Clear technical definitions and binding third-party pathways minimize protracted legal disputes and ensure timely remediation when delivered cells fail to achieve warranted cycle life.
The contract specifies that capacity verification for warranty claims shall be performed at one-point-zero C discharge rate under ambient thirty-five degrees Celsius conditions, overriding standard manufacturer datasheets.