Automated Test Fixture Resistance Calibration and Maintenance on Cell Production Lines
Automated test fixtures require active thermal compensation, continuous artifact calibration, and scheduled pogo pin renewal to maintain micro-ohm accuracy.
Contact
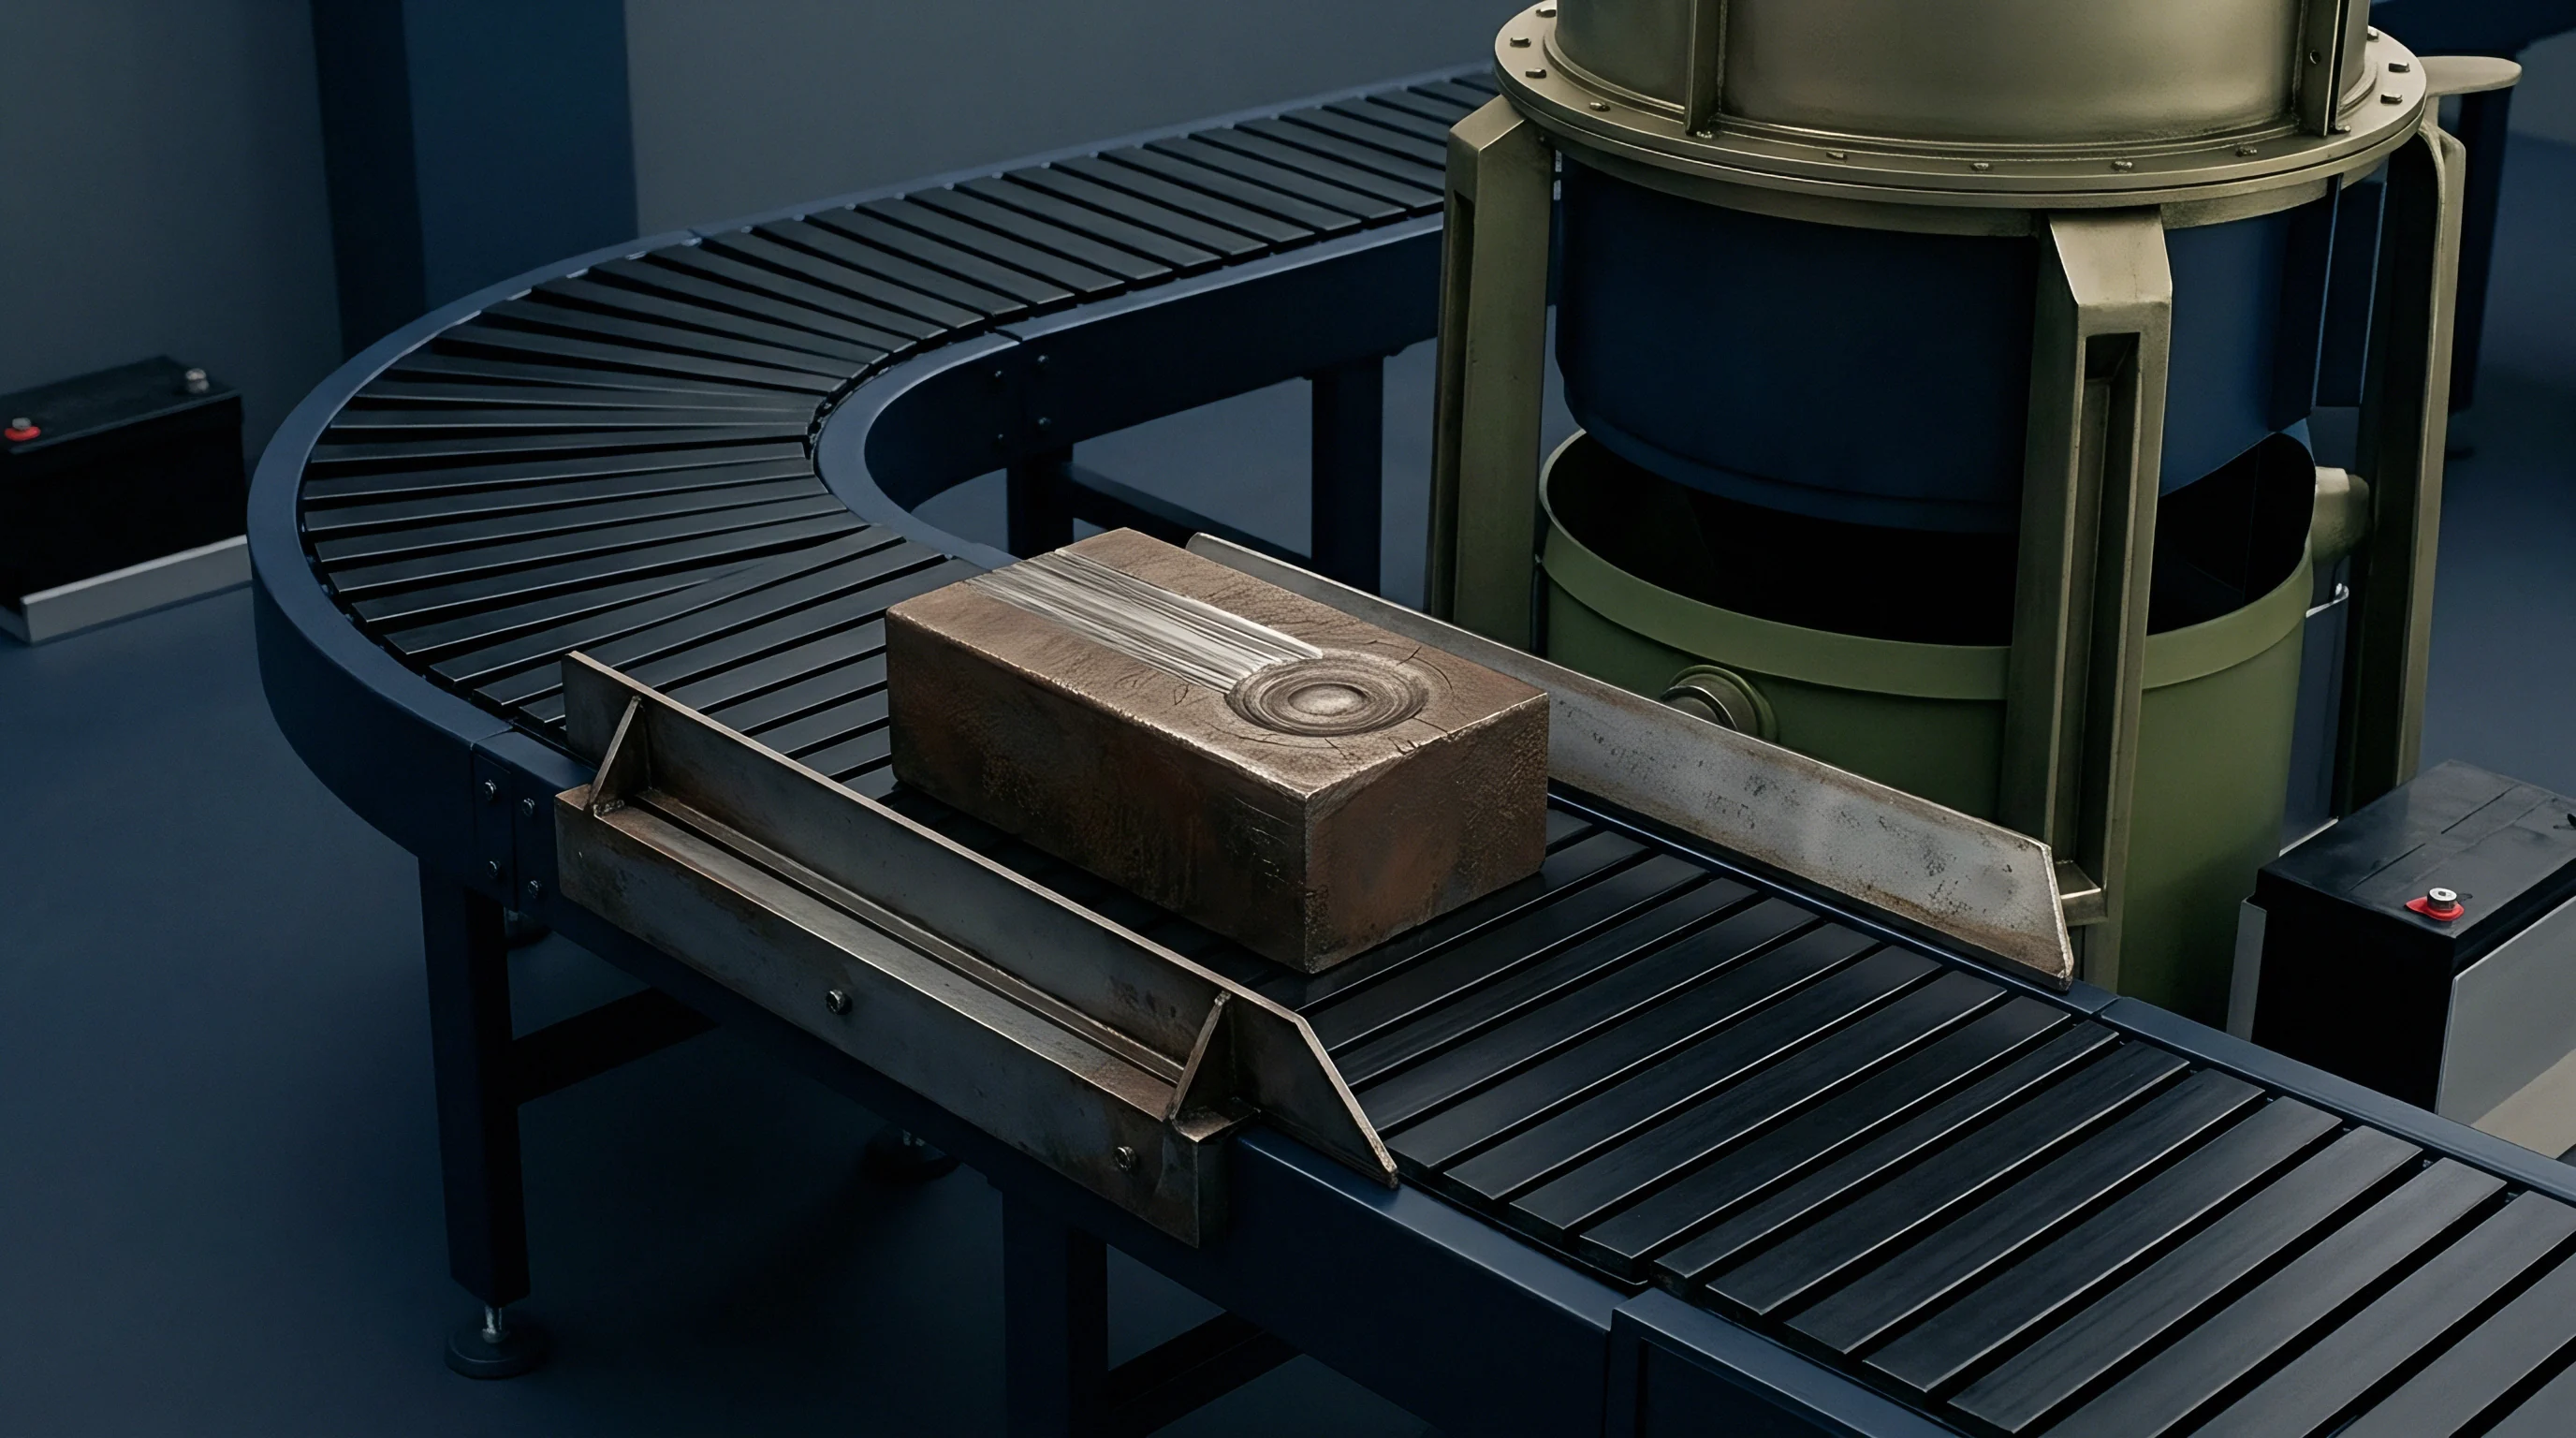
High-speed automated test channels on cylindrical and prismatic cell production lines rely on four-point Kelvin probing to isolate internal electrochemical impedance from interface resistance. At production line speeds exceeding sixty cells per minute per channel, mechanical contact between fixture pins and cell terminals introduces dynamic electrical noise that distorts milliohm-level AC internal resistance (ACIR) and DC internal resistance (DCIR) measurements. A variation of merely 100 micro-ohms in fixture contact impedance introduces an unacceptable ten percent error when grading high-capacity lithium-ion cells with nominal internal resistance values around 1.0 milliohm.
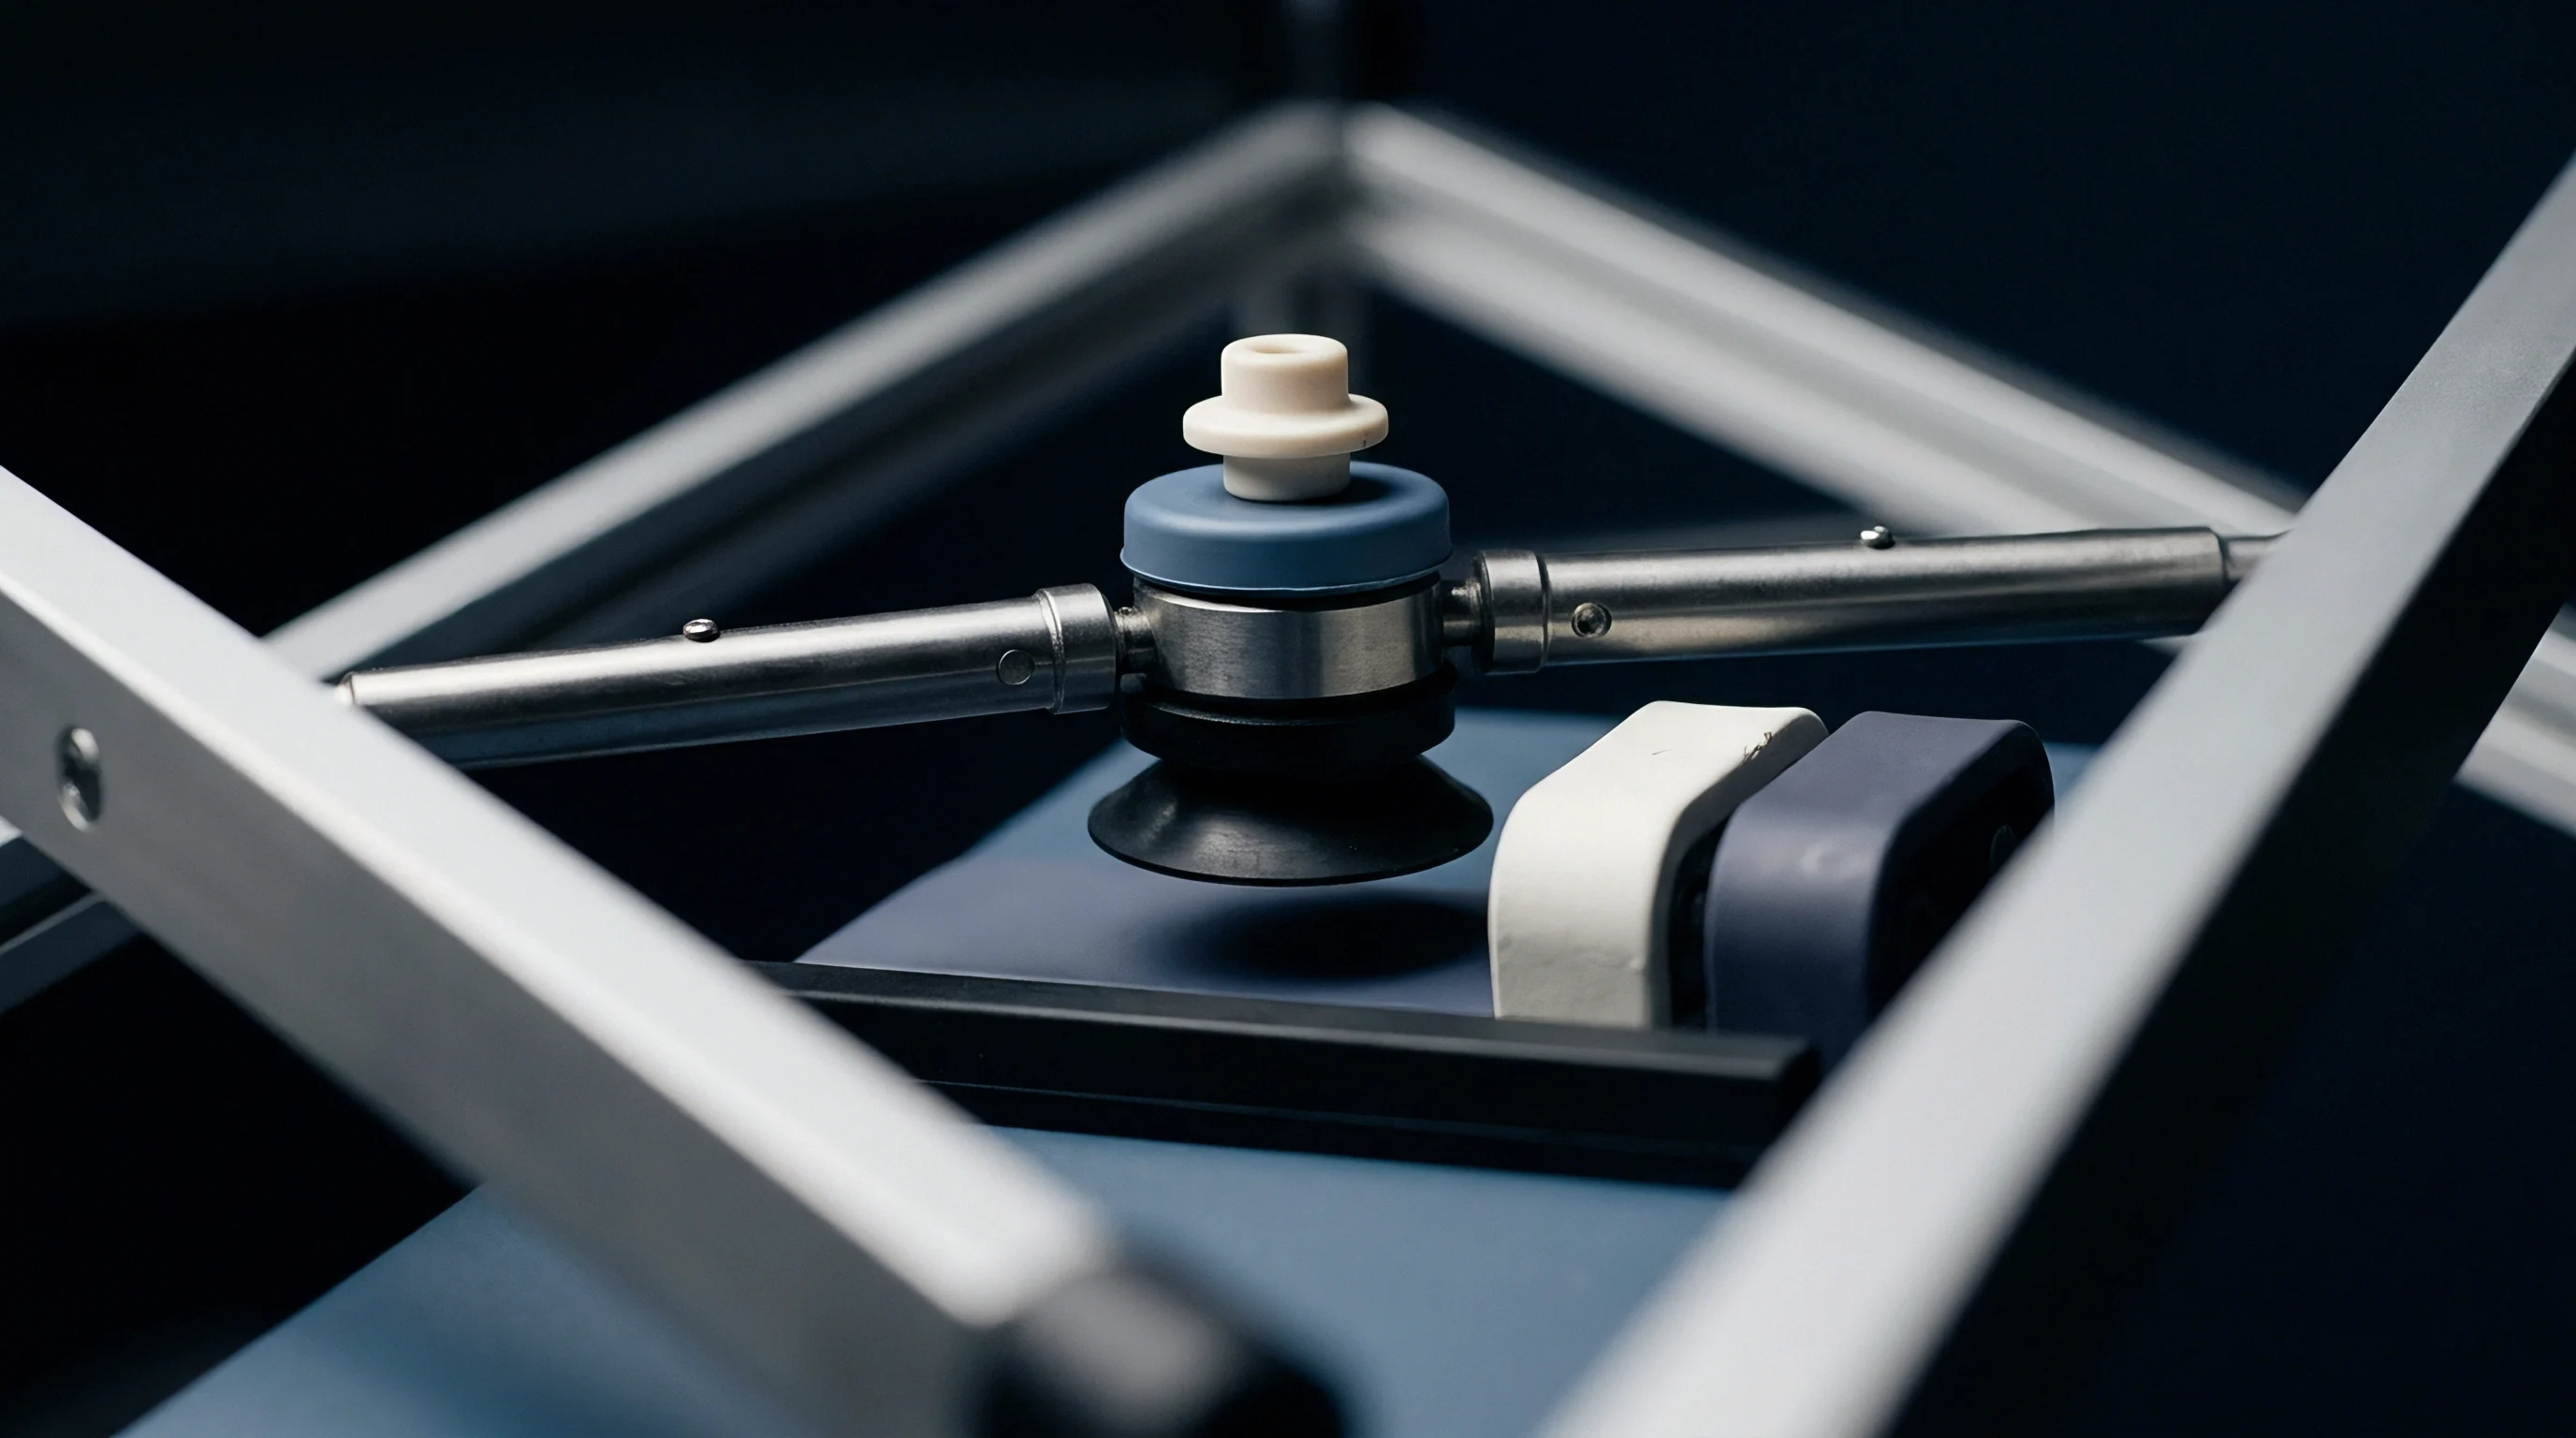
The force-sense architecture of an automated fixture separates the current-carrying path from the voltage-sensing path, eliminating the resistance of lead wires, relays, and primary probe springs from the measurement circuit. The interface between the probe tip surface and the cell terminal plate remains inside the sense loop if probe mechanics degrade. Electrical performance at this interface depends on contact pressure, tip geometry, surface oxide breakdown, and contamination accumulation over tens of thousands of insertion cycles.
Kelvin Sensing Mechanics at Cell Terminals
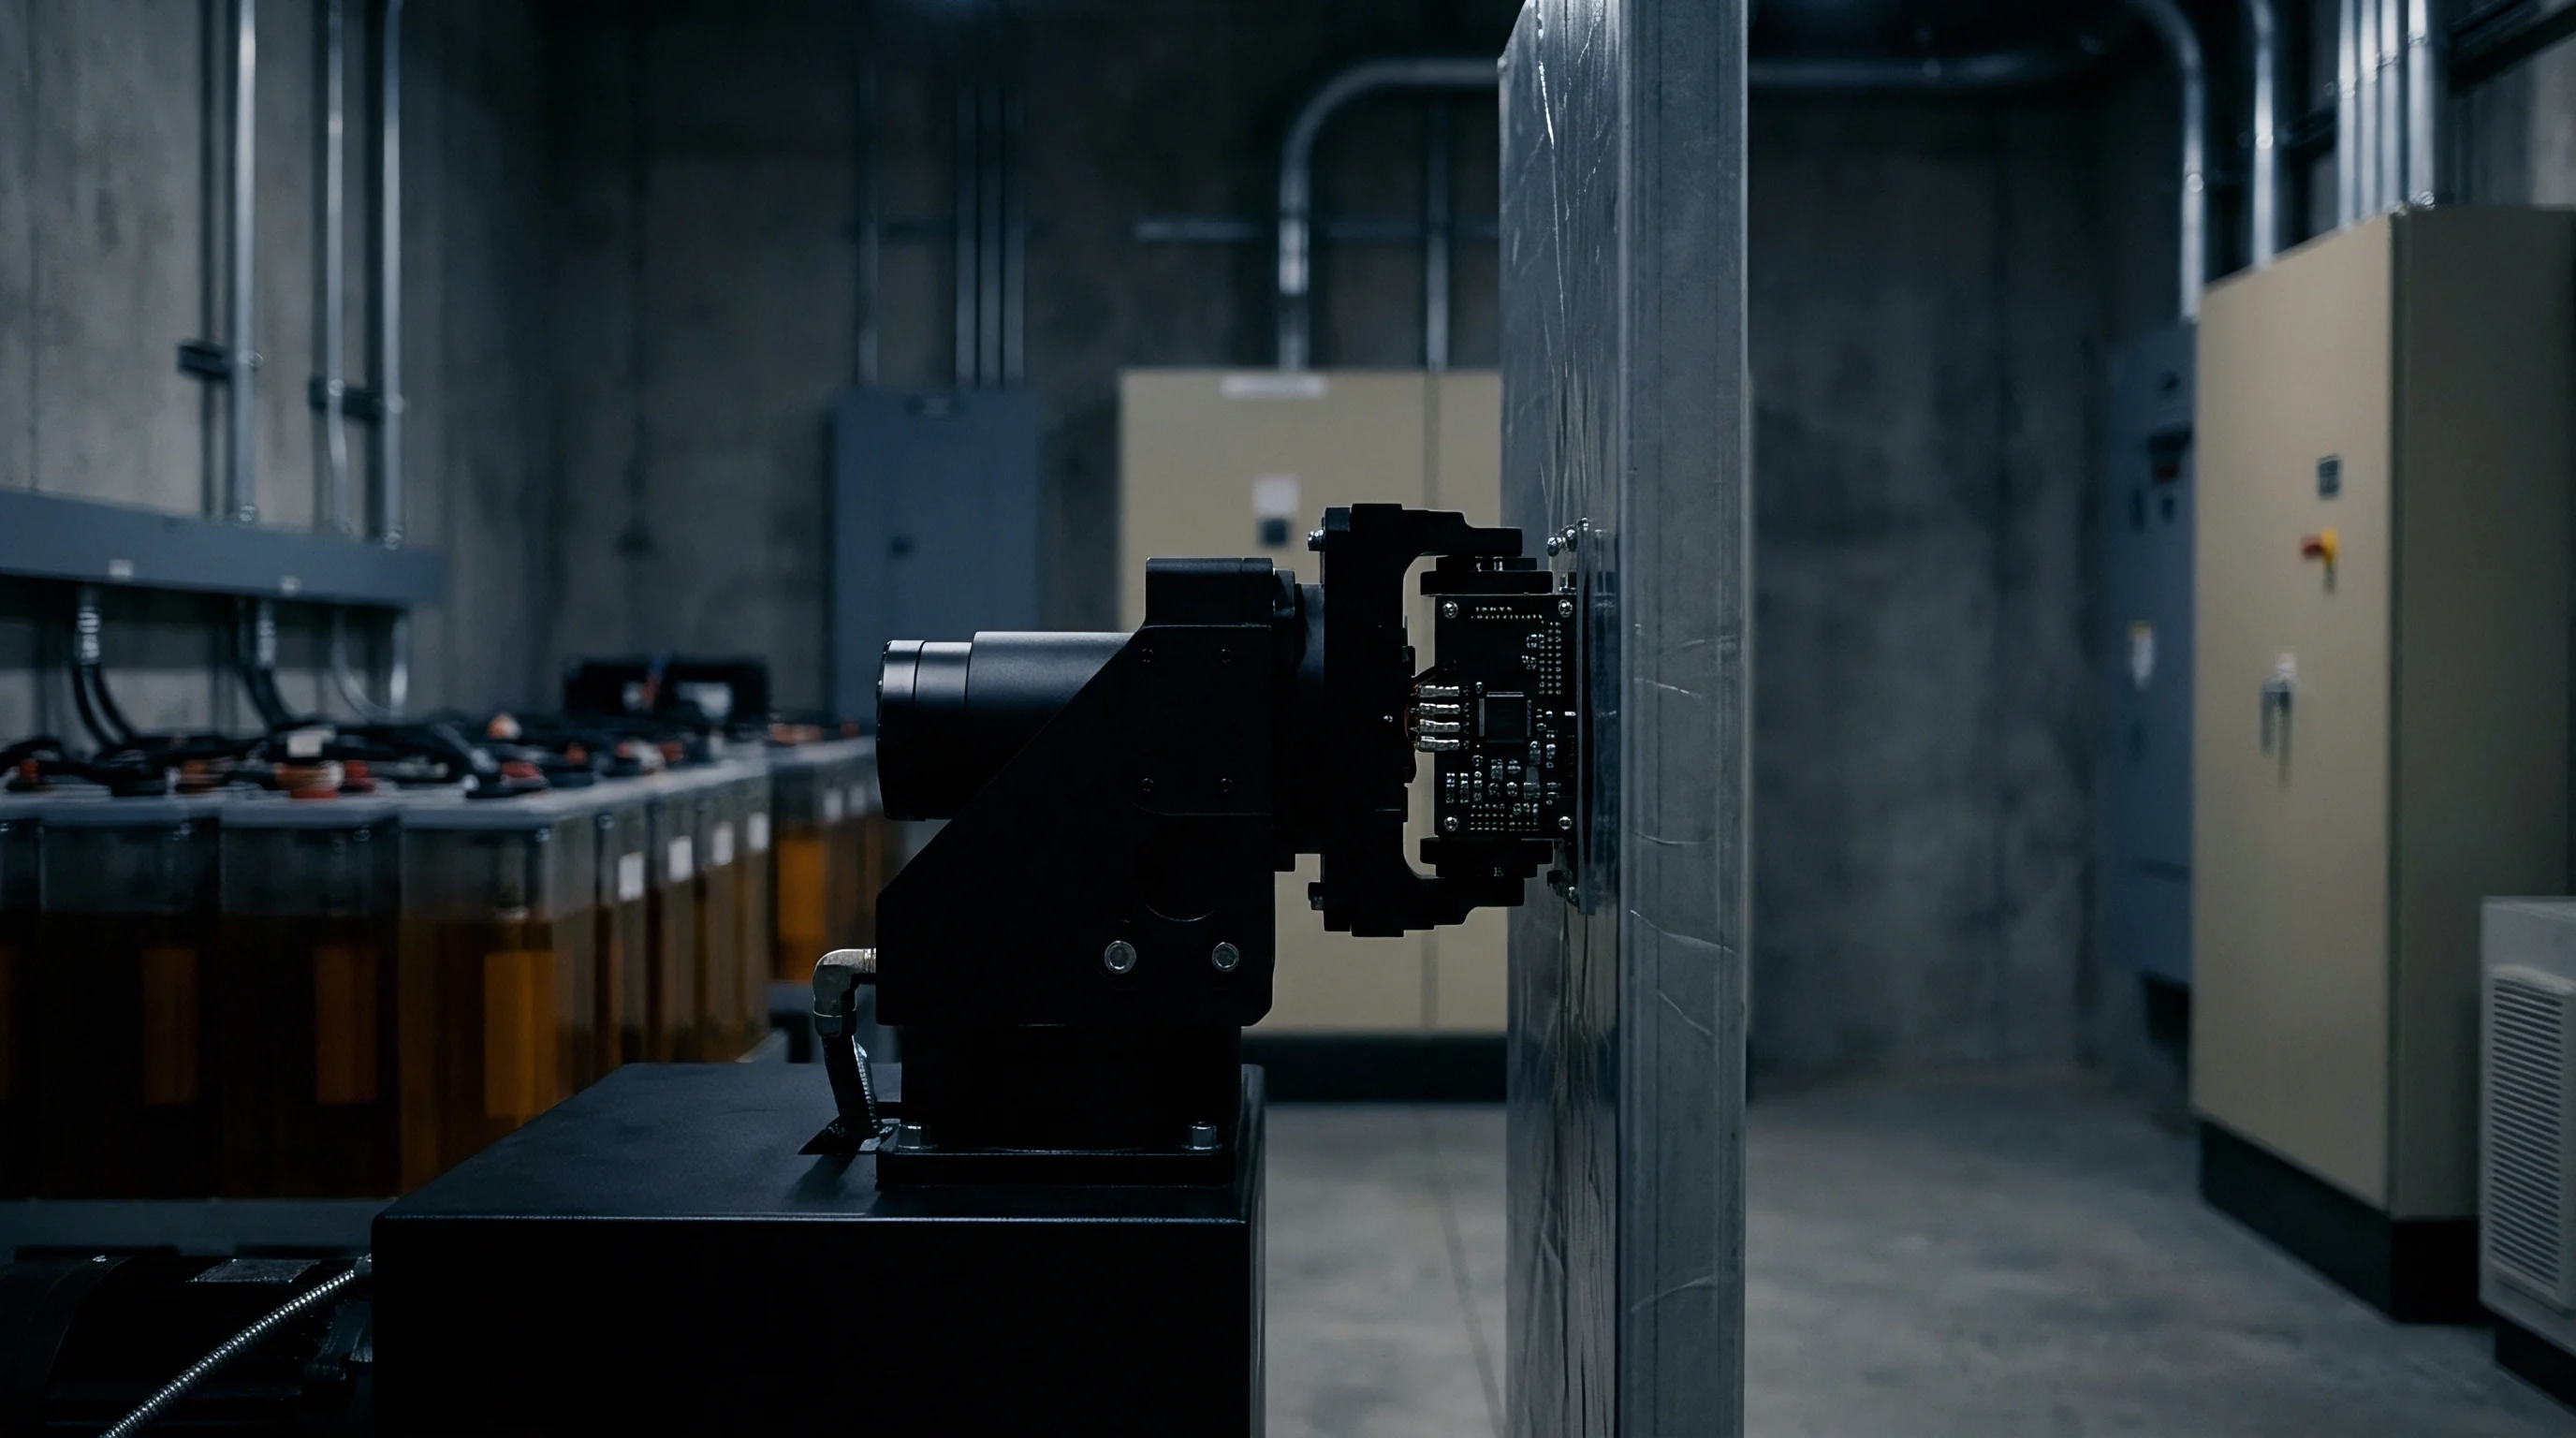
In a four-wire Kelvin configuration deployed on an automated end-of-line test station, two concentric or co-axial pogo pins press against each cell terminal. Current paths carry excitation pulses ranging from 1 ampere for 1 kHz ACIR meters up to 100 amperes for short-duration DC pulse resistance testing, while sense paths feed high-impedance differential amplifiers measuring response voltage drops.
When current passes through the force probe, localized resistive heating occurs at the micro-scale contact points known as a-spots. If the force and sense tips sit on a shared metallic housing without adequate dielectric separation, parasitic cross-talk currents flow through the sense circuit, producing artificially low resistance readings. Thermal expansion of probe components during continuous line operation further alters mechanical alignments, changing the micro-geometry of tip engagement.
Ambient thermal drift of 5 Kelvin introduces up to 12 micro-ohms of copper busbar resistance shift across a 300-millimeter test lead harness.
Parasitic Impedance Sources in Automated Nests
Fixture parasitics extend beyond the immediate probe pin tip to include internal wiring, relay matrices, pneumatic actuation linkages, and busbar interfaces where cable length adds inductance. High-frequency ACIR measurements at 1 kHz are susceptible to mutual inductive coupling between adjacent force leads, generating phase shifts that skew the imaginary component of impedance measurement.
| Contact Configuration | Initial Contact Resistance | Inductive Parasitics (1 kHz) | Wear Tolerance (Cycles) | Primary Failure Mode |
|---|---|---|---|---|
| Co-axial Kelvin Pin (Gold Plated) | 0.05 to 0.15 mΩ | Low (< 5 nH) | 50,000 to 100,000 | Plating wear and dielectric degradation |
| Split-Crown Twin Pogo Pin | 0.10 to 0.25 mΩ | Moderate (5 to 15 nH) | 75,000 to 120,000 | Debris packing in crown flutes |
| Pneumatic Copper-Beryllium Blade | 0.02 to 0.08 mΩ | High (> 20 nH) | 150,000 to 250,000 | Surface oxidation and mechanical galling |
| Multi-Finger Crown Kelvin Socket | 0.08 to 0.18 mΩ | Low (< 8 nH) | 40,000 to 80,000 | Finger fatigue and asymmetric contact force |
Pneumatic clamping mechanisms maintain mechanical stability across high-throughput production runs, though actuation force variations shift the total contact area. If pneumatic pressure drops by ten percent, contact resistance at the terminal plate rises non-linearly, masking true cell electrochemistry variations. High parasitic resistance in the force-sense loop drives erroneous cell grading, routing pristine low-impedance cells into secondary application bins.

Artifact
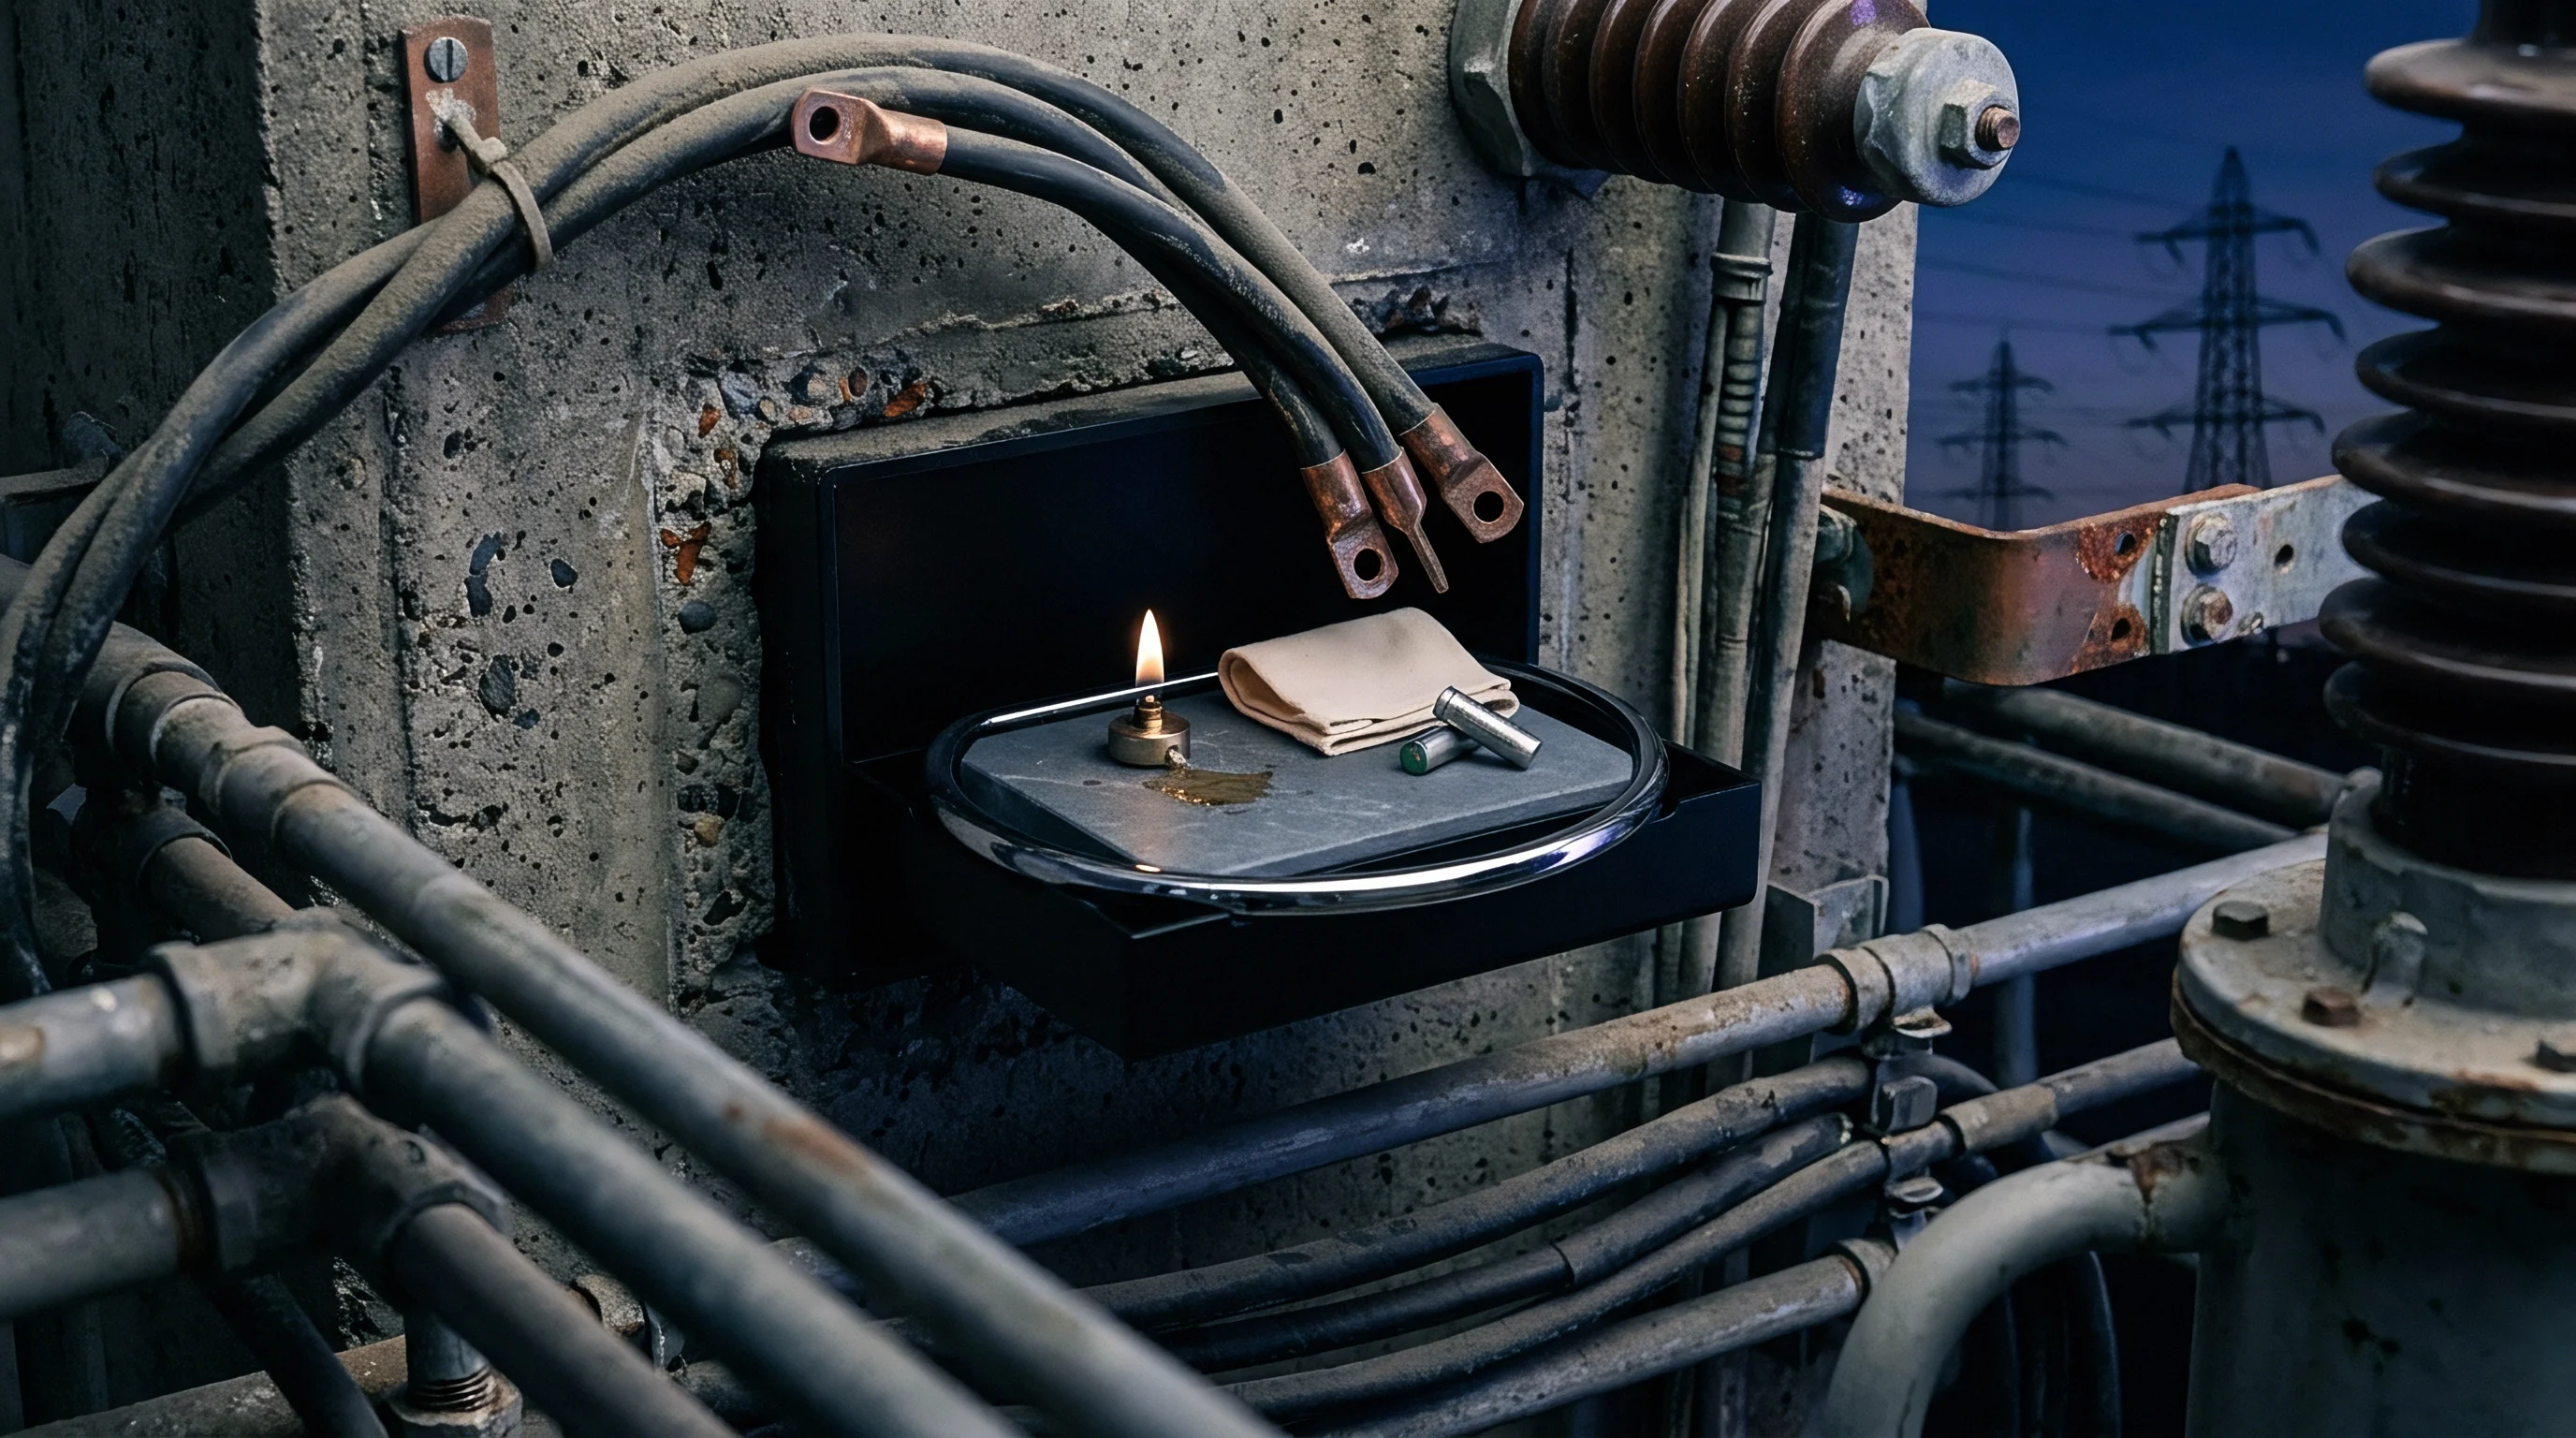
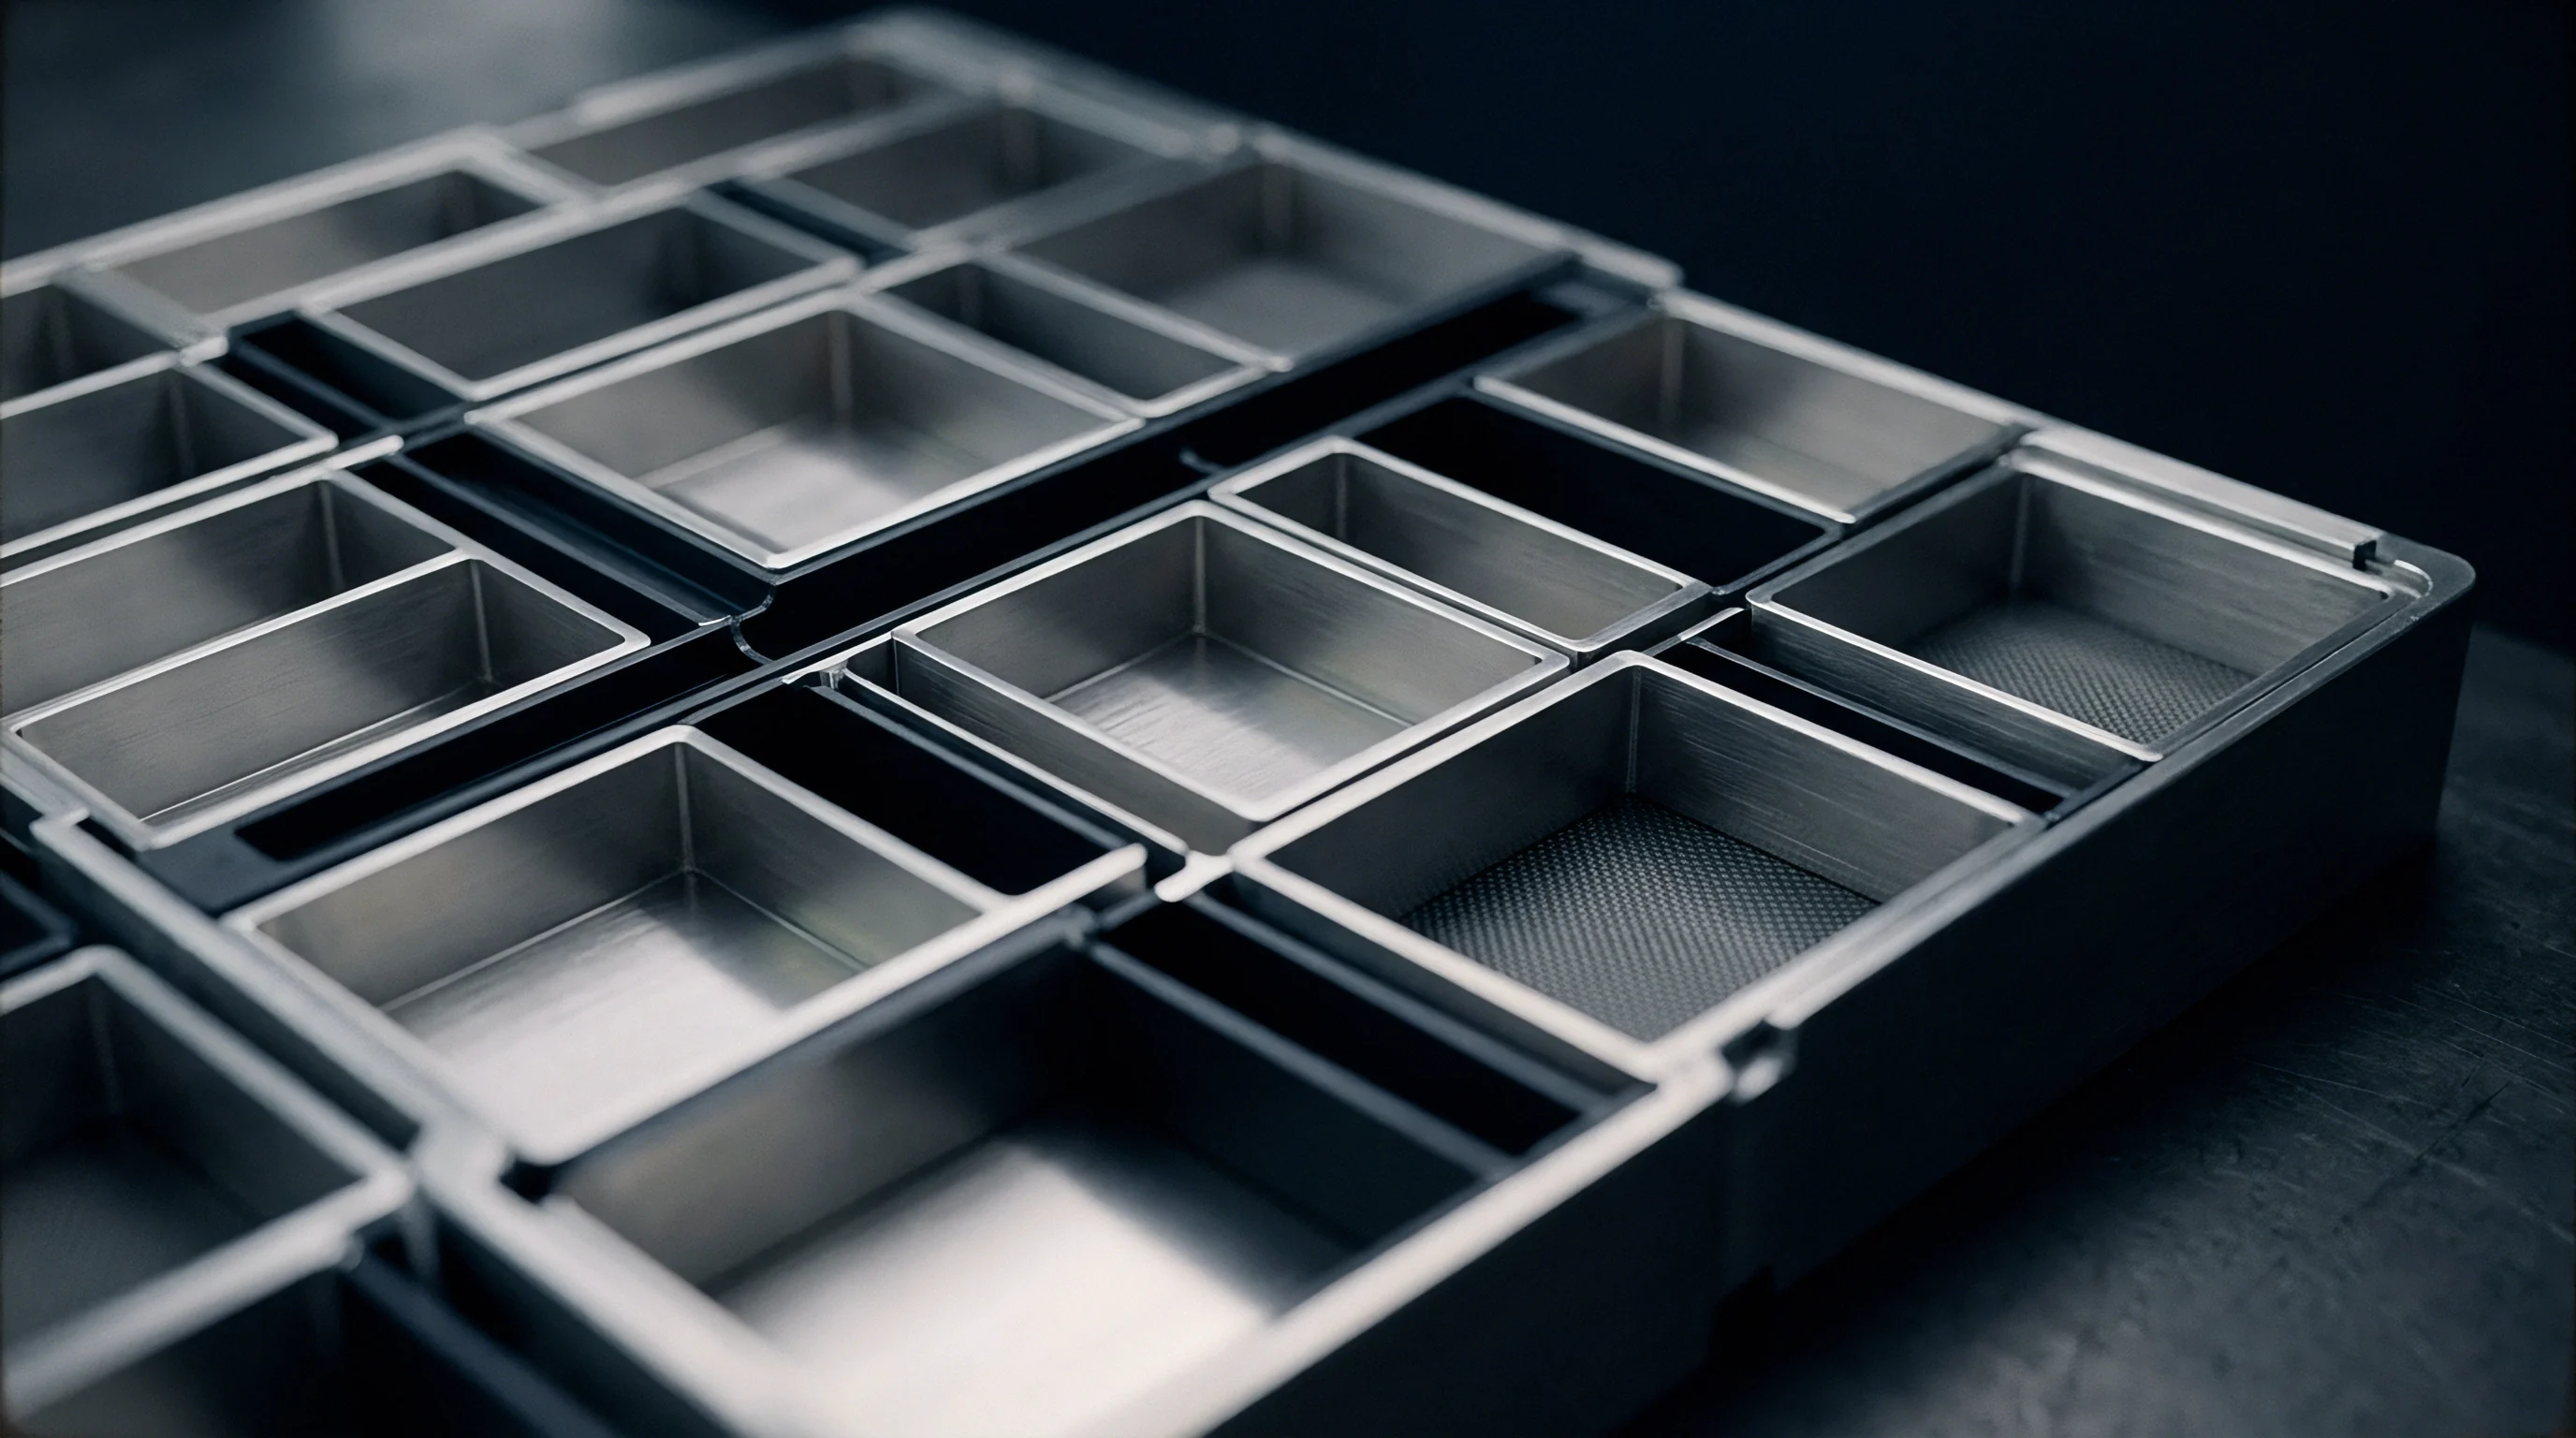
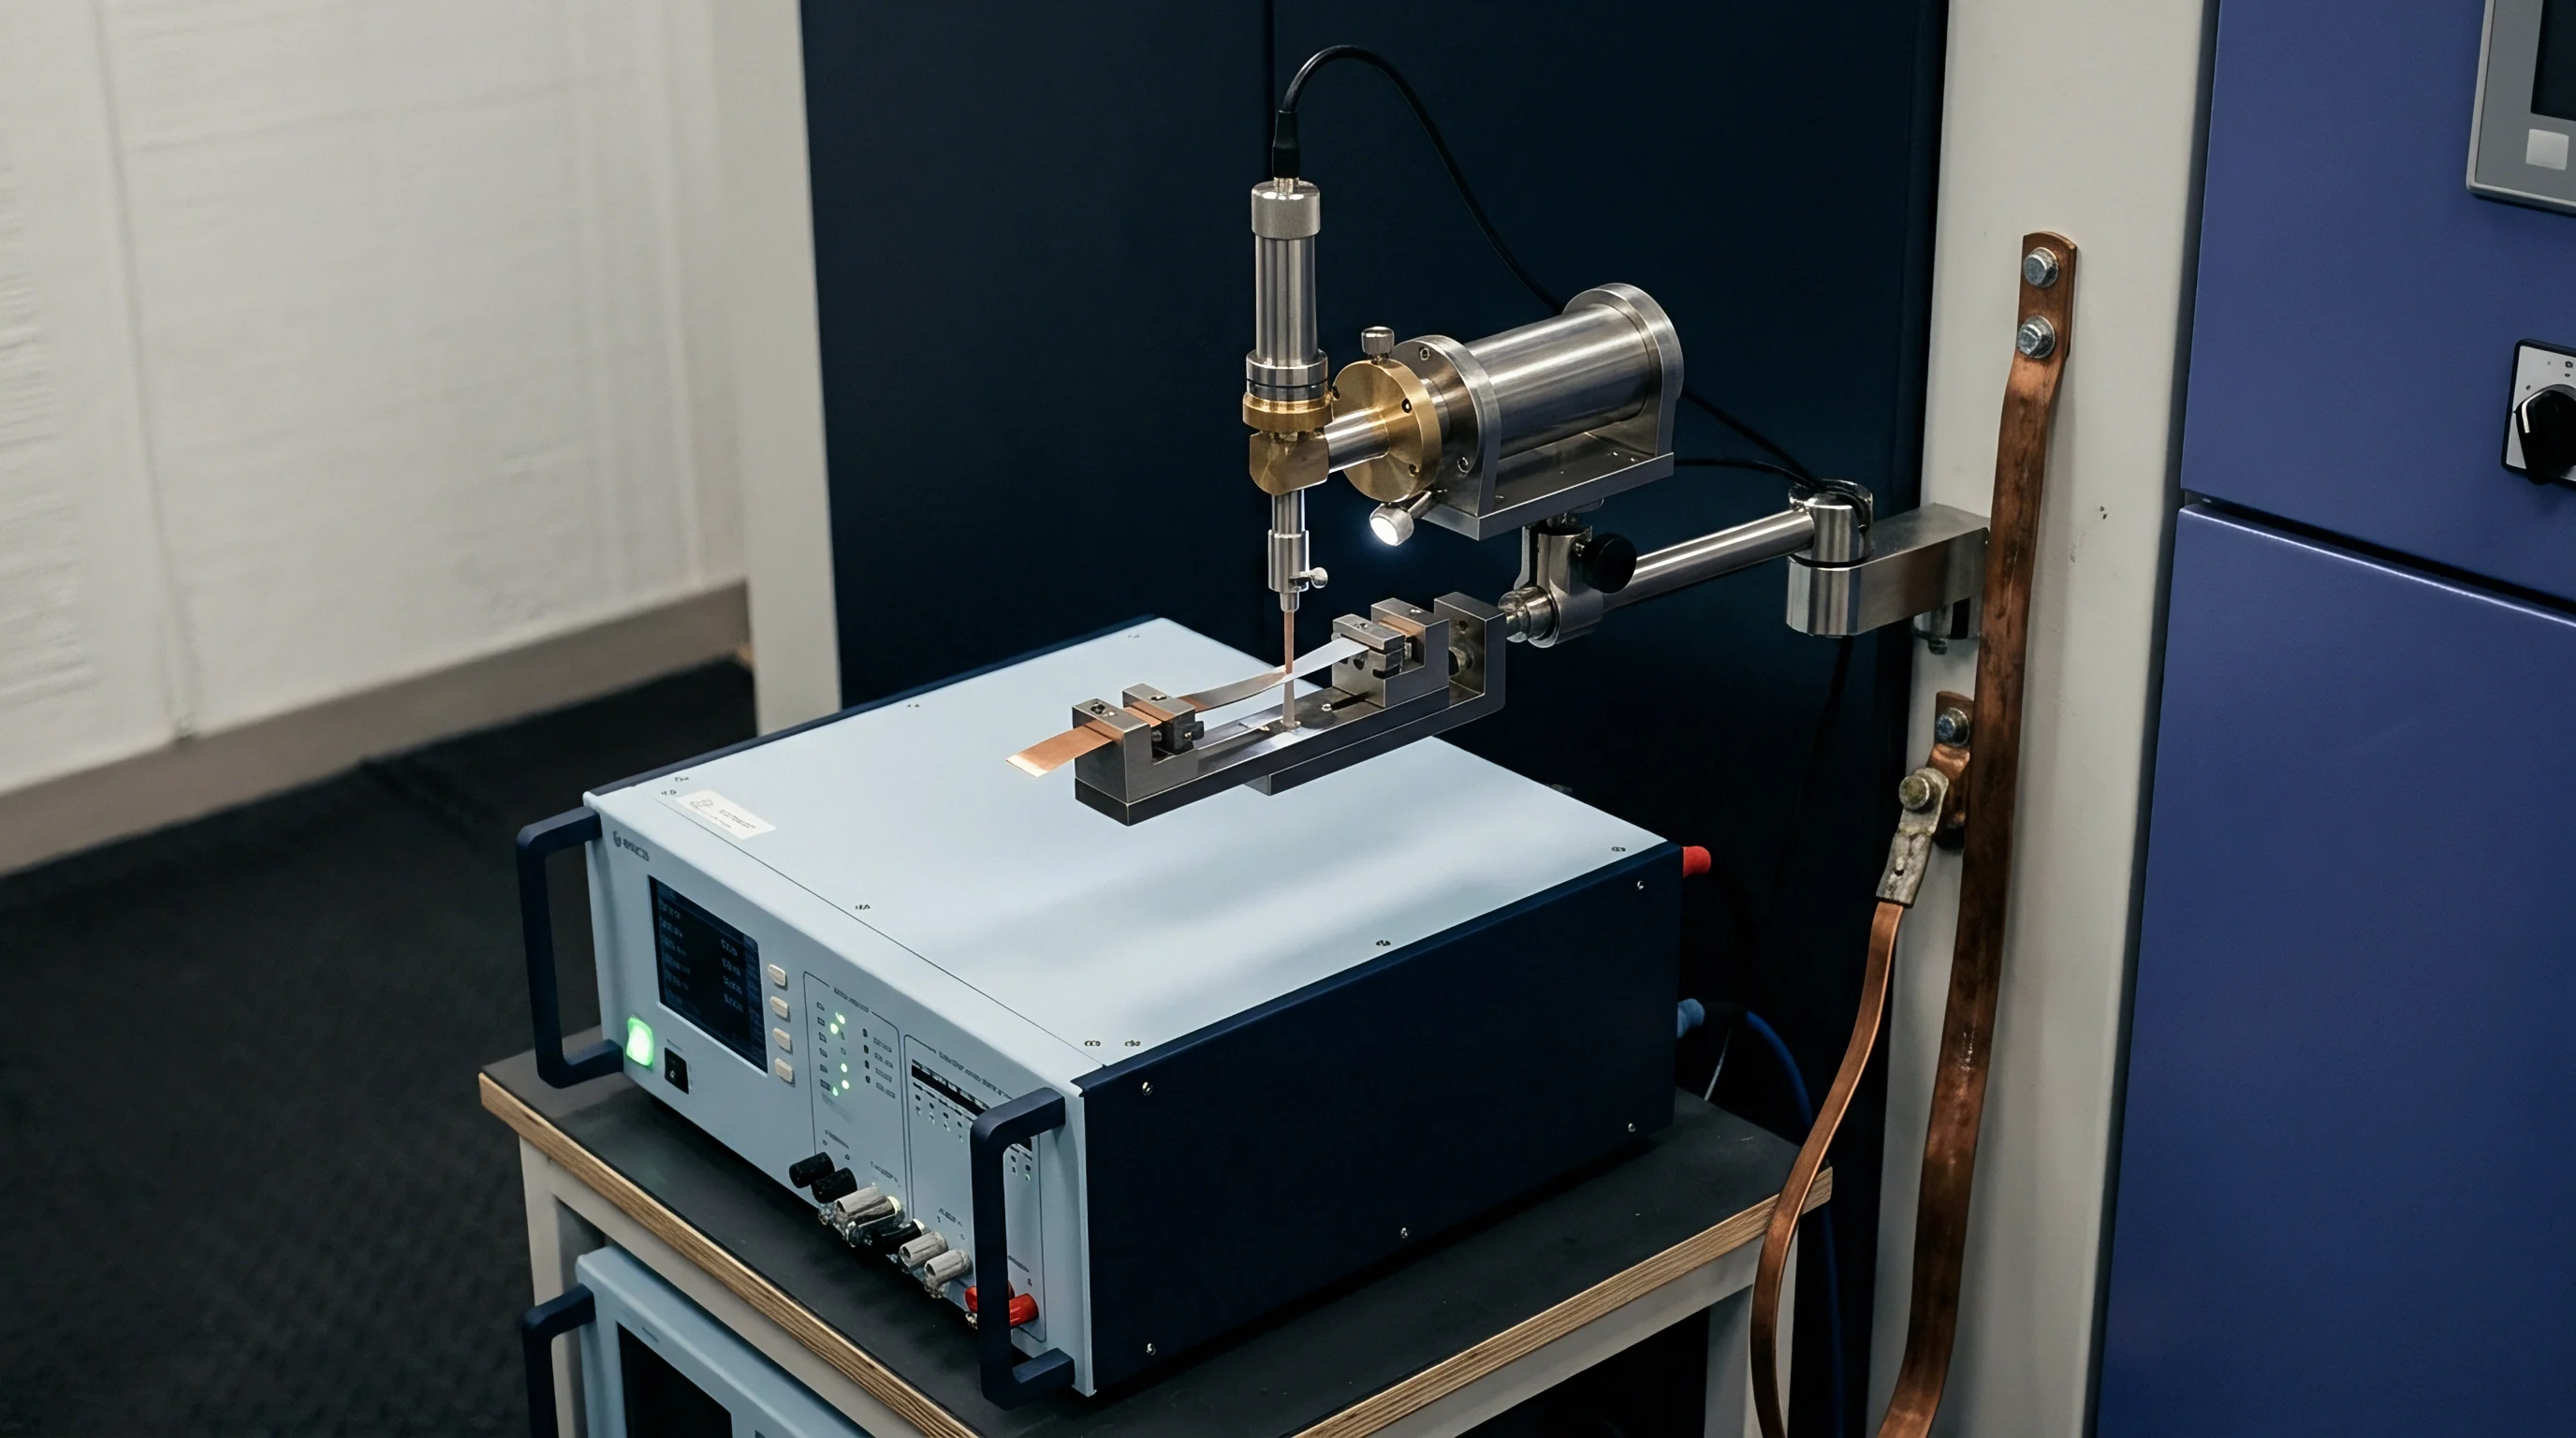
Calibration standards for high-volume manufacturing test lines match the physical footprint, terminal metallurgy, and equivalent electrical circuit of target production cells. Standard laboratory decade boxes or axial resistors fail to replicate the low self-inductance and micro-ohm resistance scales encountered on automated cell testing nests. Precision calibration artifacts utilize four-terminal manganin or evarchrom precision shunts integrated into cell-shaped mechanical housings.
Automated calibration routines insert reference standard artifacts into test channels at predefined maintenance intervals or during cell type changeovers. The artifact establishes zero-offset baseline data, correcting for drift in downstream instrumentation amplification chains.

Precision Shunt Standards and Dummy Cell Designs
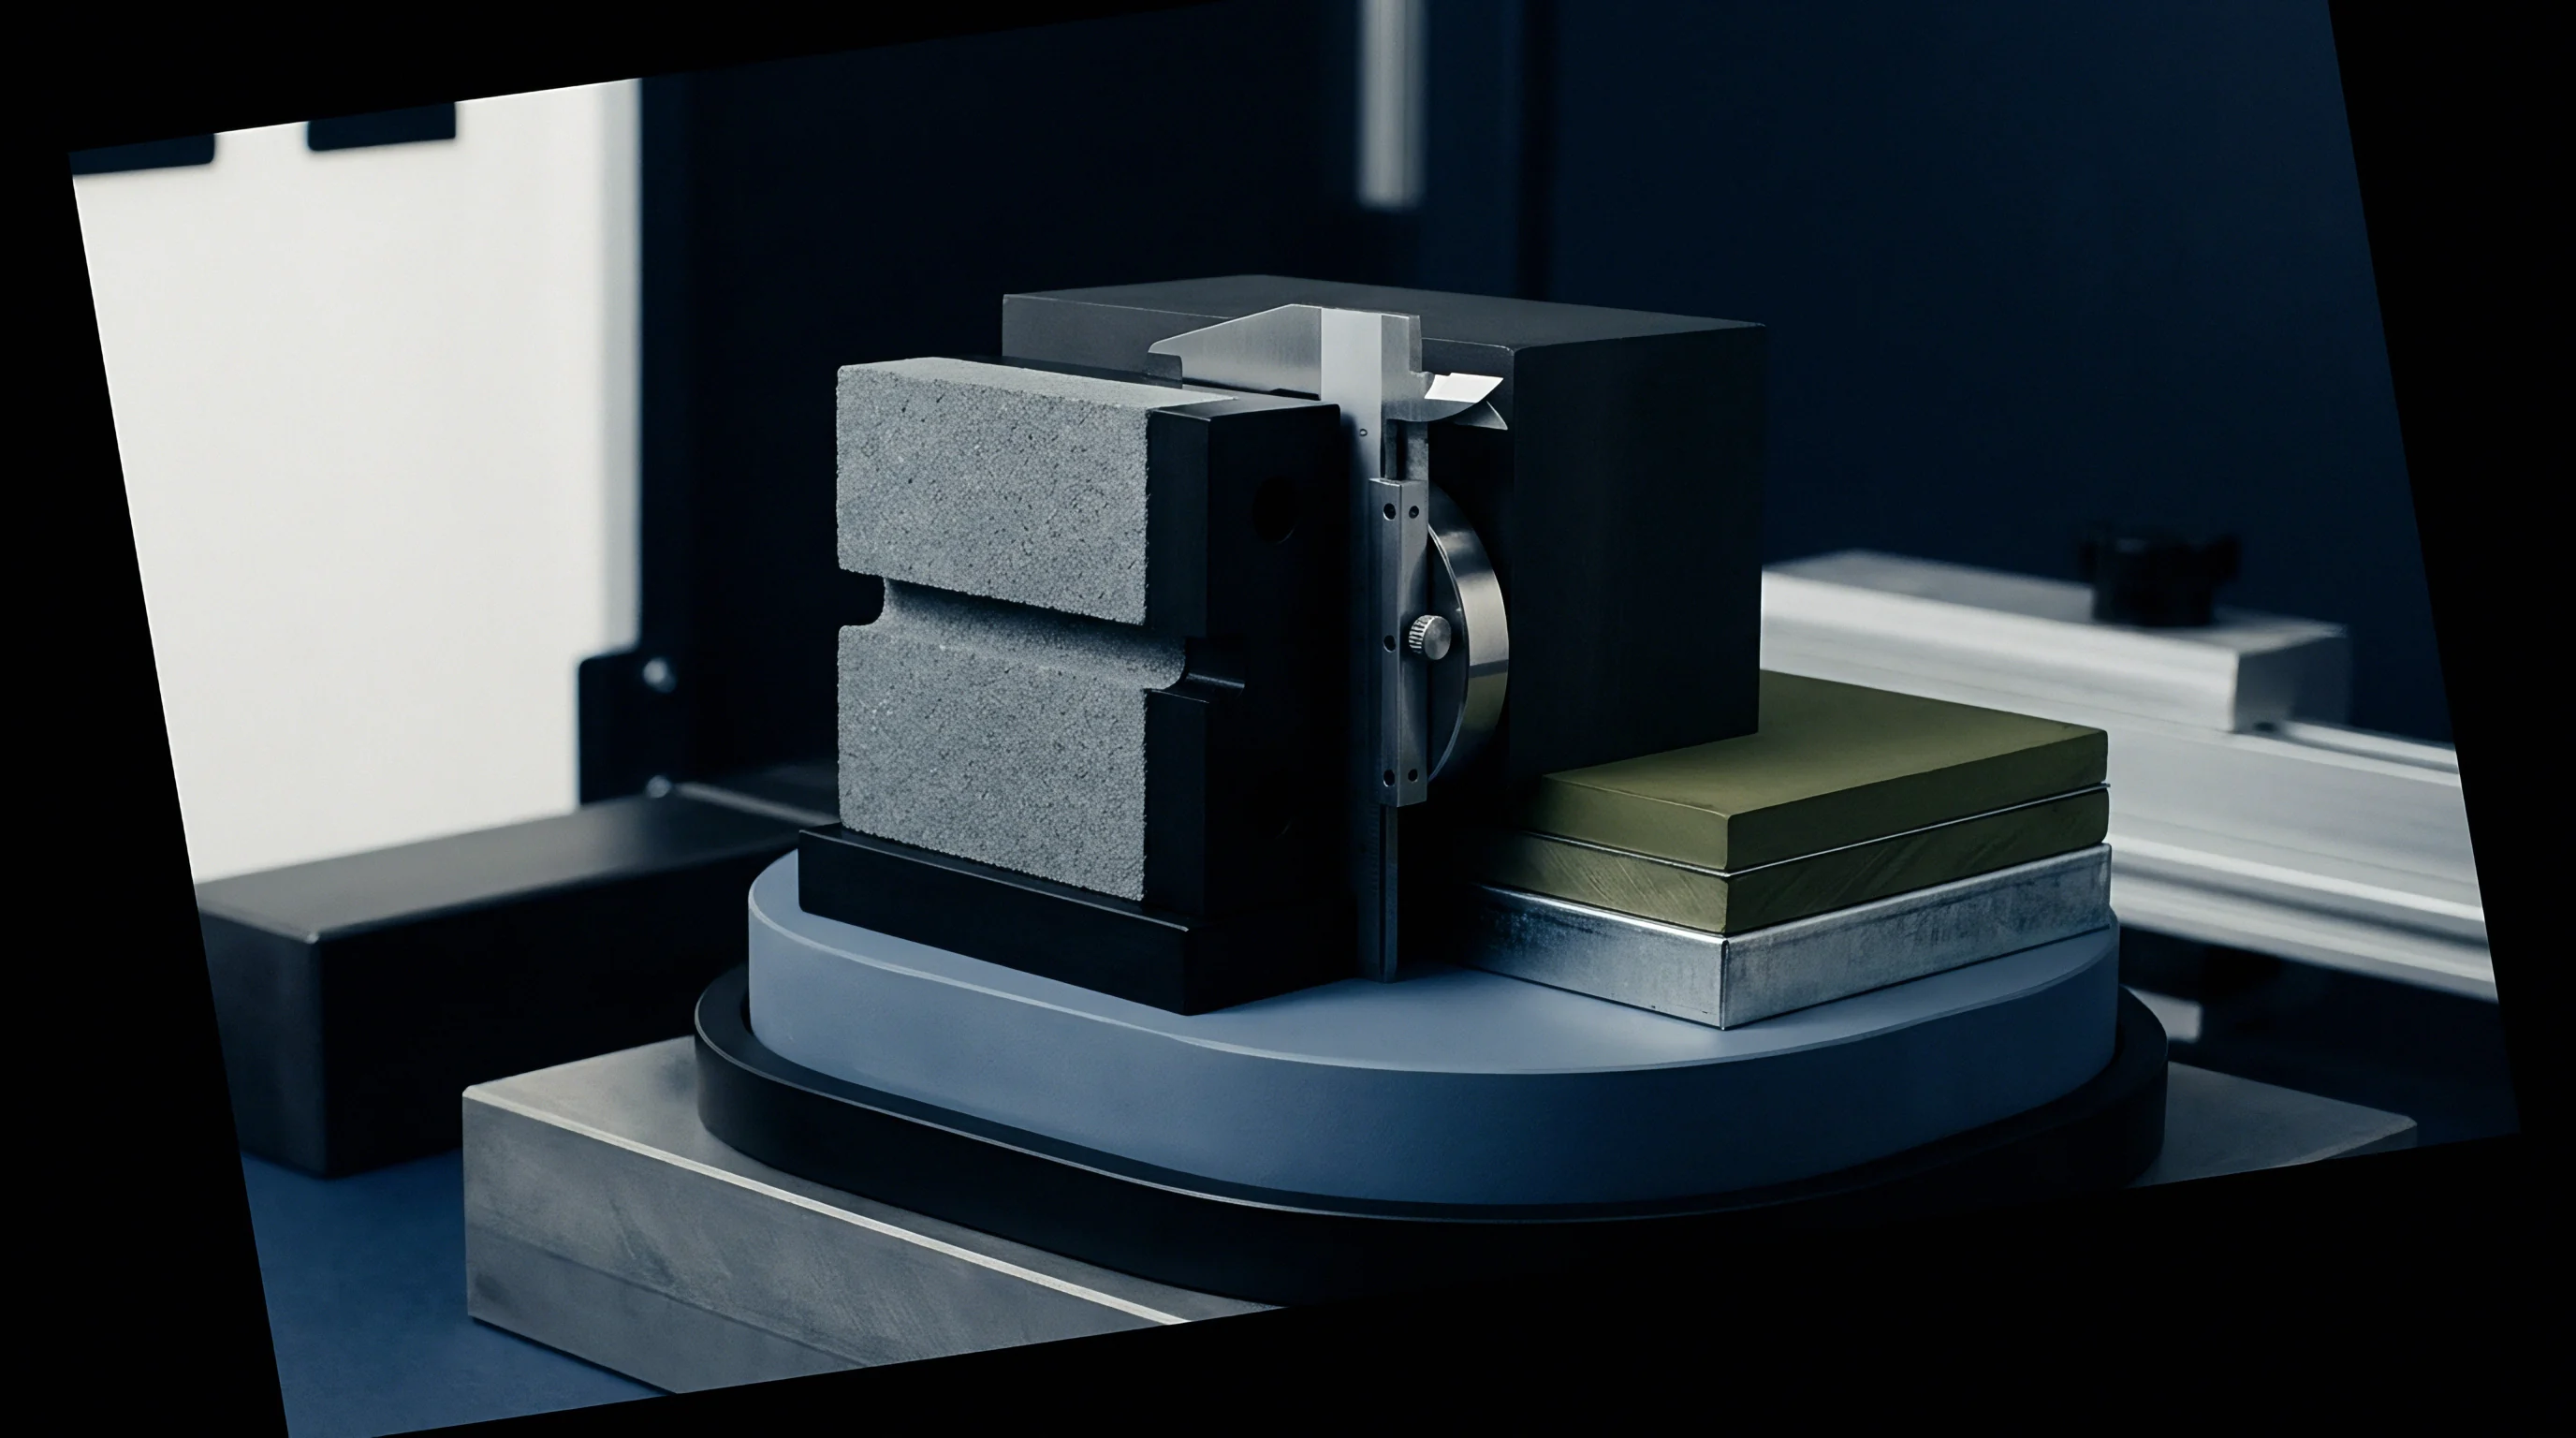
Reference artifacts incorporate non-inductive four-wire precision resistors mounted within milled aluminum or polyether ether ketone (PEEK) enclosures matching 18650, 21700, or 4680 cell dimensions, as well as pouch cell tab geometries. Resistor elements require temperature coefficients of resistance (TCR) below 5 ppm/K to maintain stability across line operating temperatures ranging from 18 to 35 degrees Celsius.
Automated fixture validation relies on a portfolio of calibration artifacts covering the complete operating range of the production line:
- Zero-impedance shorting artifacts establish absolute baseline inductance and force-sense offset values across high-frequency measurement channels.
- Low-resistance standard artifacts provide certified resistance values between 0.50 and 2.00 milliohms with absolute measurement uncertainty below 0.1 percent.
- High-resistance standard artifacts evaluate channel sensitivity to minor insulation breakdown, poor probe seating, and high contact impedance.
- Complex impedance artifacts embed precision metallic film caps alongside resistance elements to verify phase angle accuracy during multi-frequency electrochemical impedance spectroscopy (EIS) sweeps.
Thermal Coefficient Corrections during Calibration Runs
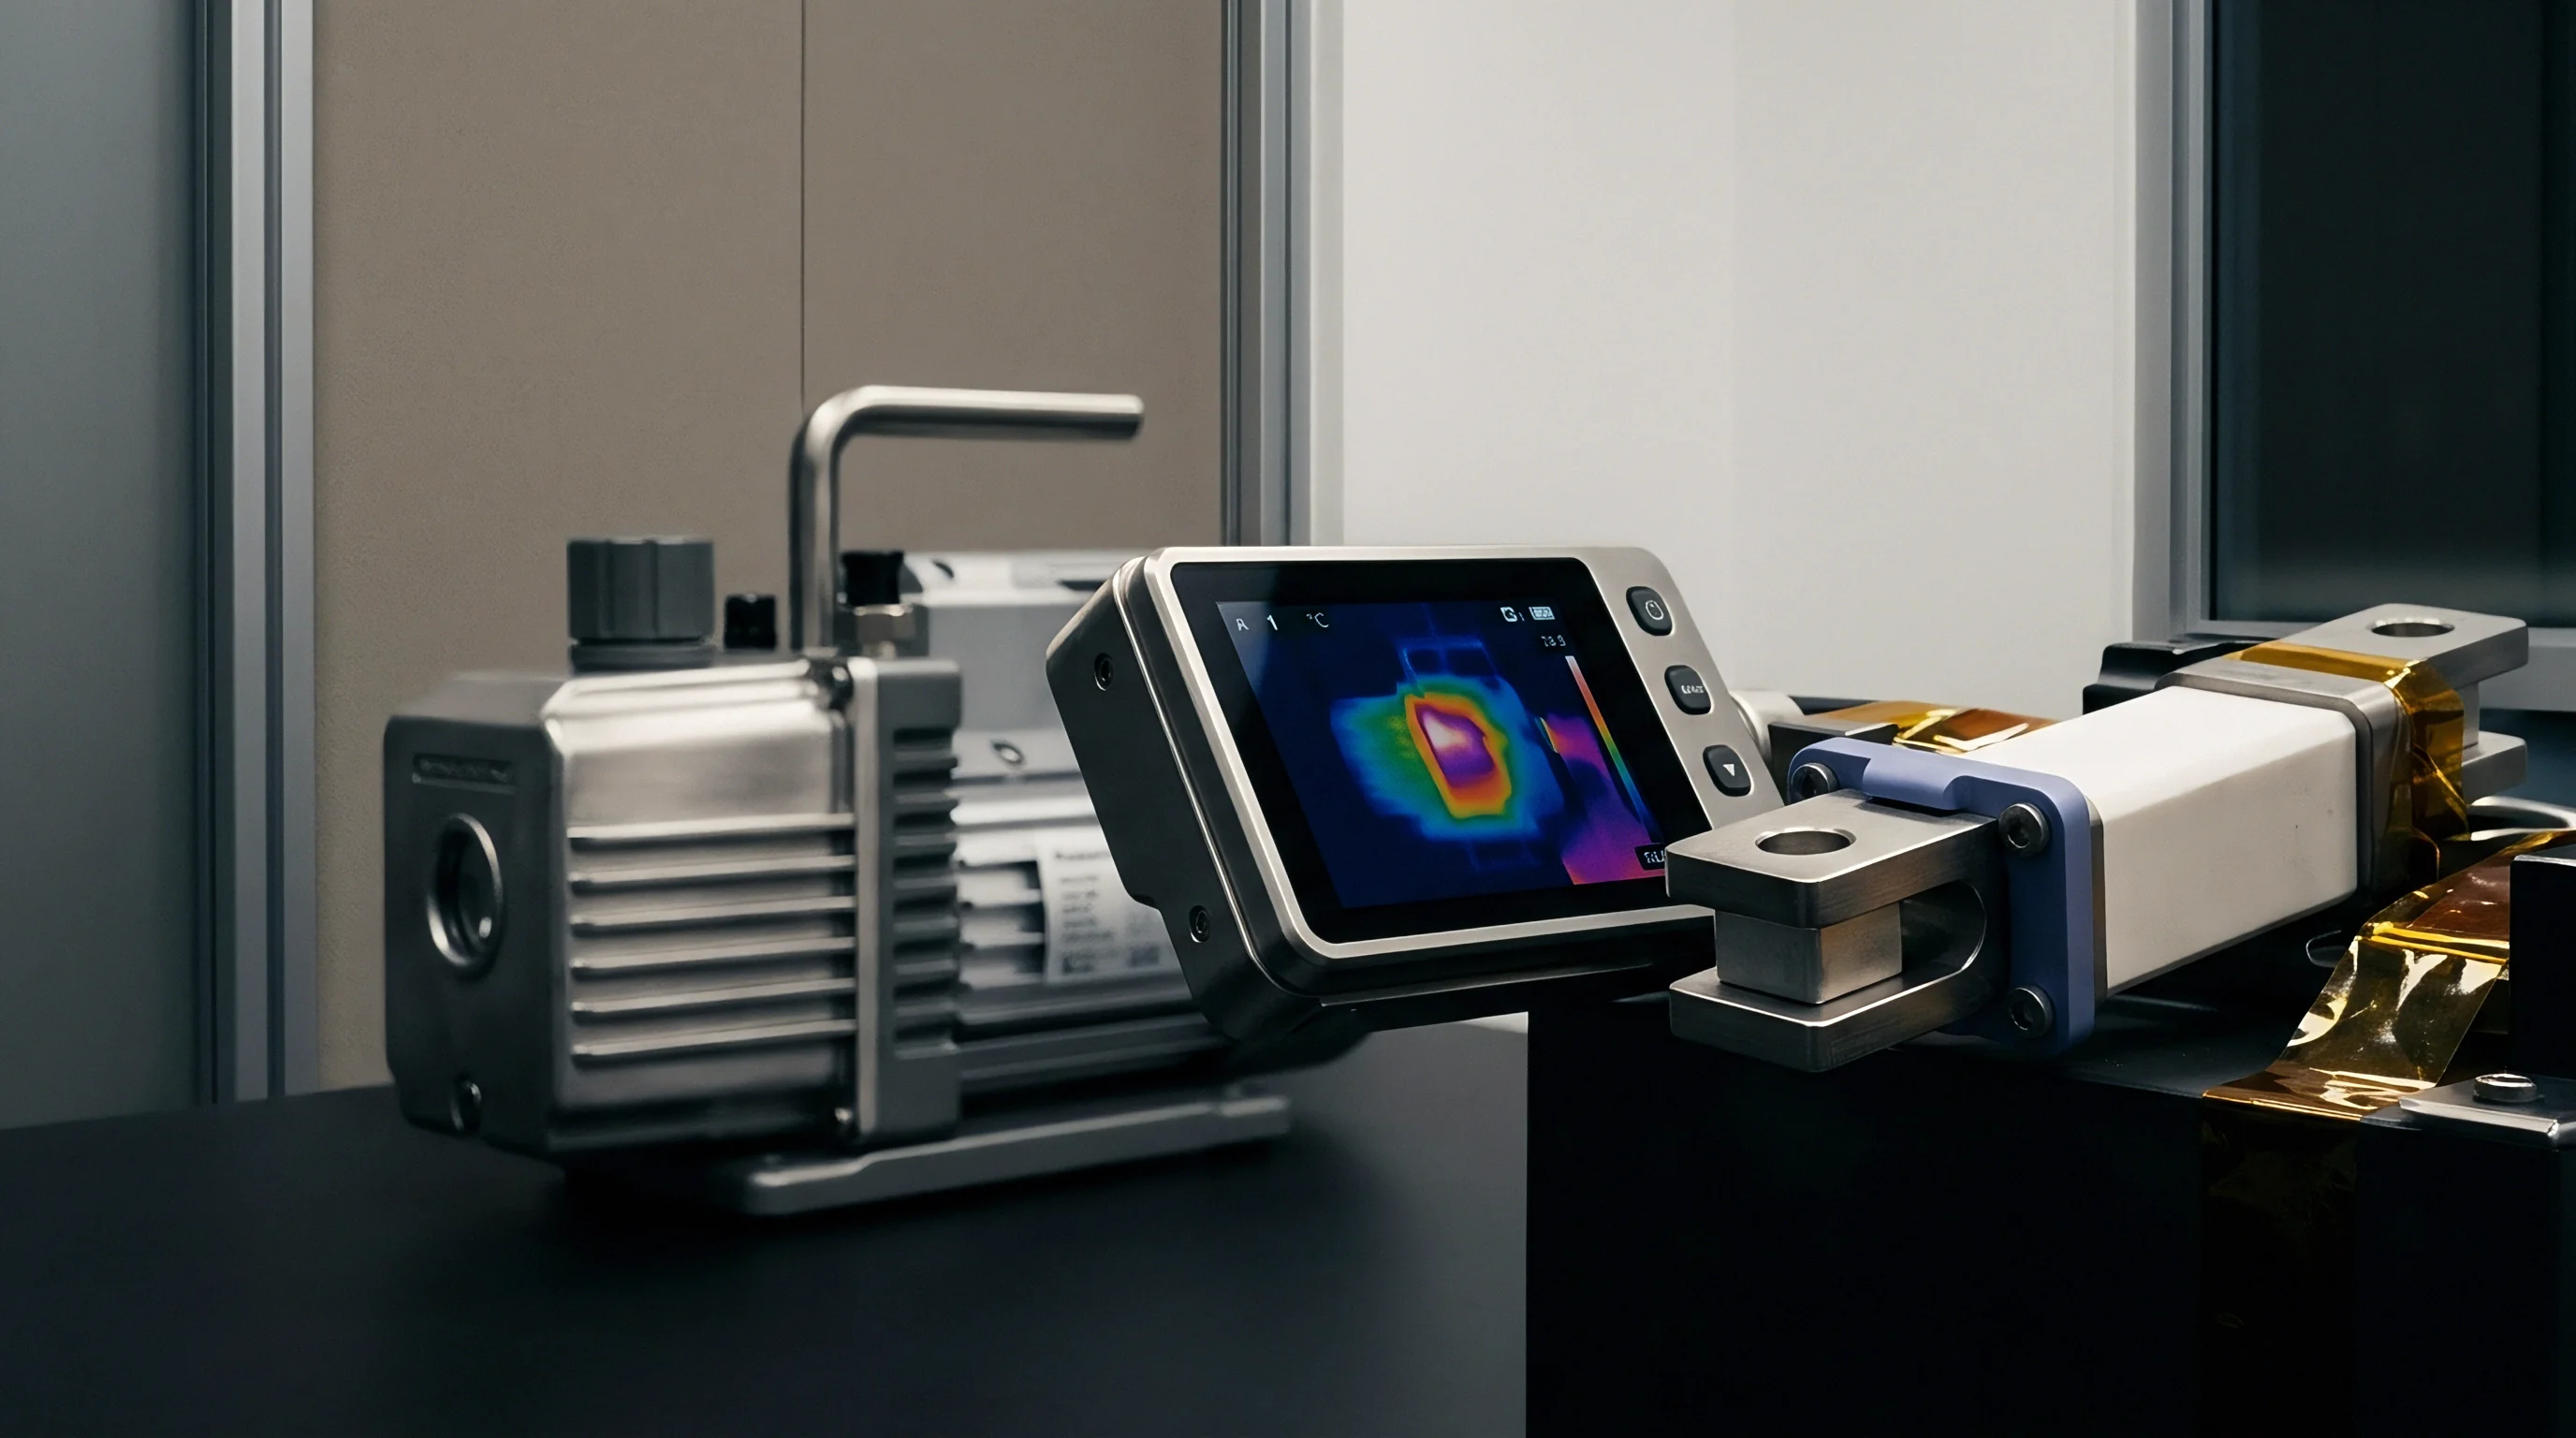
Continuous production testing generates localized heating within test fixtures due to high current passage and continuous pneumatic solenoid activation. Calibration artifact routines measure internal artifact temperature via embedded digital sensors, executing real-time polynomial compensation for thermal resistor drift.
Mastering routines execute at designated intervals to map environmental thermal gradients across multi-channel testing blocks. If a 64-channel formation nest experiences a 4 Kelvin thermal gradient between interior and exterior testing slots, uncompensated baseline calibration generates a systematic resistance offset shift across channels. Master fixture calibration software records slot-specific temperature profiles, adjusting calibration gains per channel position.
Mid-shift calibration failures are frequently attributed to unconditioned room air rather than contact spring hysteresis.

Wear
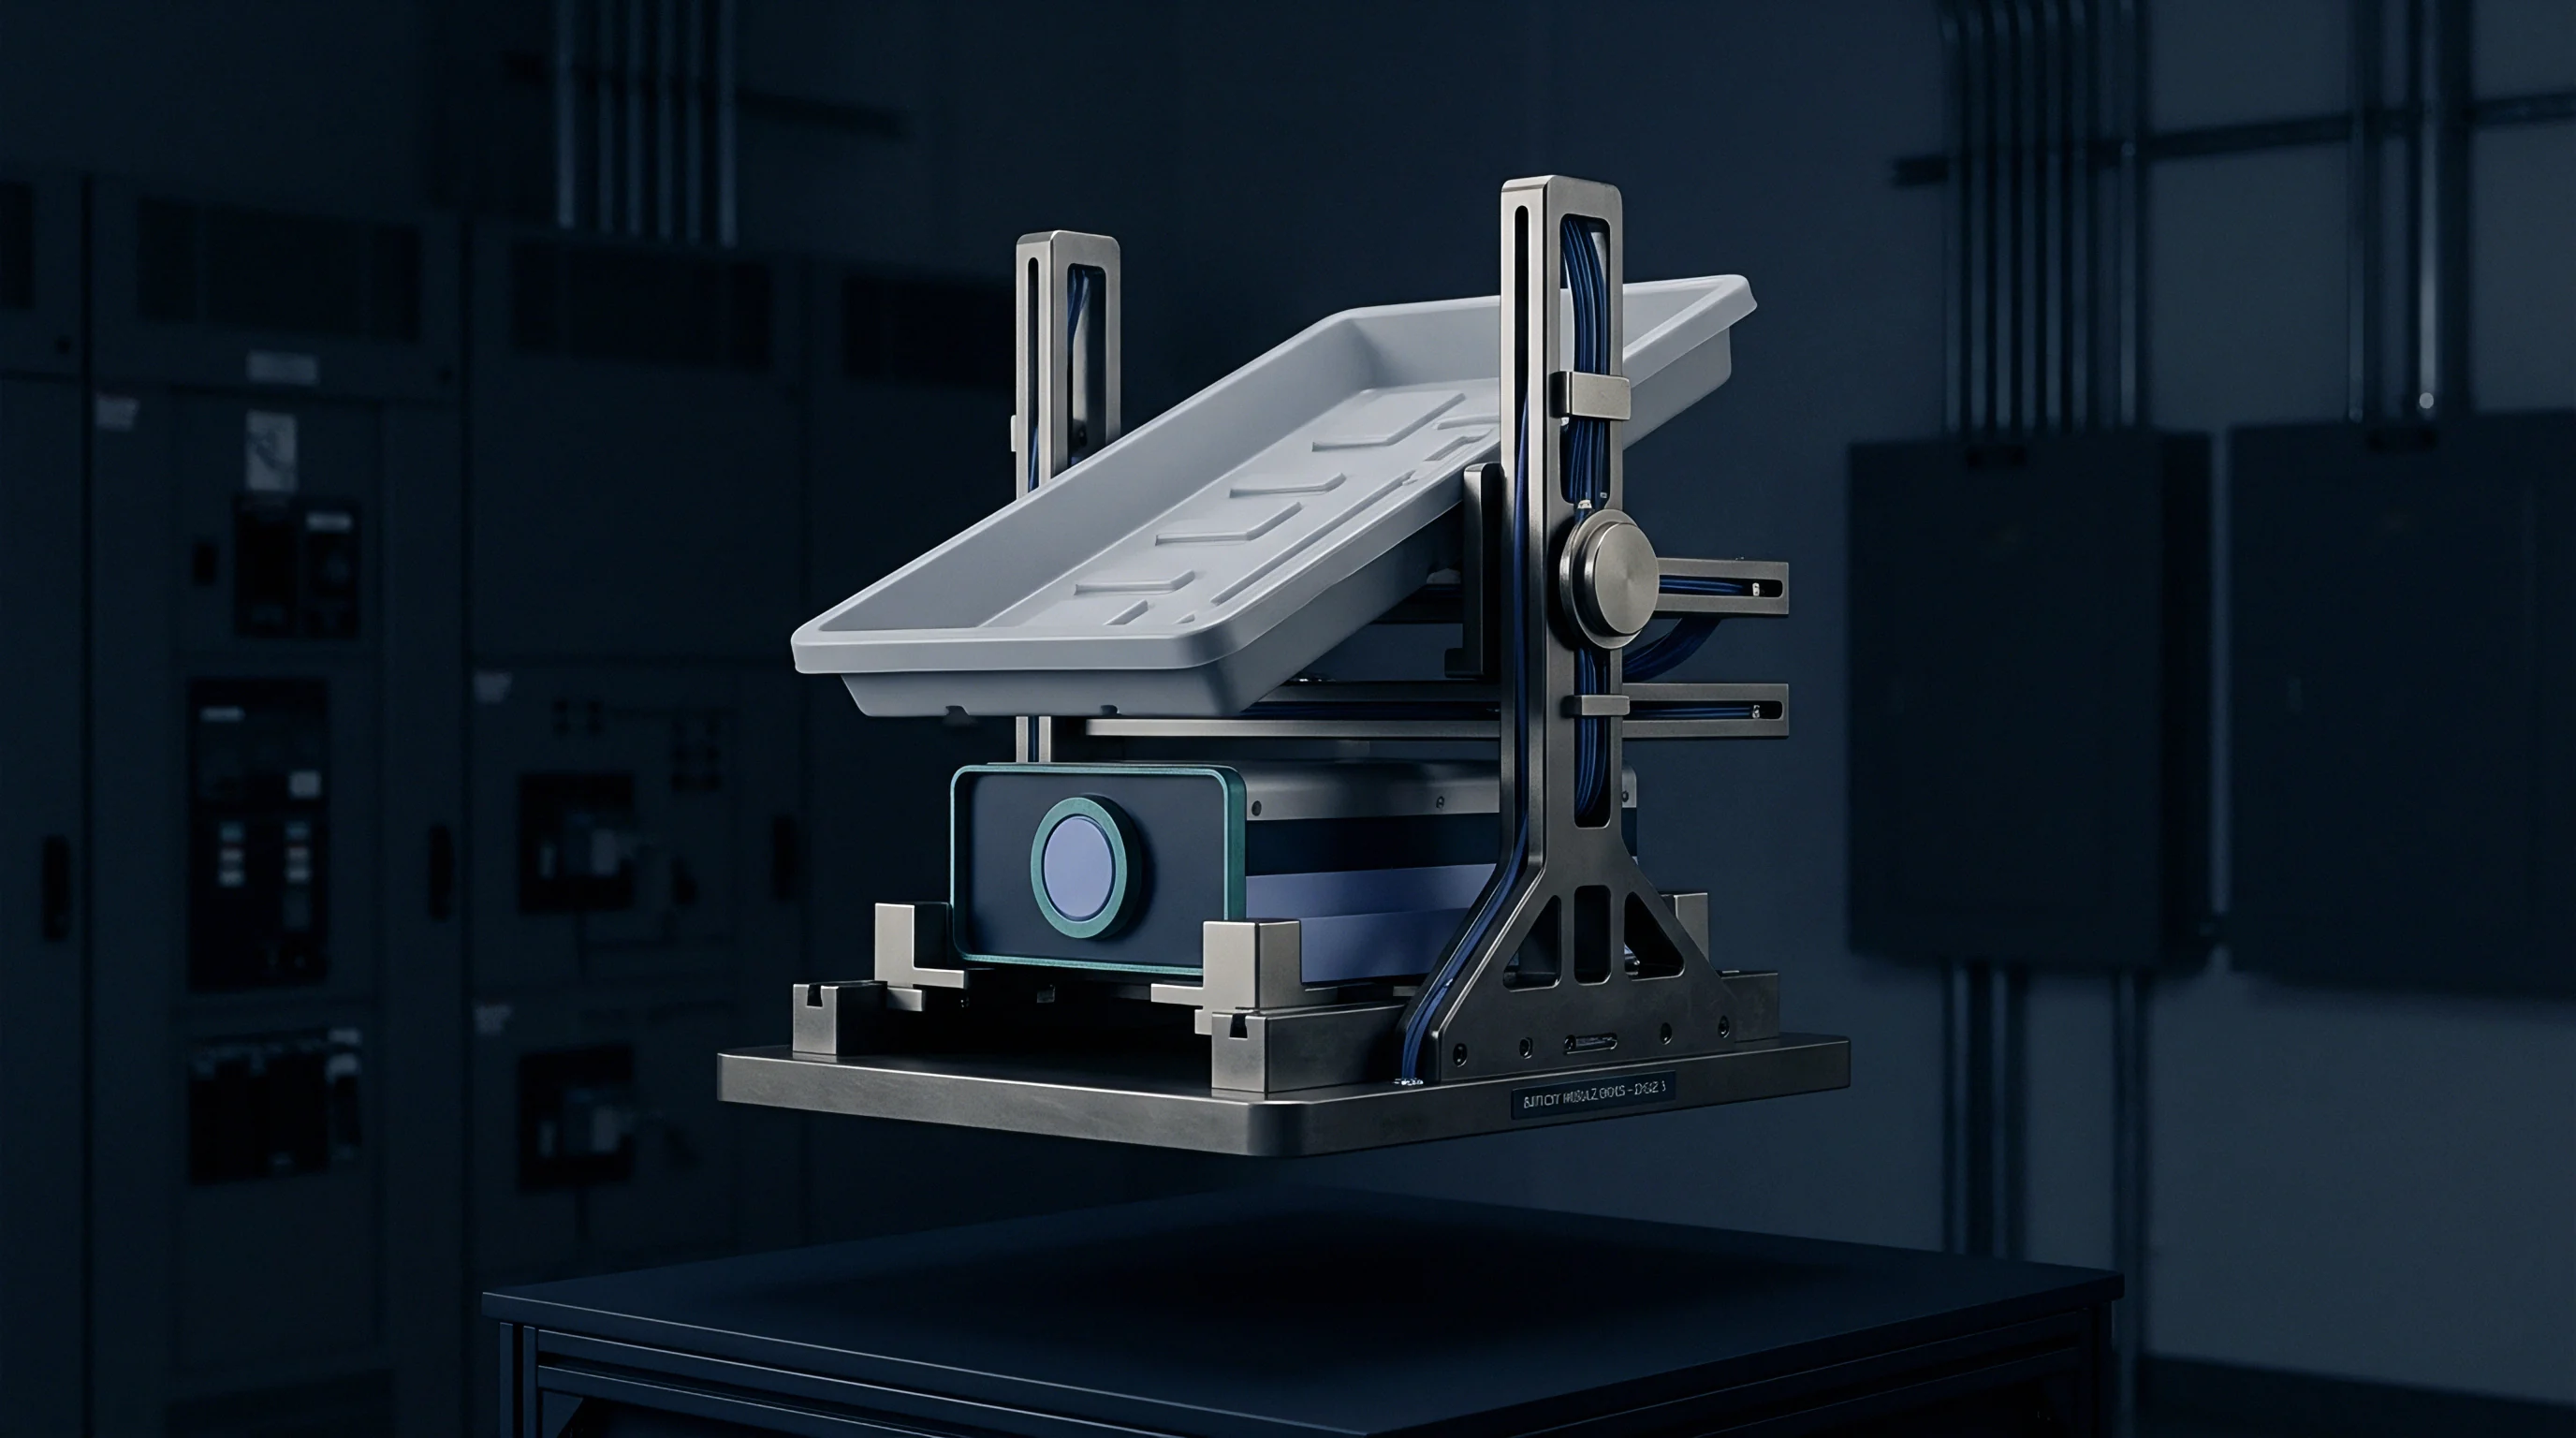
Repeated insertion cycles erode gold plating, deform tip geometries, and pack insulating electrolyte particulates into pogo pin structures. Microscopic surface degradation alters contact surface area, driving resistance instability across consecutive cell test cycles.
As internal probe springs undergo millions of compression cycles, structural relaxation reduces nominal contact force from 3.0 Newtons down to below 1.5 Newtons. Lower contact pressure allows surface oxide films on aluminum or nickel-plated cell terminals to remain intact, elevating observed contact resistance by up to 500 micro-ohms.

Pogo Pin Degradation and Contamination Kinetics
Cell production lines generate ambient microscopic debris, including aluminum dust from tab trimming, electrolyte solvent vapor condensates, and ambient dust. Particulates accumulate within crown pin flutes and spring channels. High localized current densities during DC pulse testing cause micro-welding events between probe tips and cell terminals, transferring metal particles and pitting contact surfaces.
| Tip Profile | Self-Cleaning Action | Contact Force per Pin | Debris Sensitivity | Cleaning Interval (Cycles) |
|---|---|---|---|---|
| 4-Point Crown Tip | Moderate (rotational bite) | 2.5 to 3.5 N | High (flute clogging) | 5,000 |
| Serrated Blade Tip | High (linear wiping action) | 3.0 to 5.0 N | Moderate | 8,000 |
| Single Spear Point | Low (direct penetration) | 1.5 to 2.5 N | Low | 2,000 |
| Hemispherical Flat Tip | None (flat compression) | 4.0 to 6.0 N | Severe (surface film build) | 1,000 |
What Dynamic Threshold Signals Probe Fatigue?
Automated test software continuously monitors standard deviation metrics of measured resistance across consecutive production lots. A progressive rise in rolling standard deviation signals localized pin tip degradation prior to complete open-circuit failure. When force sensing lines record transient voltage spikes during current pulse initiation, contact chatter caused by spring stress relaxation is occurring.
Cleaning probe tips with automated solvent wipes before plating erosion exposes base metal preserves measurement accuracy without interrupting line pace.
Automated inline cleaning modules deploy rotating solvent-impregnated brushes or ultrasonic air nozzles directly to fixture probe heads during empty palette return cycles. Solvent cleaning dissolves organic electrolyte residues and sweeps away unattached metallic particulates. Once the hard gold layer over nickel-copper substrate wear exceeds 0.5 micrometers depth, base metal oxidation mandates complete probe pin replacement.
Probe tip replacement occurs prior to visible gold layer penetration to prevent copper intermetallic transfer to cell terminals.
Compensation
Software algorithms execute online compensation to isolate true electrochemical cell performance from shifting mechanical and thermal fixture baselines. Automated data collection systems capture raw voltage and current time-series data at sampling rates exceeding 100 kHz, filtering line noise and applying high-order mathematical correction matrices in real time.
Dynamic baseline compensation tracks subtle fixture changes caused by contact heating and mechanical settling. System algorithms calculate running median resistance values across rolling windows of 500 contiguous cell tests per channel, rejecting single-point outliers caused by misaligned cell insertions.
Real-Time Parasitic Resistance Subtraction Algorithms
Mathematical subtraction of parasitic fixture impedance relies on continuous circuit parameters derived during artifact calibration passes. The mathematical relationship governing real-time measured cell resistance is expressed as:
R_cell = (V_sense / I_force) – R_lead(T) – R_contact_offset(n)
R_lead(T) represents thermal resistance shift calculated from integrated lead harness temperature sensors. R_contact_offset(n) represents the age-dependent contact offset calibrated at cycle count n. If thermal compensation updates fall behind ambient line temperature changes, measurement error scales proportionally with current load.
Automated maintenance channels implement a strict four-stage execution sequence for software offset management:
- Continuous measurement of ambient harness temperature occurs via embedded thermocouples situated adjacent to Kelvin sensing blocks.
- Software subtracts calculated lead resistance variations using copper thermal coefficients before recording raw cell voltage drops.
- Automated open-circuit and short-circuit reference checks execute during cell loading intervals to verify channel zero offset.
- Channel isolation checks run every hundred cycles to confirm no cross-talk exists between adjacent cell testing slots.
Frequency Domain Calibration for ACIR and DCIR
ACIR measurement at 1 kHz requires precise phase alignment between excitation current vectors and response voltage vectors. Inductive lead parasitics shift response phase angles, mixing real and imaginary impedance components. Online compensation applies dynamic phase rotation matrices derived from high-frequency short-circuit calibration tests.
Technical agreements specifying test bench gauge repeatability and reproducibility below five percent force tight control over dynamic software offset adjustments.
DCIR measurements utilize high-current step pulses ranging from 100 milliseconds to 10 seconds. Dynamic contact heating during multi-second pulses changes probe resistance during the measurement window. Software algorithms filter contact heating curves out of voltage step responses to isolate true lithium-ion mass transfer and charge transfer overpotentials.
Whether machine-learning models can reliably distinguish probe tip oxidation from genuine cell electrolyte degradation during continuous fast-charging pulse tests remains open to verification across high-volume production lines.

Integration
Line integration of automated test fixtures demands balancing physical line speed against electrical signal settling times. Modern high-capacity cell factories run continuous production lines producing over 100,000 cells per day per line. Test stations must execute mechanical clamping, open-circuit voltage (OCV) measurement, 1 kHz ACIR verification, high-current DCIR pulse testing, and unclamping within total channel dwell times under 2.5 seconds.
Improper fixture design or uncompensated probe drift creates artificial yield loss by failing good cells or, worse, passing high-impedance defective cells into pack assembly streams. False failures drive unnecessary cell recycling costs and overload rework stations.
End-of-Line Tester Throughput Optimization
Optimizing throughput requires parallel testing architectures where multi-channel clamp blocks engage incoming pallets of cylindrical cells or trays of pouch cells simultaneously. Pneumatic stroke speeds must be throttled: rapid impact causes pin tip bounce, causing micro-arcing and surface pitting, while slow actuation eats into measurement dwell times.
To quantify the commercial impact of fixture calibration accuracy on line economics, consider an automated manufacturing facility operating under the following parameters:
- Daily production volume: 100,000 prismatic cells with nominal 0.60 mΩ DCIR.
- DCIR quality specification limit: Upper Specification Limit (USL) set tightly at 0.70 mΩ.
- Baseline production scrap value: $15.00 per rejected cell.
- Uncompensated fixture measurement drift: +0.03 mΩ systematic upward offset across 12 channels due to uncalibrated lead oxidation and pin fatigue.
Under these operating conditions, cells measuring an actual DCIR of 0.68 mΩ are read as 0.71 mΩ by the drifting test channels. If 4 percent of daily production falls into the borderline 0.67 to 0.70 mΩ window, the affected test channels incorrectly fail approximately 333 cells per day. Over a 30-day operational month, this systematic measurement drift generates 9,990 false failures, resulting in $149,850 of direct scrap financial loss purely from fixture calibration neglect.
| Measurement Error Delta | False Rejection Rate | False Acceptance Rate | Monthly Financial Exposure (100k Line) | Primary Root Cause |
|---|---|---|---|---|
| +0.01 mΩ Offset | 0.45% | 0.00% | $20,250 (Scrap cost) | Minor thermal drift uncompensated |
| +0.03 mΩ Offset | 2.22% | 0.00% | $99,900 (Scrap cost) | Probe tip oxidation and lead resistance buildup |
| -0.03 mΩ Offset | 0.00% | 1.85% | $416,250 (Warranty risk) | Unchecked software auto-zero zeroing error |
| ±0.08 mΩ Noise Band | 3.10% | 1.15% | $398,250 (Combined scrap/risk) | Mechanical probe chatter and loose force wire |
Yield Loss and False Rejection Economics
False acceptances carry far higher commercial risk than false rejections. Delivering cells with undetected elevated internal resistance into high-power EV pack applications leads to premature thermal throttling, localized pack hot-spotting, and accelerated capacity loss. Quality engineers rely on rigorous audit qualification criteria for automated test nests before approving lines for mass production.
Fixture qualification relies on a structured operational checklist executed prior to sign-off:
- Kelvin loop integrity verification confirms separate force and sense paths to within ten millimeters of the cell terminal surface.
- Dynamic contact pressure monitoring ensures pogo pin compression remains within ten percent of nominal rating under full stroke.
- Automated standard insertion cycle validates system calibration automatically every four hours without manual operator intervention.
- Multi-frequency impedance capability allows switching between 1 kHz ACIR and multi-second DC pulse resistance checks on a single test nest.
Quality specifications mandating automated fixture locking upon three consecutive calibration sample failures prevent defective test channels from processing production cells.
Audit
Verification dossiers for battery buyers demand traceable calibration logs, fixture maintenance records, and periodic gauge repeatability and reproducibility (Gauge R&R) reports. Incoming inspection protocols at pack assembly plants frequently re-test cell internal resistance. If buyer incoming data diverges from factory end-of-line data by more than three percent, batch delivery acceptance halts pending line audit execution.
Audit procedures verify physical fixture maintenance logs alongside automated digital data streams. Calibration history files store every zero-offset execution, artifact serial code calibration certificate, and channel swap record. Data integrity checks confirm no manual override of soft calibration limits occurred during production shifts.
Traceability and Gage R and R Execution
Formal Gauge R&R studies evaluate measurement system variability relative to process tolerance bands. A standard 10-operator, 10-sample, 3-trial Gauge R&R executed on an automated test fixture must achieve a Precision-to-Toleration (%P/T) ratio below ten percent to qualify for critical safety-grade cell production. Total gauge variance combines equipment variation (repeatability) and appraiser variation (reproducibility across different automated shuttle stations).
Equipment variation dominates automated test fixture Gauge R&R results. Inconsistent contact force, thermal expansion of lead harnesses, and signal path switching relay jitter represent the primary sources of equipment variance. Regular replacement of high-cycle relays and probe spring sets maintains equipment variation within acceptable statistical bounds.
Fixture maintenance logs that lack automated probe cycle counts fail customer quality reviews during factory cell line qualifications.
Data Logging for Sourcing Dossiers
Cell buyers specify complete data transparency for end-of-line quality documentation. Test records capture individual cell serial numbers mapped directly to the specific test fixture channel ID, environmental ambient temperature, contact force reading, and calibration timestamp. If a cell batch exhibits field performance anomalies, historical fixture calibration logs enable rapid determination of whether test channel drift obscured production defects during factory grading.
Maintaining calibrated fixture records ensures clear defense against warranty claims resulting from micro-ohm resistance shifts on delivered cell lots.