Quantifying Microstructural Separator Pore Collapse and Gas Evolution in Long Term Stored Pouch Cells
Microstructural separator pore collapse and gas evolution during pouch cell storage exponentially increase internal impedance and drive irreversible capacity scrap rates

Pores
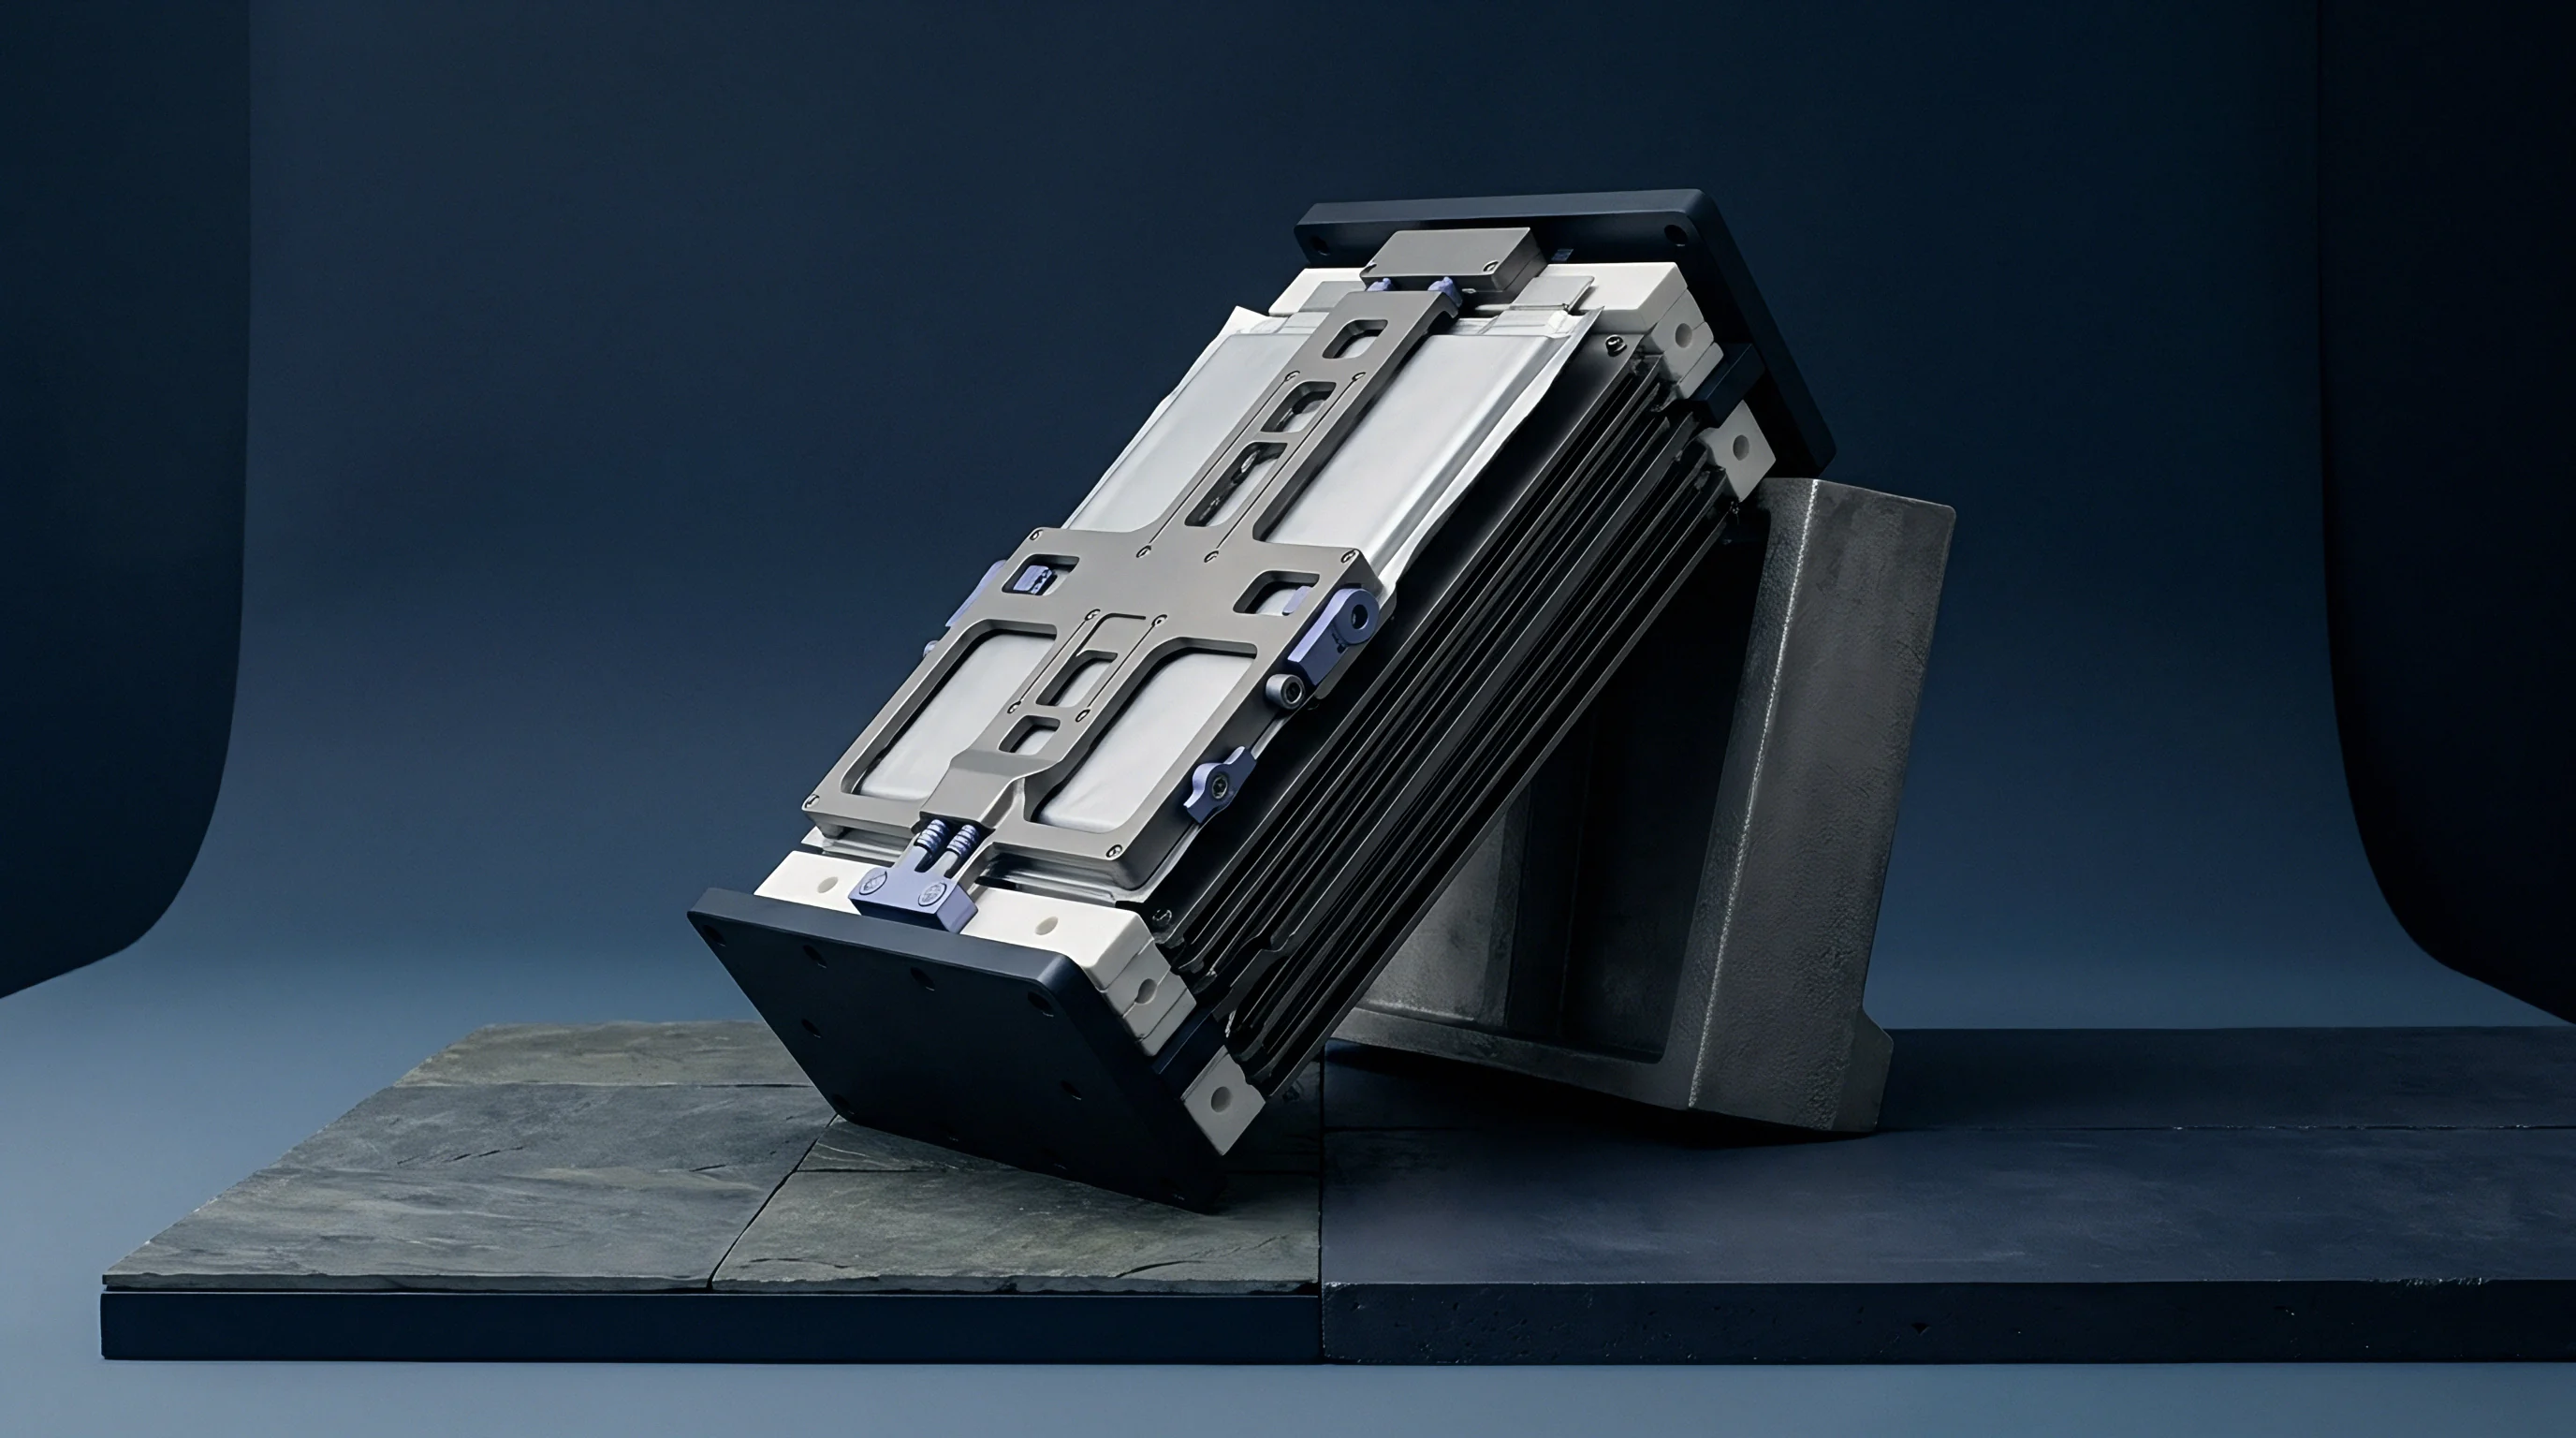
Under sustained stack pressure during extended storage, microporous polyolefin membranes undergo mechanical creep, changing fluid permeability and ion transport dynamics. Internal compressive stress inside a sealed pouch cell runs between 0.1 and 1.5 MPa, determined by initial fixture torque, pouch vacuum, and how the electrodes have swollen over time. Over twelve to thirty-six months of storage, wet-process polyethylene and dry-process polypropylene separators deform plastically in localized zones.
Pore collapse lowers overall bulk porosity and raises tortuosity, directly slowing lithium-ion mobility through the liquid electrolyte. This degradation happens without any charge cycling, driven purely by static mechanical loads, warm ambient storage, and continuous solvent absorption. Standard datasheets give baseline metrics for fresh separators ~ like Gurley porosity and Mullen burst strength ~ but those fresh figures offer little insight into long-term pore closure under stress.
Polyolefin separator matrices consist of semi-crystalline polymer networks where crystalline lamellae are tied together by amorphous polymer chains. Under long-term normal stress, those amorphous regions relax and realign. As the tie chains slip, open pore channels formed during biaxial stretching or dry extrusion collapse inward.
Absorbing solvent speeds up this breakdown by shifting the polymer’s glass transition temperature downward. Carbonate solvents like ethylene carbonate and dimethyl carbonate plasticize the polyethylene fibrils, promoting chain mobility at temperatures as low as 30°C. That structural collapse shrinks the effective void volume, cutting down the cross-sectional area through which liquid electrolyte can conduct.
Pore collapse is rarely uniform across the separator surface. Maximum compression builds directly beneath dense anode overhang zones and structural boundaries around tab welds, producing sharp spatial variations in separator thickness and pore distribution. Where pore closure is severe, local MacMullin numbers can exceed 15, well above nominal fresh values of 4 to 6.
The MacMullin number reflects the ratio of effective electrolyte resistivity inside the porous membrane to pure liquid electrolyte resistivity. High values flag restricted transport pathways, which bump up internal resistance and force current to concentrate in tighter zones during later cell operation.
Continuous stack pressure significantly accelerates this mechanical deformation over time.
Polyolefin Membrane Creep and Structural Decay Mechanisms
Wet-process polyethylene separators made by phase inversion feature highly interconnected, isotropic pores with initial porosities of 40 to 55 percent. By contrast, dry-process polypropylene separators have slit-like, anisotropic pores and lower starting porosities between 35 and 45 percent. While wet-process membranes offer higher initial ionic conductivity, they prove far more susceptible to compressive creep during extended storage.
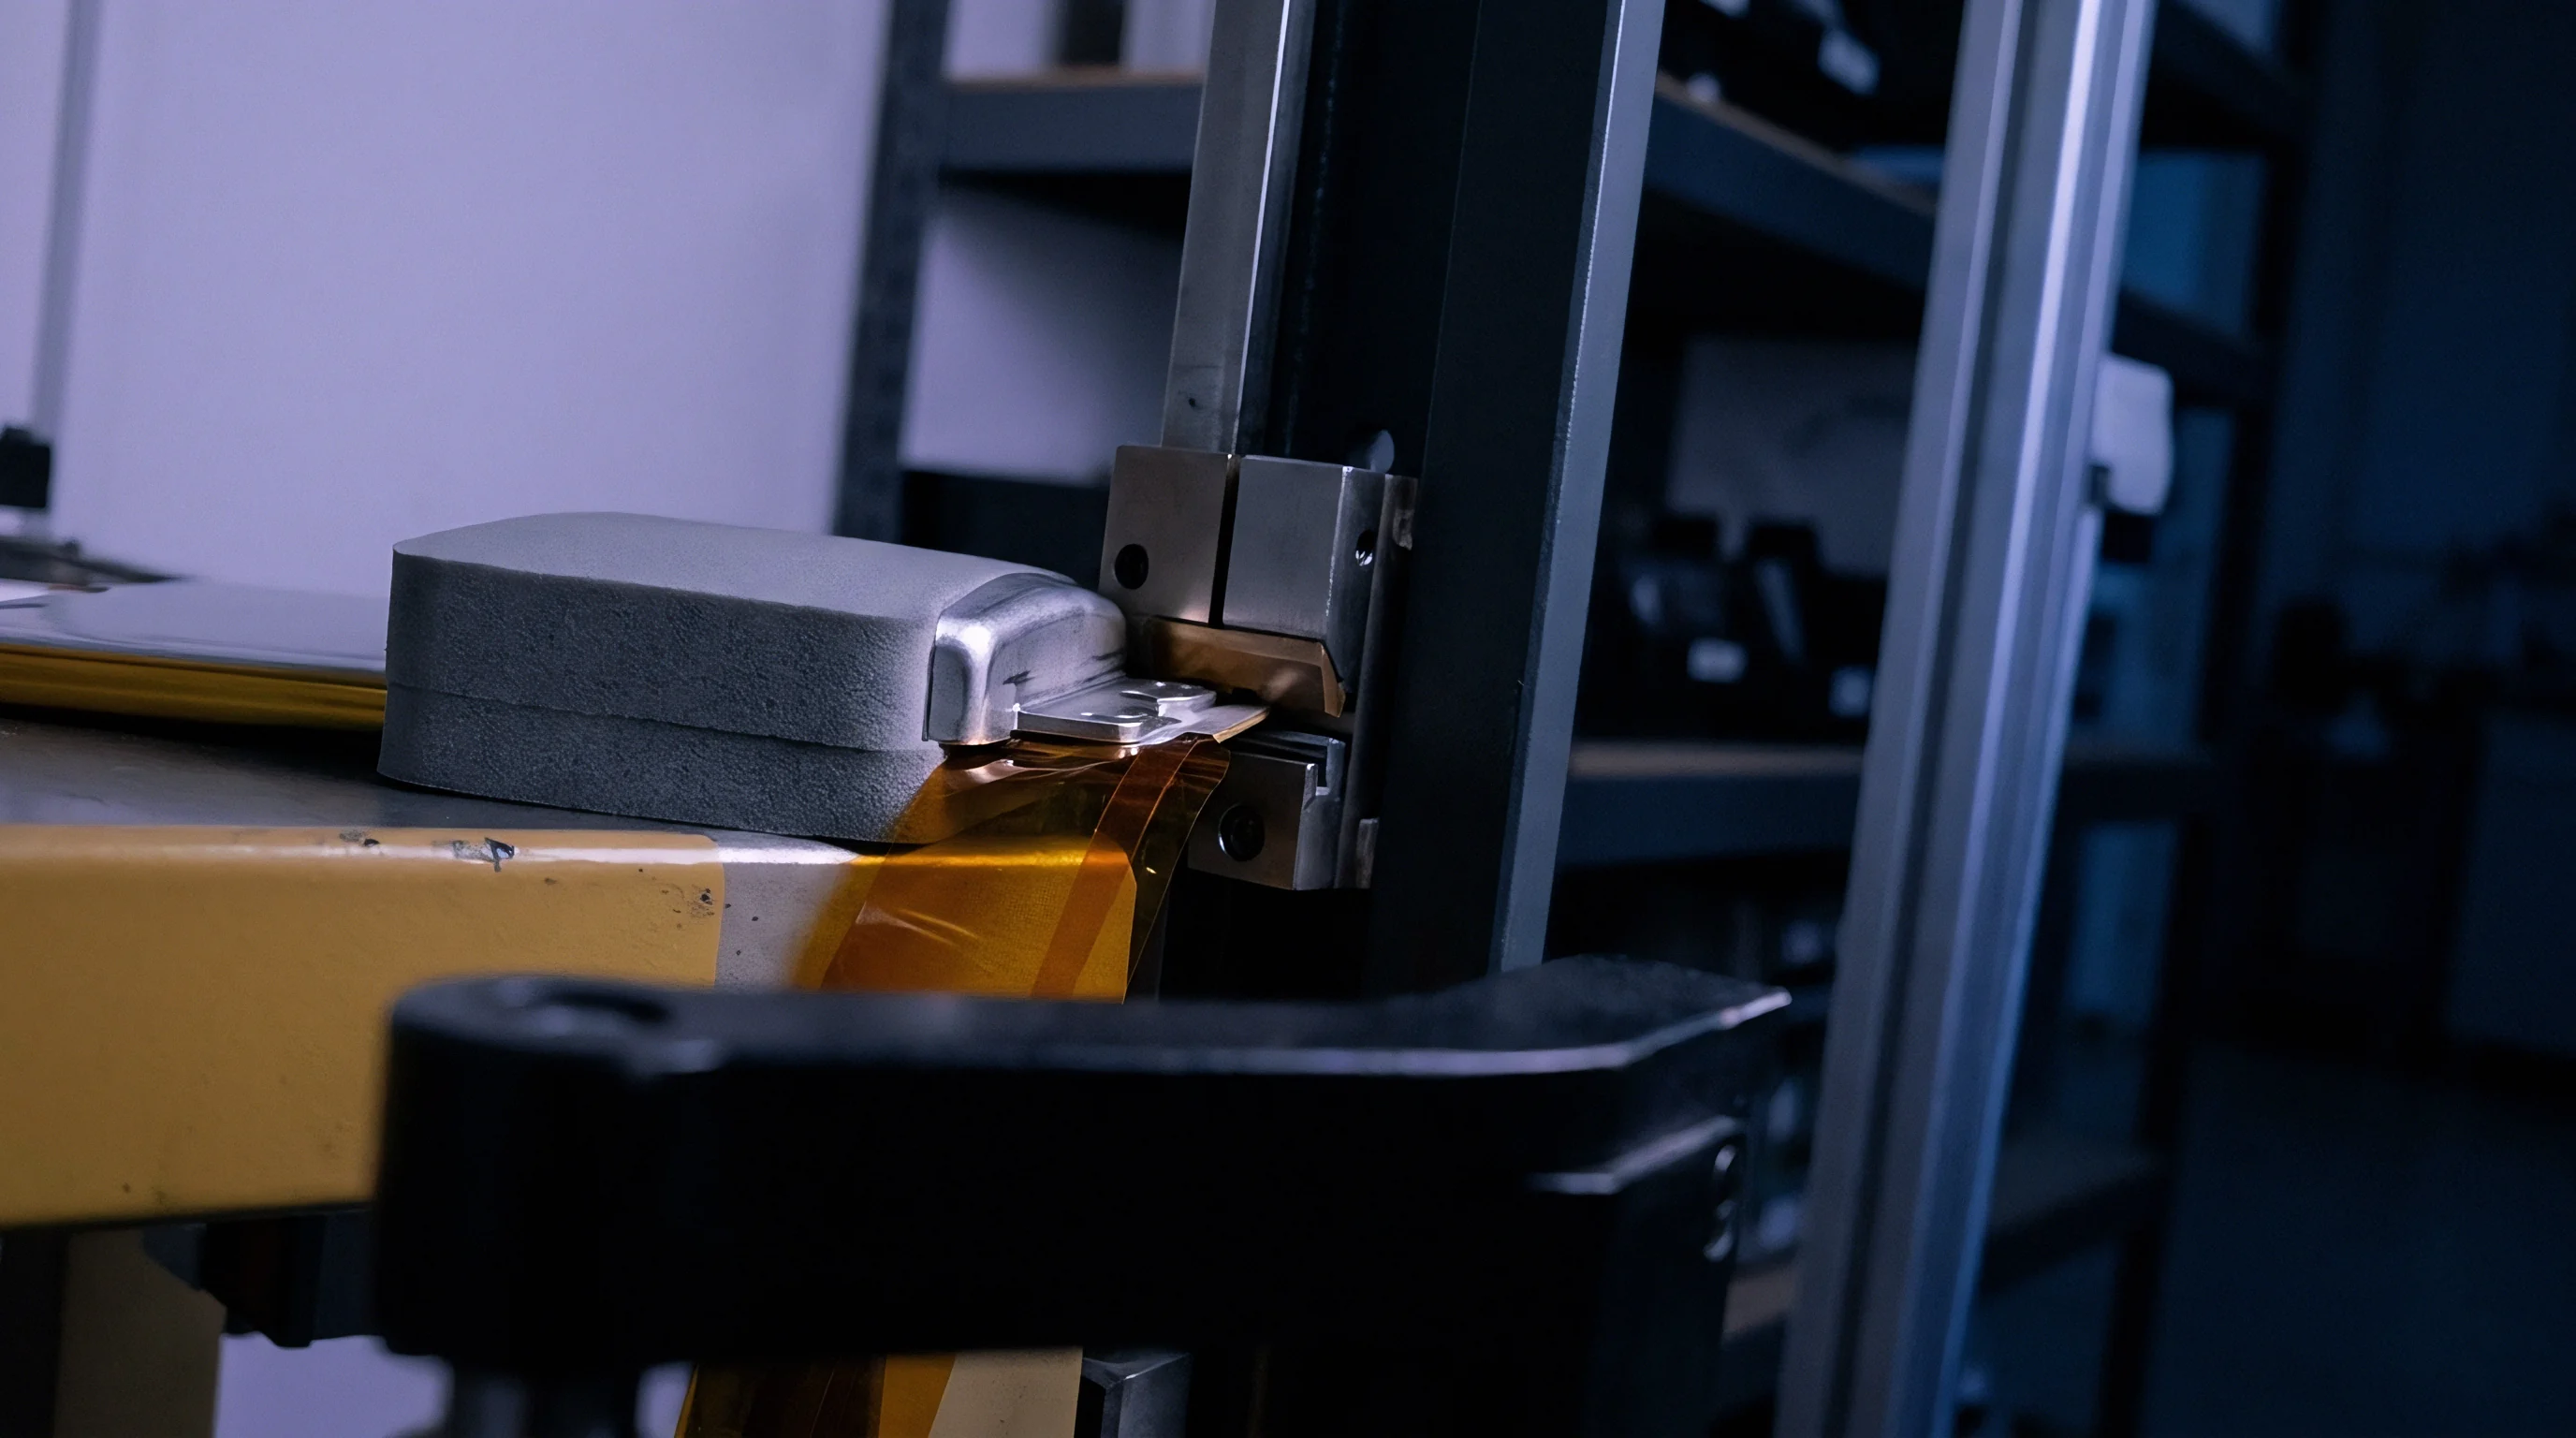
Persistent stack pressure crushes the delicate fibrillar nodes in wet polyethylene, flattening round pore channels into ellipses. That elliptical geometry raises hydrodynamic resistance to electrolyte movement and depresses the bulk diffusion coefficient of lithium ions.
Temperature accelerates microstructural compression kinetics dramatically: holding a cell at 45°C doubles the creep rate of wet polyethylene relative to storage at 20°C. Added thermal energy unlocks amorphous chain mobility, allowing stress relaxation at much lower compressive thresholds. Ceramic coatings ~ usually alumina or silica particles held by polyvinylidene fluoride or polyacrylic acid ~ stop planar macro-shrinkage across the cell face. They do not, however, protect against sub-micron pore collapse in the underlying polyolefin substrate.
In fact, compressive stress can drive ceramic particles right into the soft polyolefin face, plugging pores directly under individual grains.
Ongoing solvent breakdown gradually alters the cell’s internal chemistry.
Tortuosity measurements on harvested separators after eighteen months at 45°C under 0.8 MPa of pressure, analyzed via micro-computed tomography and mercury intrusion porosimetry, showed a 28 percent drop in total pore volume, with mean pore diameter shifting from 45 nanometers down to 18 nanometers. The pore size distribution skewed heavily toward micropores below 10 nanometers. At that scale, pores undergo partial electrical double-layer overlap, which severely restricts lithium-ion transport and alters the effective transference number inside the matrix.
Separator porosity drops by an average of 1.4 percent per hundred days when stored at 40°C under an initial stack pressure of 0.6 MPa.
Over two years, sustained mechanical stress thins the separator by 10 to 25 percent. A thinner separator tightens electrode spacing, which slightly boosts volumetric energy density, but it weakens protection against internal micro-shorts. As the separator compresses, it squeezes electrolyte out of the pore network toward the cell margins and pouch edges.
This electrolyte squeeze-out starves active electrode pores of liquid. Dry spots develop near the center of the electrode stack, causing swift capacity loss and localized lithium plating once the cell is put back into cycling service.
Capillary Flow Porometry and Transport Parameter Shifts
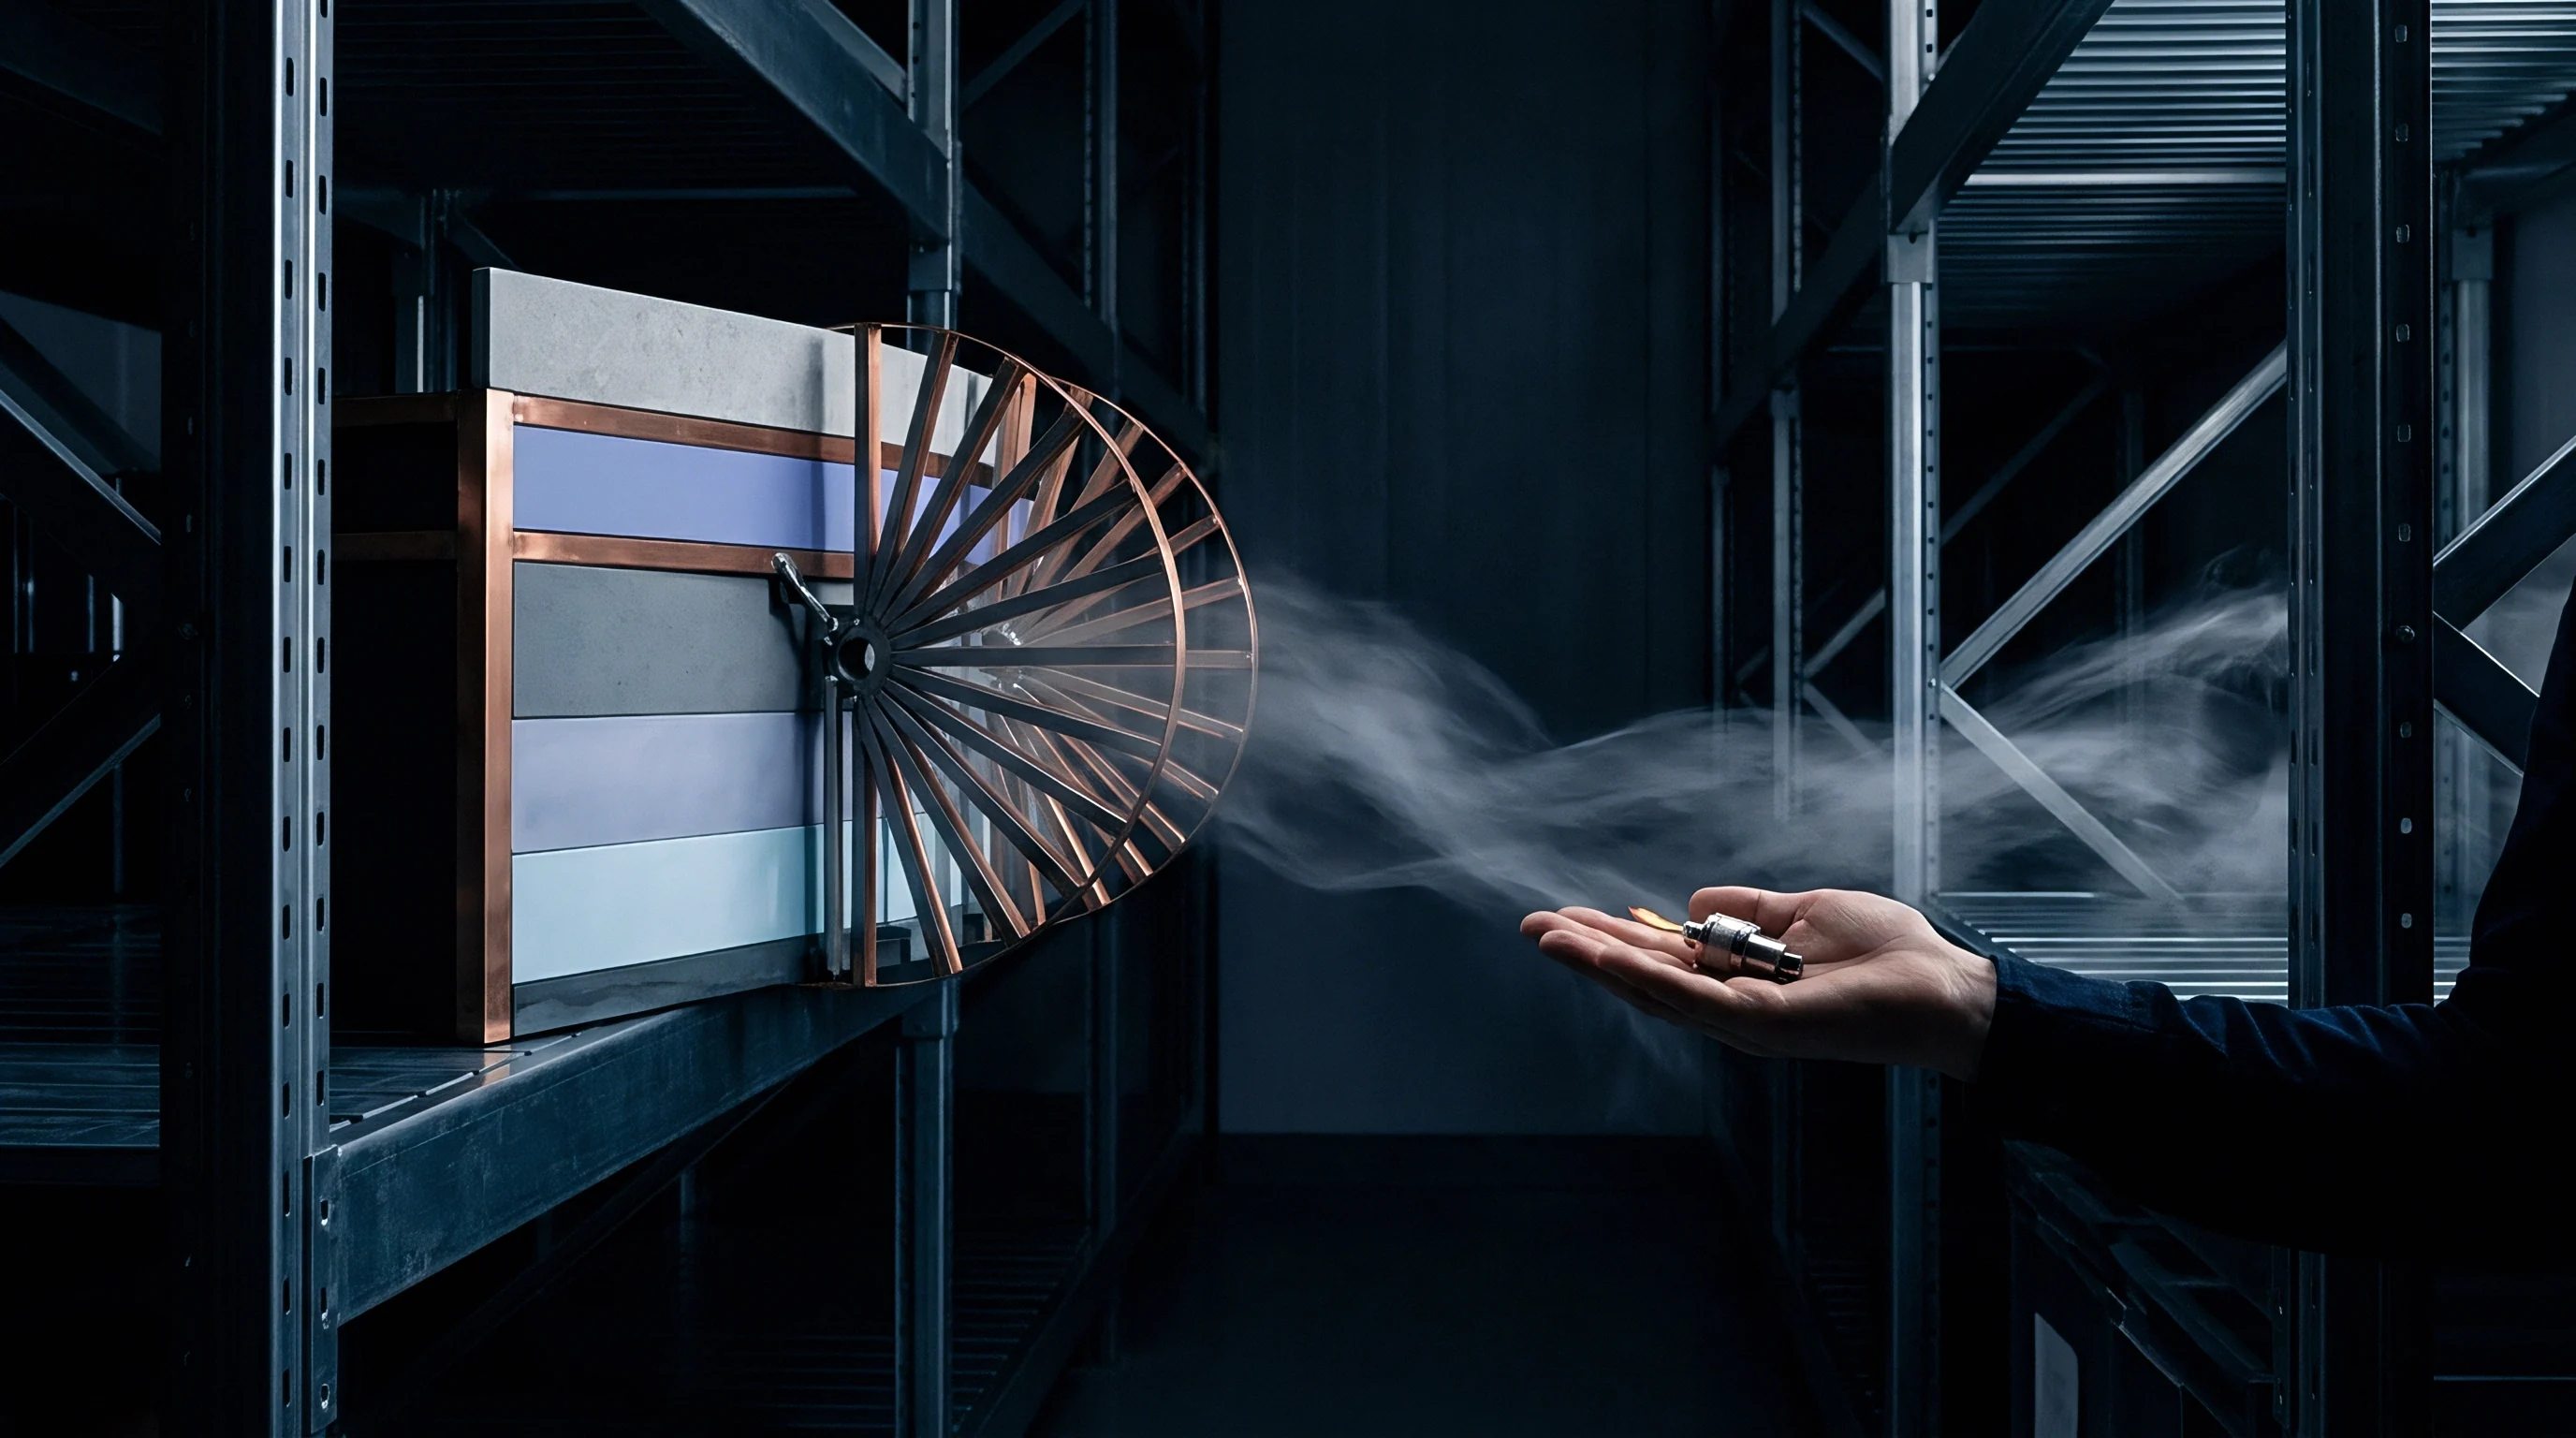
Quantifying microstructural pore collapse requires post-mortem analytical methods that can separate mechanical deformation from chemical fouling. Capillary flow porometry measures bubble point pressure and pore size distributions by using pressurized inert gas to force a wetting liquid out of the matrix. Fresh wet-process separators show a tight pore distribution centered around 40 to 50 nanometers.
By contrast, separators harvested after twenty-four months of storage display broad, bimodal distributions, where primary peaks drop below 20 nanometers and secondary peaks reflect fully closed pores.
Mercury intrusion porosimetry yields total pore volume and bulk density across broad pressure ranges, but high pressures needed to measure pores under 50 nanometers can crush soft polyolefin samples and produce measurement artifacts. Combining capillary flow porometry with cryogenic cross-sectional scanning electron microscopy offers better fidelity for checking collapsed pore structures. Micrographs show elongated polymer fibrils squeezed tightly into dense polymeric bands, cutting off ion pathways between anode and cathode.
Pore closure progressively restricts free ion motion within the cell.
Electrolyte permeability testing measures how strongly harvested separators resist fluid flow. Applying Darcy’s law converts flow rates under set differential pressures into absolute permeability values. Hydraulic permeability drops exponentially as porosity falls: a 20 percent loss in total bulk porosity often causes an 80 percent collapse in permeability.
That drop prevents electrolyte from re-wetting dry areas during thermal cycling or mechanical relaxation, leaving local zones permanently deprived of mobile lithium ions.
| Separator Substrate Type | Storage Regime (SOC / Temp) | Storage Duration | Initial vs Final Porosity (%) | MacMullin Number Shift | Tortuosity Increase (%) |
|---|---|---|---|---|---|
| Wet PE (16 µm baseline) | 50% SOC / 25°C | 12 Months | 46.2 → 41.8 | 4.5 → 5.8 | +18.4% |
| Wet PE (16 µm baseline) | 50% SOC / 45°C | 24 Months | 46.2 → 33.1 | 4.5 → 11.2 | +67.2% |
| Dry PP (20 µm baseline) | 50% SOC / 45°C | 24 Months | 39.5 → 31.8 | 5.8 → 9.6 | +42.1% |
| Ceramic Coated PE (16+4 µm) | 100% SOC / 45°C | 36 Months | 44.8 → 29.4 | 4.8 → 14.3 | +85.6% |
| Ceramic Coated PE (16+4 µm) | 30% SOC / 15°C | 36 Months | 44.8 → 42.1 | 4.8 → 5.2 | +6.3% |
Modeling transport shifts requires updating effective ionic conductivity within electrochemical continuum models. Effective ionic conductivity is defined as bulk electrolyte conductivity multiplied by separator porosity and divided by tortuosity. If storage drops porosity from 45 percent to 30 percent while tortuosity rises from 1.5 to 2.8, effective ionic conductivity falls by more than 65 percent.
That drop raises high-frequency ohmic resistance and accentuates concentration polarization during high-rate discharge.
Electrochemical Impedance Growth and Lithium Plating Risk
Electrochemical impedance spectroscopy tracks the functional degradation from pore collapse non-destructively. High-frequency intercepts on Nyquist plots reflect bulk electrolyte and separator resistance; as pores close, this intercept moves rightward on the real impedance axis. Mid-frequency semicircles grow wider from combined SEI growth and hindered charge-transfer kinetics at the electrodes.
Meanwhile, Warburg impedance tails ~ tracking solid- and liquid-phase lithium diffusion ~ steepen and slide toward lower frequencies as squeezed channels obstruct ion movement.
Degraded separator matrices directly drive up overall cell impedance.
Impedance growth scales non-linearly with storage state of charge and temperature. Holding cells at 100 percent state of charge accelerates transition metal dissolution from nickel-rich cathodes. Dissolved manganese, cobalt, and nickel ions travel across the separator toward the graphite anode, precipitating inside open pores and reacting with electrolyte to form insoluble metal fluorides and carbonates.
These inorganic deposits block remaining channels, combining chemical clogging with mechanical closure.
Pore closure sharply increases localized current density during initial recharge after storage. As pathways shut down, ionic current funnels through the few remaining uncompressed channels, where local current density can reach five to ten times the nominal average. When that local current exceeds the diffusion-limited rate of lithium intercalation into graphite, metallic lithium plates onto the anode surface.
This plated lithium forms dendrites that can penetrate adjacent separator pores, creating self-discharge paths and micro-shorts.
Failure modes inside long-term stored pouch cells originate from coupled mechanical and electrochemical breakdown channels.
- Mechanical Creep Pore Closure Compression from pouch vacuum and stack pressure flattens polyolefin fibrils over extended storage.
- Solvent-Plasticized Fibril Relaxation Absorbed carbonate solvents lower polymer glass transition temperatures, accelerating room-temperature pore collapse.
- Inorganic Salt Pore Clogging Migrated transition metal ions precipitate as insoluble fluorides within narrow separator micro-channels.
- Electrolyte Squeeze Out Defect Sustained normal stress forces liquid electrolyte into pouch margins, starving central electrode regions.
- Dendritic Plating Inception Non-uniform current distribution across collapsed pore regions triggers localized metallic lithium deposition during fast charging.
Evaluating separator structural integrity requires calculating local ionic current distribution across the planar surface. Capillary pore network models help predict local overpotentials. When mean pore diameter drops below 20 nanometers, effective lithium transference numbers plunge from baseline levels around 0.38 to under 0.15.
That drop creates steep concentration gradients across the separator during operation, driving premature low-voltage cutoffs during discharge and boosting heat generation inside the cell.
Pouch cell stack pressure must be monitored continuously during extended storage programs to limit long-term separator pore closure.
Gas
Electrolyte decomposition during long storage generates volatile gases that expand aluminum laminate pouches and shift internal pressure profiles. Gassing occurs through thermochemical and electrochemical reduction at the anode alongside oxidative decomposition at the cathode. Even sitting idle, a cell maintains a thermodynamic potential difference between its electrodes.
That potential difference drives continuous parasitic reactions among carbonate solvents, dissolved salts, active materials, and trace moisture. Lacking the rigid casing of cylindrical or prismatic cans, pouch cells expand readily under internal gas pressure.
Anode-side gassing comes primarily from ongoing restructuring of the solid electrolyte interphase (SEI). Standard SEI films contain ethylene carbonate reduction products ~ like lithium ethylene dicarbonate ~ alongside lithium fluoride and lithium carbonate. During extended storage, especially above 35°C, organic interphase components undergo thermal breakdown and transesterification.
These reactions release gaseous olefins like ethylene and propylene, as well as carbon dioxide. At the same time, trace water inside the cell reacts with lithium hexafluorophosphate salt to yield hydrofluoric acid and carbon dioxide gas.
Hydrofluoric acid attacks both active materials and the inner seal layers of the pouch. Fluoride species leach transition metal cations from cathode lattices, damaging particle surfaces and freeing lattice oxygen. This oxygen reacts with alkyl carbonate solvents to form carbon monoxide, carbon dioxide, and water vapor.
That water vapor then reacts with more salt, establishing a self-sustaining feedback loop. As gas accumulates, it inflates the pouch, pulling electrode layers out of physical contact and compounding transport bottlenecks created by pore collapse.
Gas accumulation progressively increases stress on the internal stack assembly.
What Triggers Accelerated Gas Evolution during Extended Storage?
A high storage state of charge speeds up gassing significantly. Holding nickel-rich cathodes like NCM811 or NCA above an 80 percent state of charge pushes surface potential beyond 4.2 V versus Li/Li+, triggering direct solvent oxidation. Carbonate solvents transfer electrons to delithiated cathode particles, breaking cyclic and linear carbonates into gas fragments.
Ethylene carbonate breaks down into carbon dioxide and ethylene, while dimethyl carbonate and ethyl methyl carbonate yield dimethyl ether, methane, ethane, and carbon dioxide.
Storing cells at high states of charge accelerates structural and chemical decay.
Gas volume expansion tracked using automated Archimedes balances over thirty-six months of storage across different states of charge demonstrates strong SOC sensitivity. Pouch cells stored at 100 percent state of charge at 45°C showed a 42 percent volume increase after twelve months. Identical cells kept at 30 percent state of charge under the same thermal conditions expanded by less than 4 percent across thirty-six months.
A fully charged anode holds negative potential down near 0.08 V versus lithium, driving aggressive reduction of linear carbonate solvents into gaseous alkanes.
| Storage SOC | Storage Temperature | Volume Expansion (12 Mo) | Primary Gas Species (% Vol) | Secondary Gas Species (% Vol) | Residual Capacity Retained |
|---|---|---|---|---|---|
| 100% SOC | 60°C | +118.5% | CO2 (48%), C2H4 (24%) | H2 (14%), CO (9%), CH4 (5%) | 61.2% |
| 100% SOC | 45°C | +42.3% | CO2 (52%), C2H4 (21%) | H2 (12%), CO (8%), C2H6 (7%) | 78.4% |
| 50% SOC | 45°C | +12.8% | CO2 (61%), H2 (18%) | C2H4 (11%), CO (6%), CH4 (4%) | 89.1% |
| 50% SOC | 25°C | +3.1% | CO2 (68%), H2 (16%) | C2H4 (8%), CO (5%), C2H6 (3%) | 96.5% |
| 30% SOC | 15°C | +0.6% | CO2 (74%), H2 (15%) | C2H4 (5%), CO (4%), CH4 (2%) | 98.8% |
Moisture ingress through the packaging further accelerates hydrofluoric acid generation.
Atmospheric moisture leaking through heat-sealed edges is another major cause of long-term gassing. Aluminum laminate film uses a polyolefin inner sealing layer, a core aluminum foil barrier, and an outer polyamide protective skin. While moisture cannot cross the aluminum foil itself, water vapor diffuses slowly through the thin inner seal seam around the pouch perimeter.
Over multi-year storage at 60 percent relative humidity, water molecules seep through the sealing polymer and react instantly with lithium hexafluorophosphate to generate hydrofluoric acid and oxygen. The acid corrodes the inner aluminum layer, weakening seal adhesion and driving severe pouch swelling.
Mass Spectrometry and Volumetric Expansion Analysis
Accurately quantifying gas species requires careful analytical instrumentation. Destructive sampling involves piercing the pouch seal inside a vacuum-tight chamber tied directly to a gas chromatograph-mass spectrometer. The system separates and identifies volatile organics, permanent gases, and fluorinated breakdown products.
Using calibrated gas mixtures allows precise calculation of molar concentrations for hydrogen, carbon dioxide, carbon monoxide, methane, ethylene, and ethane.
Gas composition reveals distinct fingerprints for specific degradation pathways. High hydrogen levels indicate water ingress and active corrosion of the aluminum current collector. Strong signals of carbon dioxide and carbon monoxide point to oxidative solvent breakdown at high cathode potentials or thermal decay of SEI compounds.
Methane and ethylene mark direct reductive solvent breakdown on heavily lithiated graphite anodes. Reading these chemical signatures allows engineers to pinpoint whether swelling stems from initial cell defects or storage environment excursions.
Severely gassed cells inevitably fail incoming thickness checks.
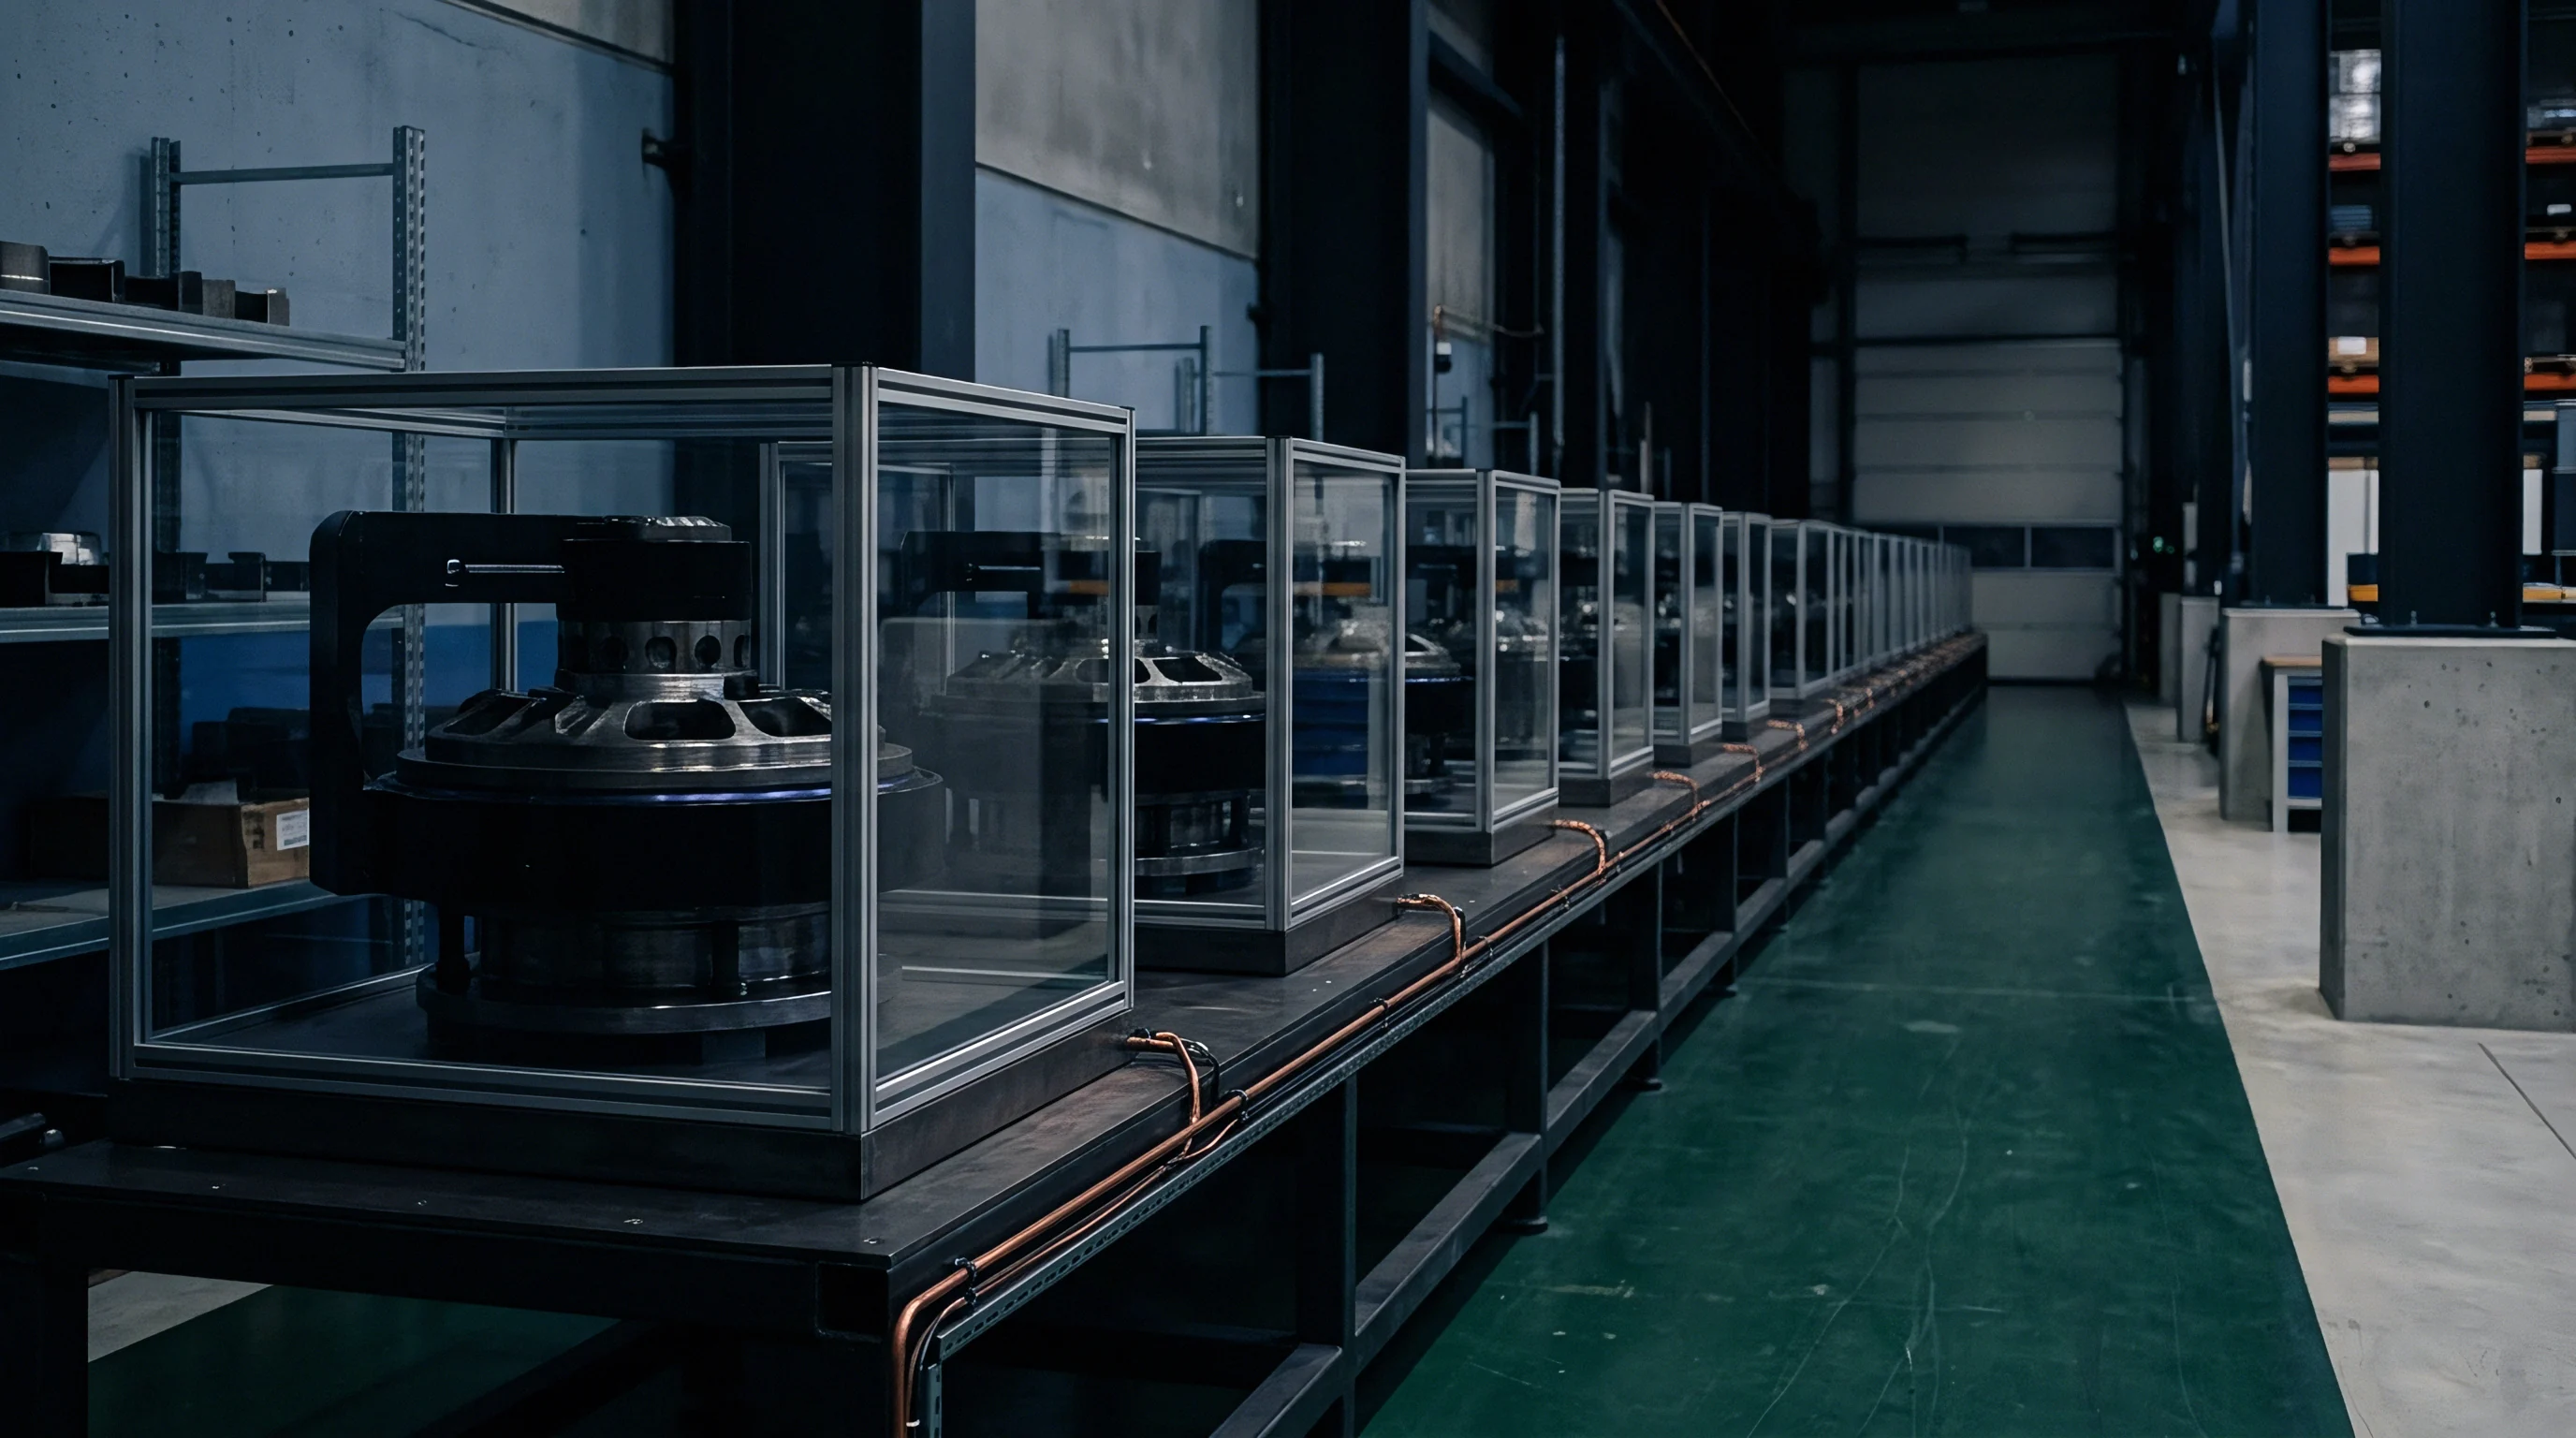
Non-destructive volume tracking relies on Archimedes buoyancy testing. Suspending a pouch cell in a high-density, inert fluorocarbon fluid allows exact measurement of buoyant force changes, tracking volume displacement down to 0.01 cubic centimeters. Automated rigs log expansion profiles over extended storage without breaking pouch seals or disturbing aging runs.
Combining Archimedes tracking with internal pressure transducers in rigid fixtures provides real-time data on internal gas buildup.
Internal gas generation exceeding 1.8 cubic centimeters per ampere-hour of nominal cell capacity triggers irreversible electrode layer delamination in unconstrained pouch architectures.
Acoustic inspection maps spatial gas distribution inside stored pouch cells. Ultrasonic transmission scanning sends high-frequency sound waves through the cell’s thickness. While liquid electrolyte and solid electrode layers conduct sound cleanly, gas pockets attenuate ultrasonic waves, producing clear attenuation maps across the cell face.
Unwetted, gas-filled regions show up as high-attenuation shadows, visualizing internal gas movement non-destructively.

Destructive Physical Inspection and Acoustic Tomography
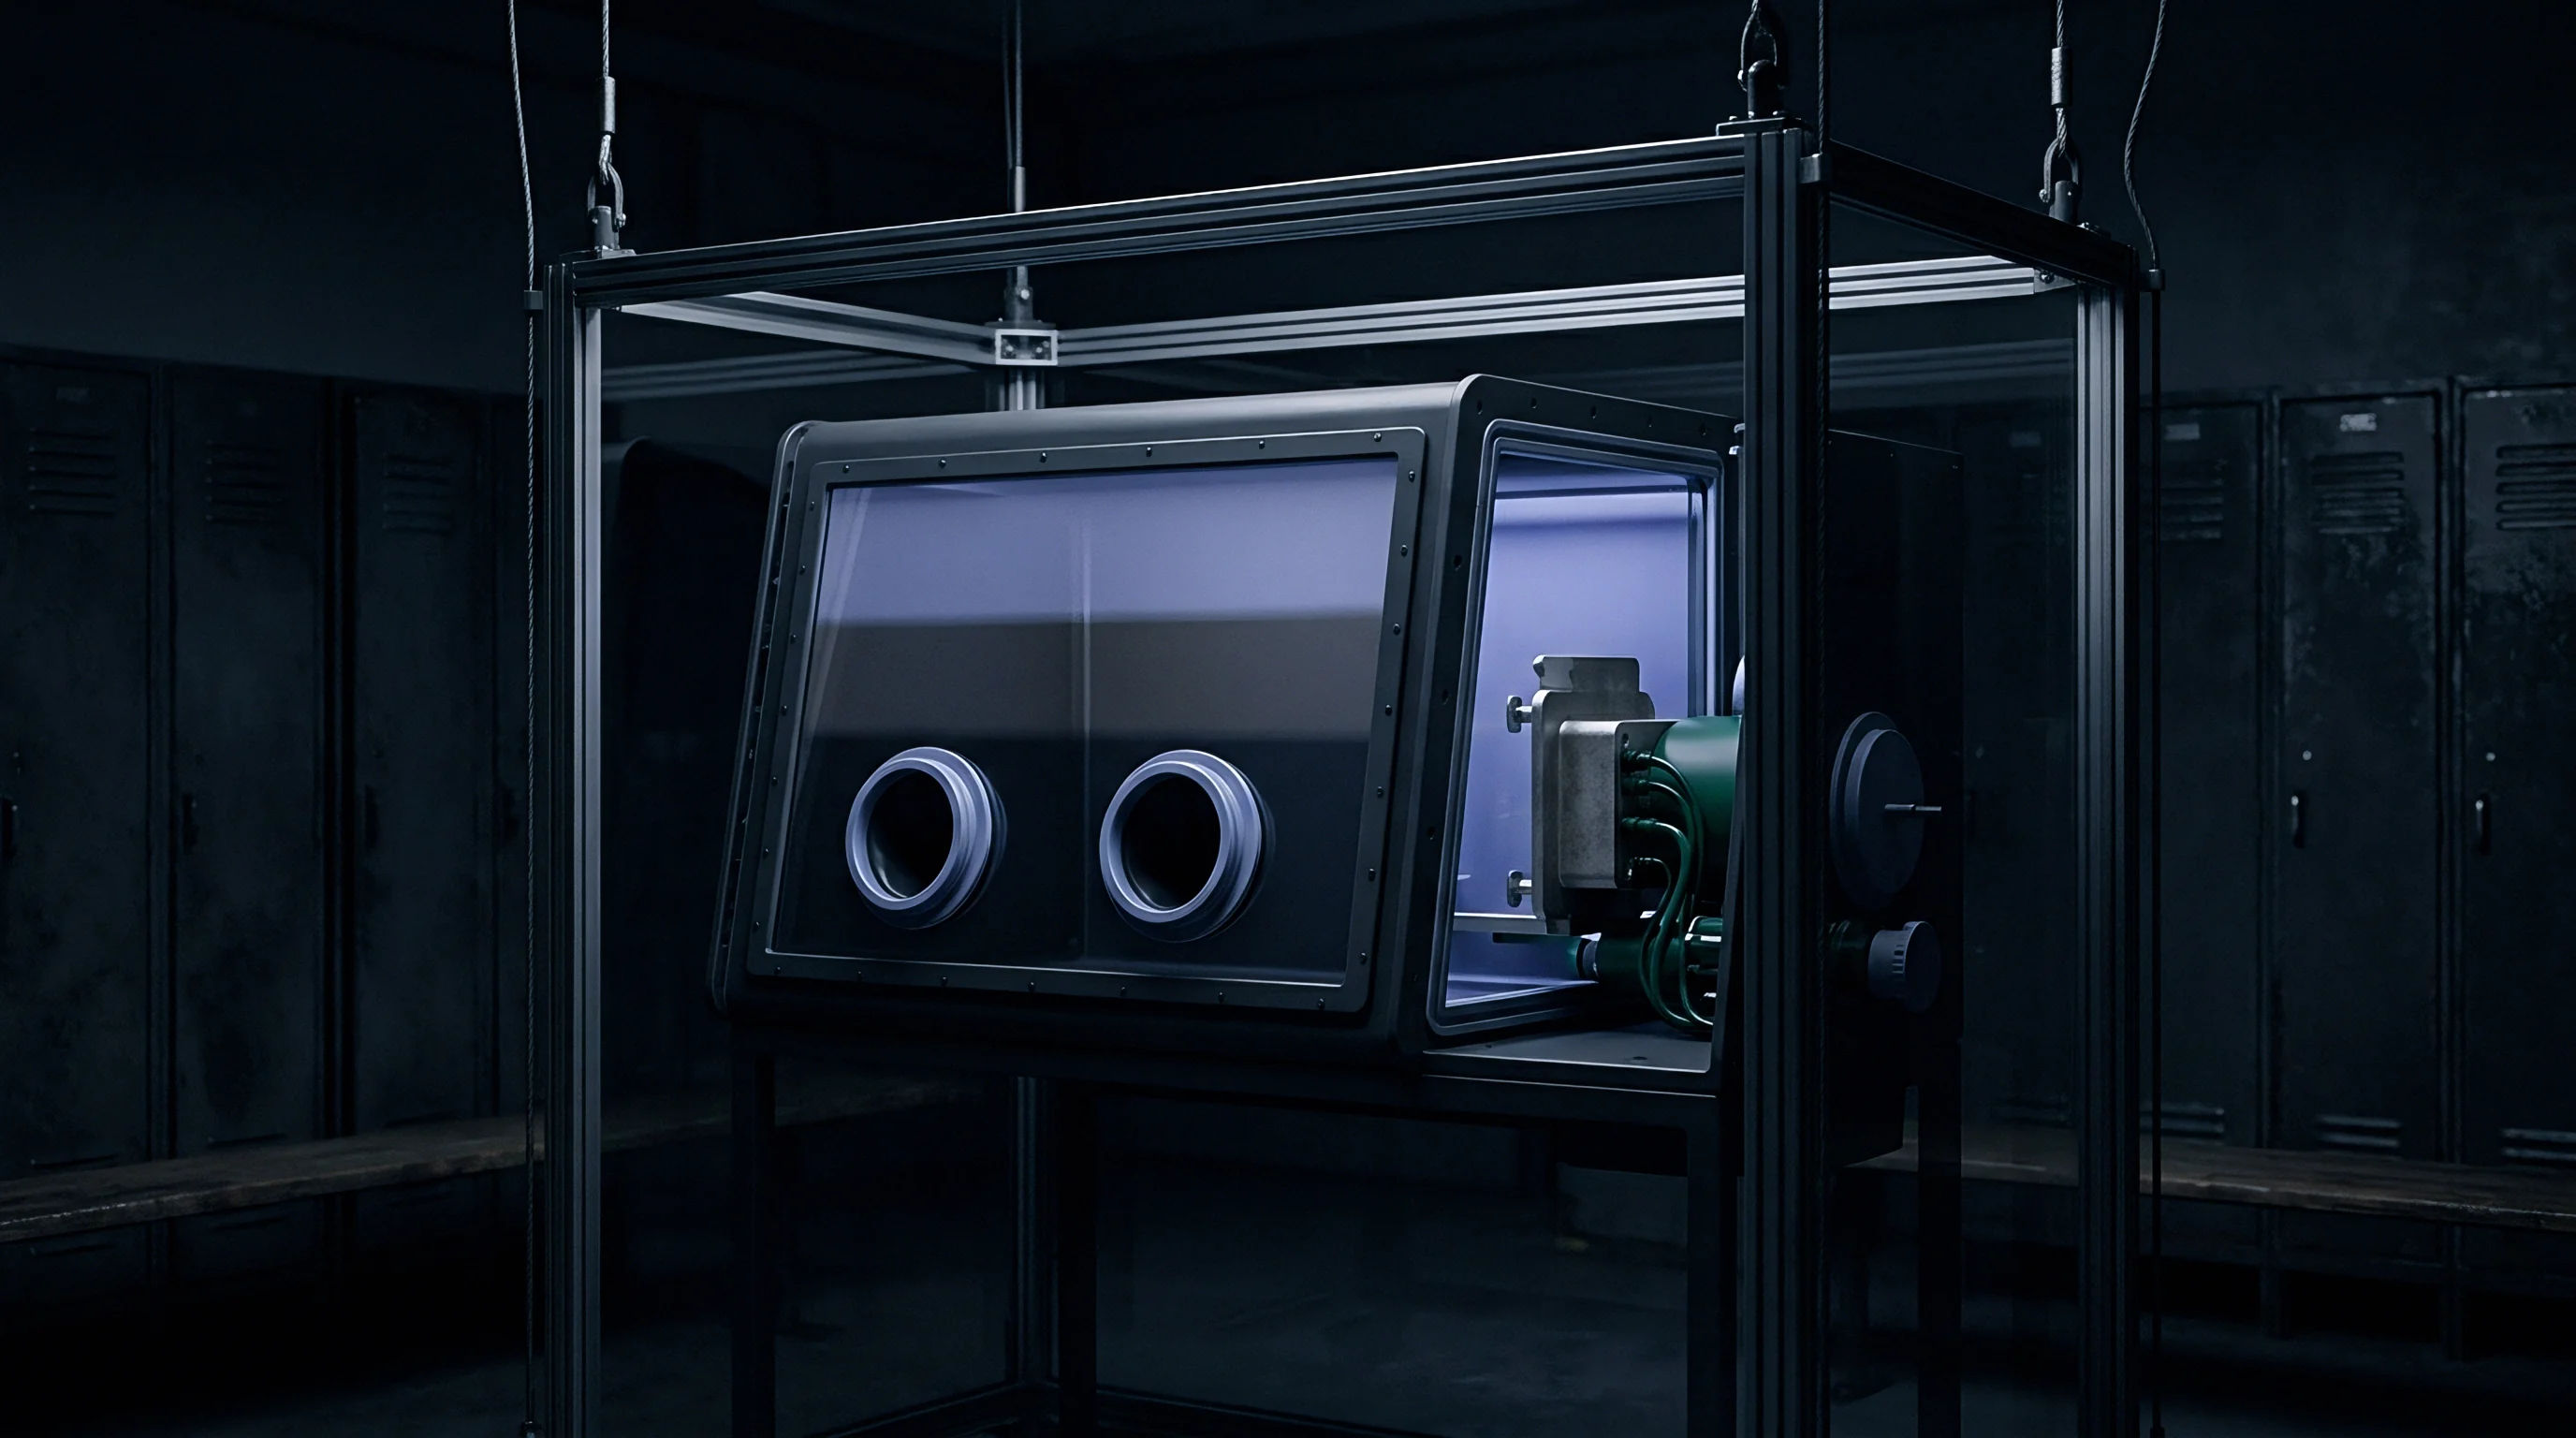
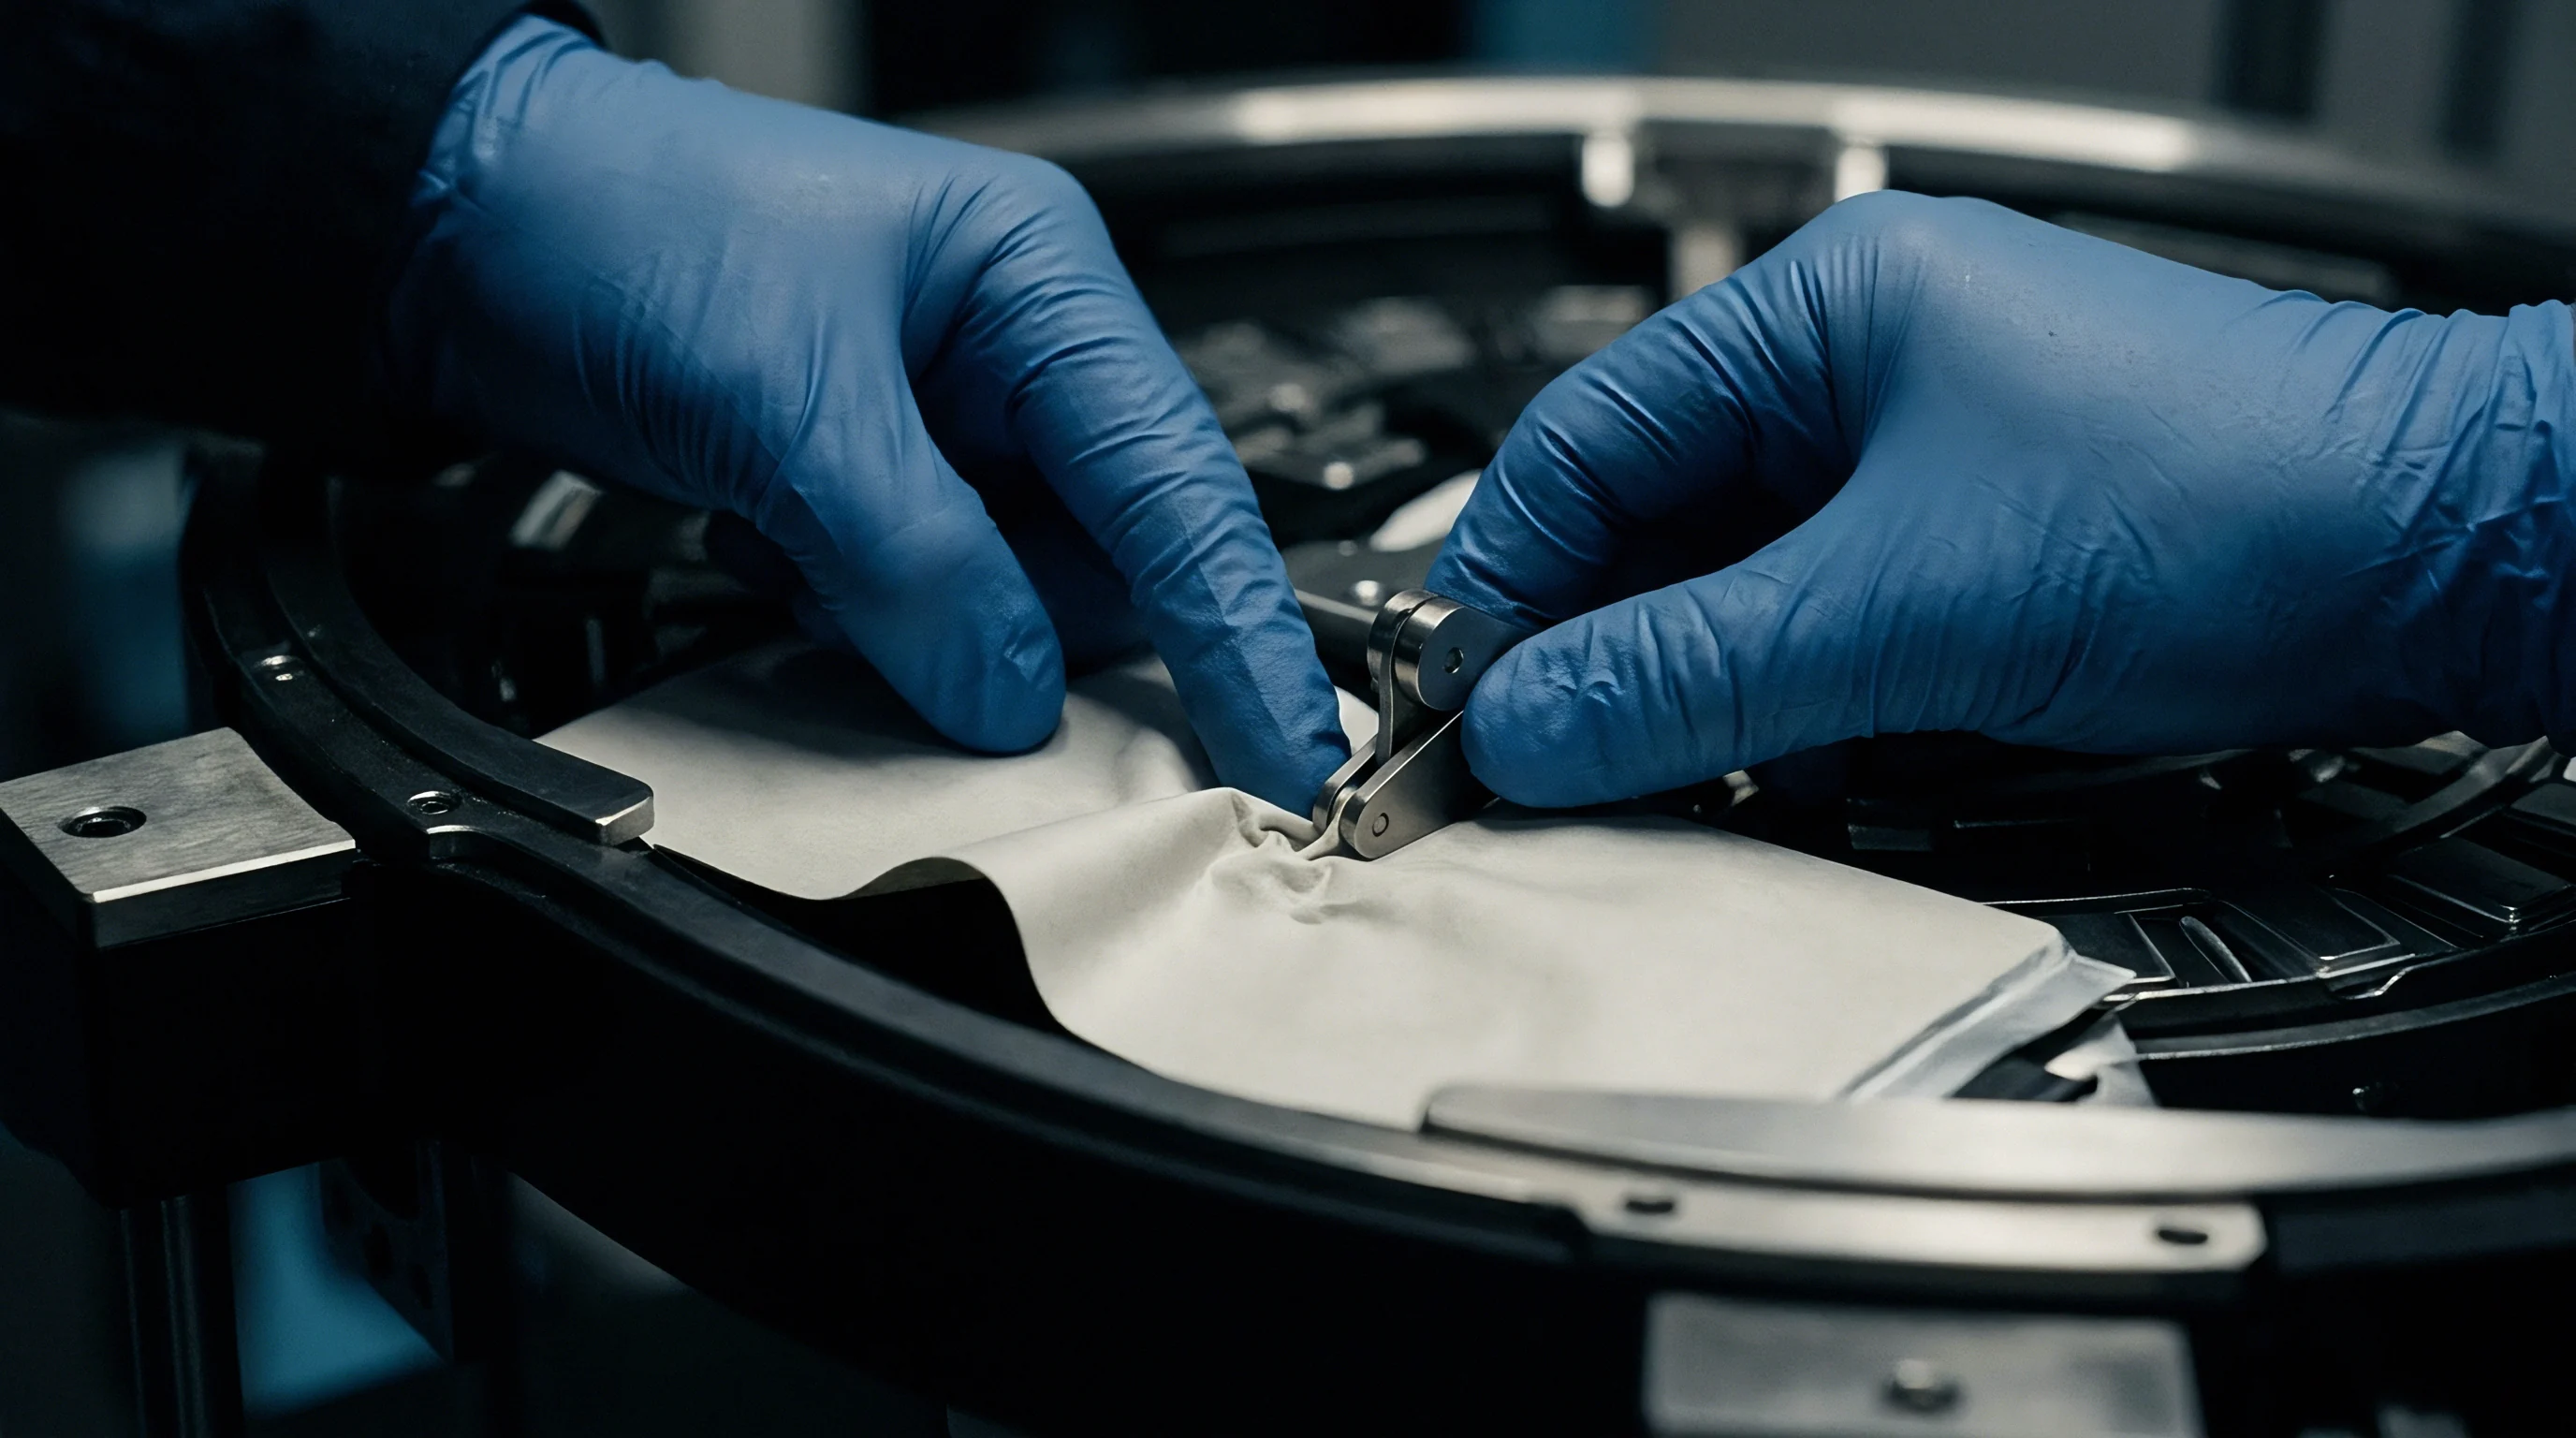
Destructive physical analysis of long-stored cells requires strict environmental control to preserve sensitive surface species. Teardowns take place inside an argon glovebox kept below 0.1 ppm moisture and oxygen, preventing atmospheric contamination of harvested electrodes and separators. Technicians photograph internal pouch structures, check seal seam integrity, measure free electrolyte volume, and extract electrode samples for surface testing.
A systematic destructive inspection sequence guarantees repeatable data collection across stored pouch shipments.
- Measure external pouch dimensions, total cell mass, and post-storage Archimedes volume displacement prior to opening packaging.
- Place the pouch cell inside the argon glovebox vacuum chamber and record initial internal gas pressure via calibrated needle puncture sampling.
- Extract gas volume directly into the gas chromatography mass spectrometer injection loop for immediate quantitative composition breakdown.
- Cut the heat-seal seams along three perimeters using non-sparking ceramic blades to prevent internal electrical shorting.
- Separate positive and negative electrode plates, harvesting separator layers for physical porometry and electrical impedance testing.
- Extract liquid electrolyte via micro-centrifugation of wet separator samples for Karl Fischer moisture titrations and ion chromatography.
- Wash harvested electrode samples with anhydrous dimethyl carbonate to remove residual lithium salts before vacuum drying.
- Analyze electrode surfaces using X-ray photoelectron spectroscopy and field-emission scanning electron microscopy to evaluate interphase layer thickness.
Scanning electron microscopy of harvested anodes from gassed cells shows thick, porous SEI layers. Where pristine anodes feature uniform interphases between 10 and 20 nanometers, storage at elevated temperatures and states of charge can expand interphase thickness beyond 150 nanometers. This growth consumes cyclable lithium, causing permanent capacity loss, while filling graphite surface pores to restrict intercalation pathways and raise charge-transfer resistance.
Pouch swelling shifts internal electrode layer alignment.
Gas build-up creates localized dry zones as bubbles force liquid electrolyte away from active faces. Deprived electrode regions stop carrying current, shifting the burden onto adjacent areas. That higher local current density accelerates localized cathode degradation and separator pore collapse, directly coupling chemical gassing with physical structural decay.
Once gas channels become established between electrode sheets, applying external clamping plates cannot fully restore original electrolyte wetting.
Cell procurement contracts must include explicit maximum allowable volumetric expansion limits evaluated after standardized storage aging periods under UN 38.3 transport safety regulations.

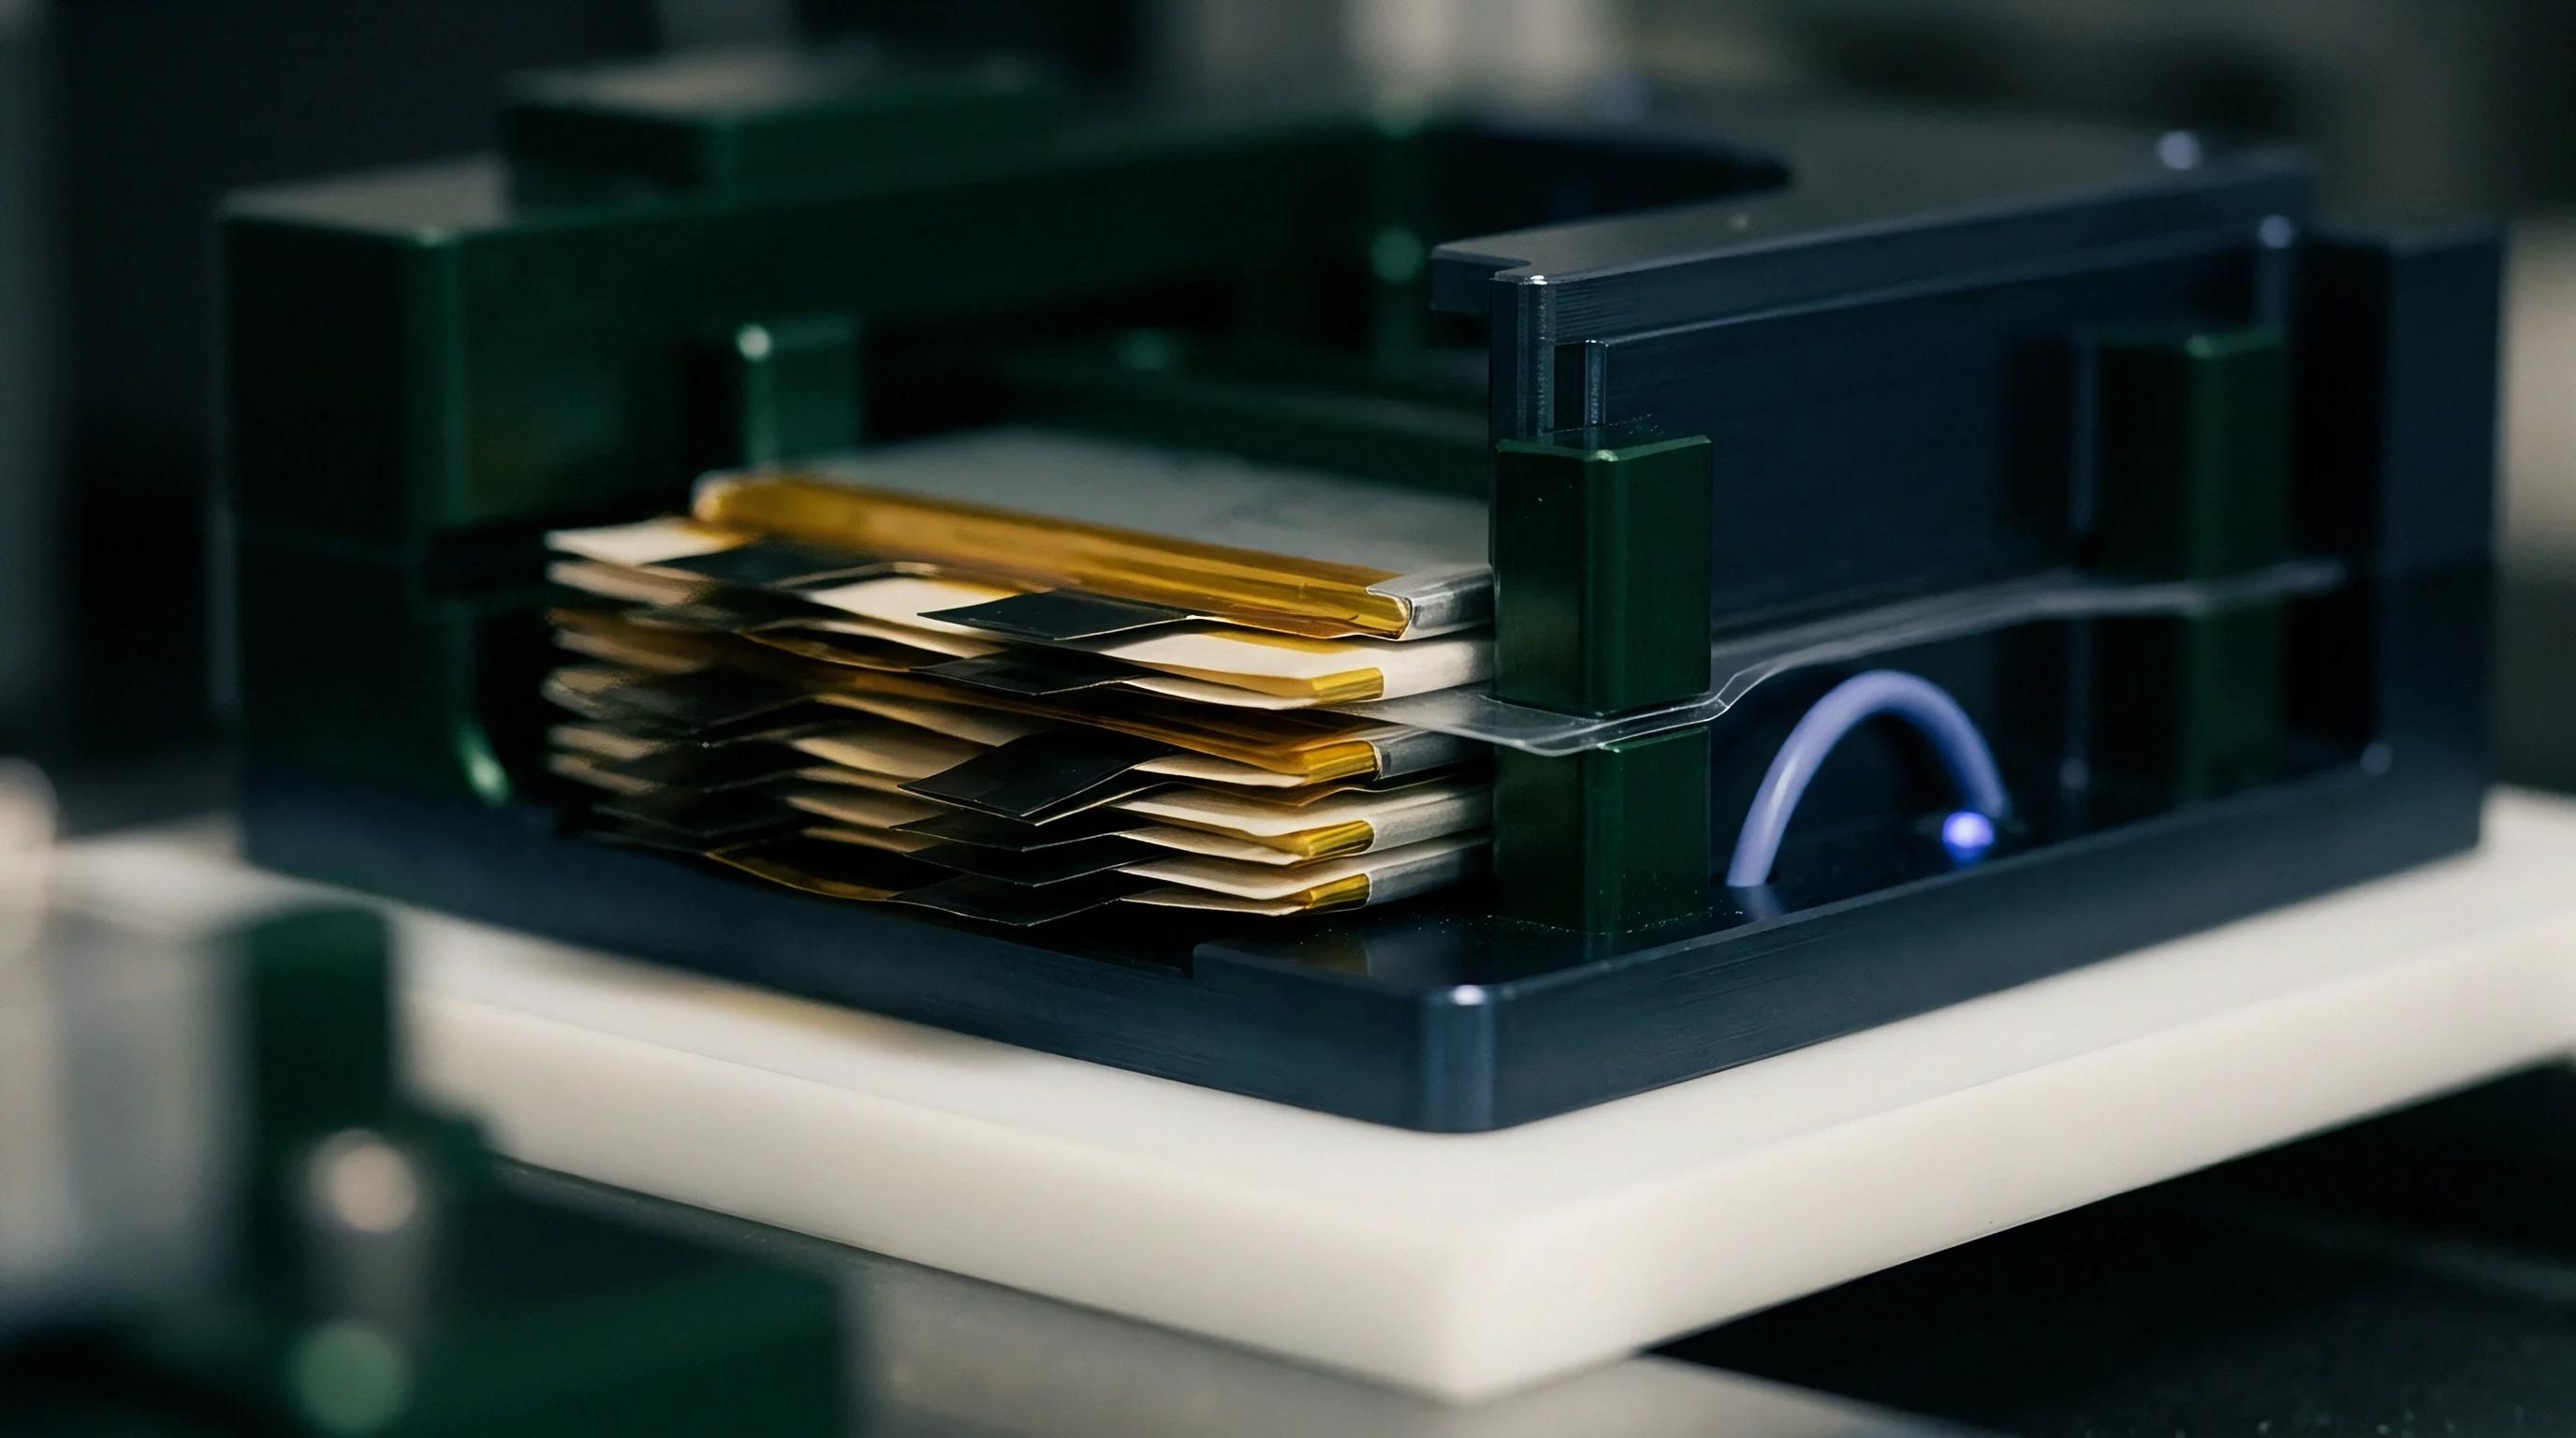
Ledger
Accounting for stored pouch cell inventory must factor in capacity loss, impedance growth, and scrap rates from swelling. Holding un-assembled cells or finished packs incurs carrying costs that scale directly with time. When cells sit in storage for eighteen to thirty-six months, degradation deviates sharply from linear calendar estimates.
Non-linear mechanisms like separator pore collapse and gas evolution alter residual value, introducing substantial financial exposure into multi-year delivery contracts.
Cell degradation translates directly into lost landed energy value. A pouch cell bought at a baseline price of $85 per kilowatt-hour loses value rapidly when storage cuts usable capacity by 12 percent and doubles internal resistance. Elevated resistance limits usable discharge energy under heavy loads, lowering effective energy delivery.
Over total cycle life, storage degradation inflates the effective cost per delivered kilowatt-hour by 20 to 35 percent ~ eroding expected economics before cells ever enter field service.
Scrap rates escalate rapidly without continuous thermal control.
Uncontrolled ambient warehouse storage over twenty-four months can inflict heavy losses. Initial voltage checks on twelve thousand pouch units stored without temperature controls showed normal levels across all lots. Subsequent tear-down testing, however, revealed severe separator pore closure and heavy gas accumulation that forced the rejection of 38 percent of the inventory.
Scrap write-offs, re-inspection labor, and spot-market replacement buys drove effective landed cell costs from $82 up to $129 per kilowatt-hour ~ a loss that underscores the need for strict real-time storage monitoring.
Storage State of Charge and Temperature Economic Tradeoffs
Managing inventory costs involves balancing storage temperature against state of charge. Cold storage at 15°C carries a higher square-meter rate than basic ambient warehousing. However, dropping storage temperature from 35°C to 15°C cuts separator creep rates threefold and reduces gas generation by over 80 percent.
The cost of climate control is minor compared to the capital wiped out by batch scrap events in unconditioned space.
State of charge presents a similar economic balance. UN 38.3 transport rules mandate shipping lithium cells at or below 30 percent state of charge. Holding inventory at 30 percent SOC during extended storage minimizes cathode oxidation and curbs gassing.
But low-charge storage increases vulnerability to self-discharge damage. If self-discharge drags cell voltage below 2.0 V, copper anode current collectors dissolve into the electrolyte. On subsequent charging, that dissolved copper forms metallic dendrites, creating internal shorts that render the cell a total loss.
| Storage Thermal Regime | Storage SOC Level | Warehousing Cost ($/kWh/Yr) | Retained Capacity (%) | Expected Scrap Rate (%) | Effective Landed Cost ($/kWh) |
|---|---|---|---|---|---|
| Uncontrolled (25°C – 42°C) | 50% SOC | $1.80 | 83.2% | 18.5% | $114.20 |
| Controlled Ambient (20°C – 25°C) | 50% SOC | $3.50 | 91.5% | 4.2% | $98.60 |
| Refrigerated (12°C – 15°C) | 30% SOC | $8.20 | 97.1% | 0.5% | $94.80 |
| Refrigerated (12°C – 15°C) | 100% SOC | $8.20 | 88.4% | 12.1% | $108.40 |
| Freezing (-5°C – 0°C) | 30% SOC | $14.50 | 96.8% | 6.8% | $107.10 |
Capacity loss scales directly with elevated storage temperature.
Freezing temperatures below 0°C introduce different physical risks. Solvent blends undergo phase transitions and localized crystallization at sub-zero temperatures, while salt precipitation inside tight separator pores creates mechanical stress that cracks polymer pore walls. Dropping storage temperatures below the crystallization point of the solvent blend accelerates microstructural damage without providing further chemical stability.
Storage guidelines must balance thermal slowing of chemical degradation against mechanical damage from phase changes.
Warehouse storage contracts for pouch cell inventory must stipulate continuous ambient temperature bounds between 12°C and 18°C with relative humidity controlled below 50 percent.
Scrap allowances in supply contracts need to reflect expected degradation over time. Standard purchase agreements assume a 1 to 2 percent incoming defect rate. If storage extends past twelve months, allowable defect rates should scale using validated degradation models.
Failing to adjust acceptance thresholds risks costly disputes between integrators and cell manufacturers over who bears liability for storage-driven capacity loss and gassing.

Warranty Risk Quantification and Scrap Allowance Calculations
Warranty clauses in energy storage contracts tie integrators to long-term performance metrics. Guaranteeing a ten-year, 4,000-cycle lifespan creates heavy liability if stored cells enter module assembly with hidden separator compression or gas contamination. Cells kept for two years under unmonitored conditions can lose up to 15 percent of their total cycle-life allowance before commissioning.
Financial reserve models must factor in storage history to price field risks accurately.
Quantifying capacity loss relies on modified Arrhenius kinetic equations that incorporate mechanical stress multipliers. Baseline activation energy for calendar aging typically falls between 0.4 and 0.6 electron volts. But when pore collapse constricts liquid diffusion, effective activation energy shifts, accelerating late-stage performance drop-off.
Models relying solely on fresh-cell calendar aging data consistently underestimate failure rates for aged inventory.
Testing long-stored lots frequently forces buyers to modify baseline procurement terms.
Field returns of swollen pouch cells trigger serious transport compliance issues. Class 9 dangerous goods rules strictly prohibit shipping damaged, defective, or swollen lithium batteries through standard air or sea freight. Transporting gassed cells requires certified, explosion-proof overpack containers fitted with thermal insulation and gas filtration media.
Shipping a swollen cell for forensic analysis can cost over five times its original purchase price, turning warranty teardown into a heavy expense.
Procurement contracts specifying pouch cell delivery must mandate batch-level capillary flow porometry records and gas chromatography verification prior to transfer of title.
Predicting batch failure points relies on two-parameter Weibull distributions. As storage time grows, characteristic lifetime parameters shift downward and shape parameters steepen, marking a transition from early random failures to systematic wear-out. Storage-induced pore closure and gassing push cells into early wear-out regimes, skewing failure distributions and requiring larger warranty reserves for field replacements.
Supply Chain Dossier Requirements and Acceptance Standards
Protecting capital during cell procurement requires strict technical dossiers and incoming inspection protocols. A proper dossier defines storage standards, baseline physical properties, and sampling procedures for destructive testing. Procurement rules should require suppliers to provide certified batch data on separator properties, initial electrolyte moisture, and formation degassing volumes before final payment release.
A complete cell qualification dossier must contain rigorous technical specifications to prevent the receipt of degraded storage inventory.
- Baseline Separator Microstructure Dossier Certified capillary flow porometry curves detailing baseline mean pore size, bubble point pressure, and Gurley porosity numbers.
- Electrolyte Trace Water Documentation Karl Fischer titration certificates confirming initial electrolyte moisture levels below 20 parts per million prior to final pouch sealing.
- Formation Degassing Volume Logs Recorded gas volume extracted during initial formation degassing steps, establishing baseline gassing profiles per cell batch.
- Storage History Environmental Records Continuous temperature and relative humidity tracking logs covering the entire time period between cell manufacture and customer delivery.
- Buoyancy Volume Expansion Thresholds Maximum allowable post-storage Archimedes volume expansion limits not exceeding 2.0 percent over baseline certified values.
- Impedance Intercept Limit Specifications Upper bounds for high-frequency real impedance growth verified via electrochemical impedance spectroscopy at 1 kHz.
Incoming inspection should pair non-destructive screening with statistical destructive testing. Technicians measure dimensions, thickness, weight, open-circuit voltage, and 1 kHz AC internal resistance across 100 percent of incoming cells. Any pouch showing thickness expansion over 5 percent beyond nominal drawings must be quarantined immediately.
Sampling for Archimedes volume testing, GC-MS gas analysis, and separator porometry follows ISO 2859-1 single sampling plans.
Acceptance standards require sharp pass/fail thresholds for mechanical and chemical metrics. If harvested separators show porosity loss exceeding 15 percent or a MacMullin number increase greater than 30 percent, the entire lot is held for engineering review. Likewise, hydrogen levels above 10 percent on gas chromatography indicate internal moisture contamination, warranting batch rejection at supplier expense.
Enforcing these limits keeps compromised cells off assembly lines.
In one instance, stored pouch expansion breaching module enclosure tolerances during final assembly produced a $140,000 loss on a single inventory batch.