Battery Module Housing Mechanical Tolerances and Stack Calculations
Calculated worst-case and RSS mechanical stack tolerances govern inter-cell compression, housing deflection, bolt torque retention, and production assembly yield
Frame
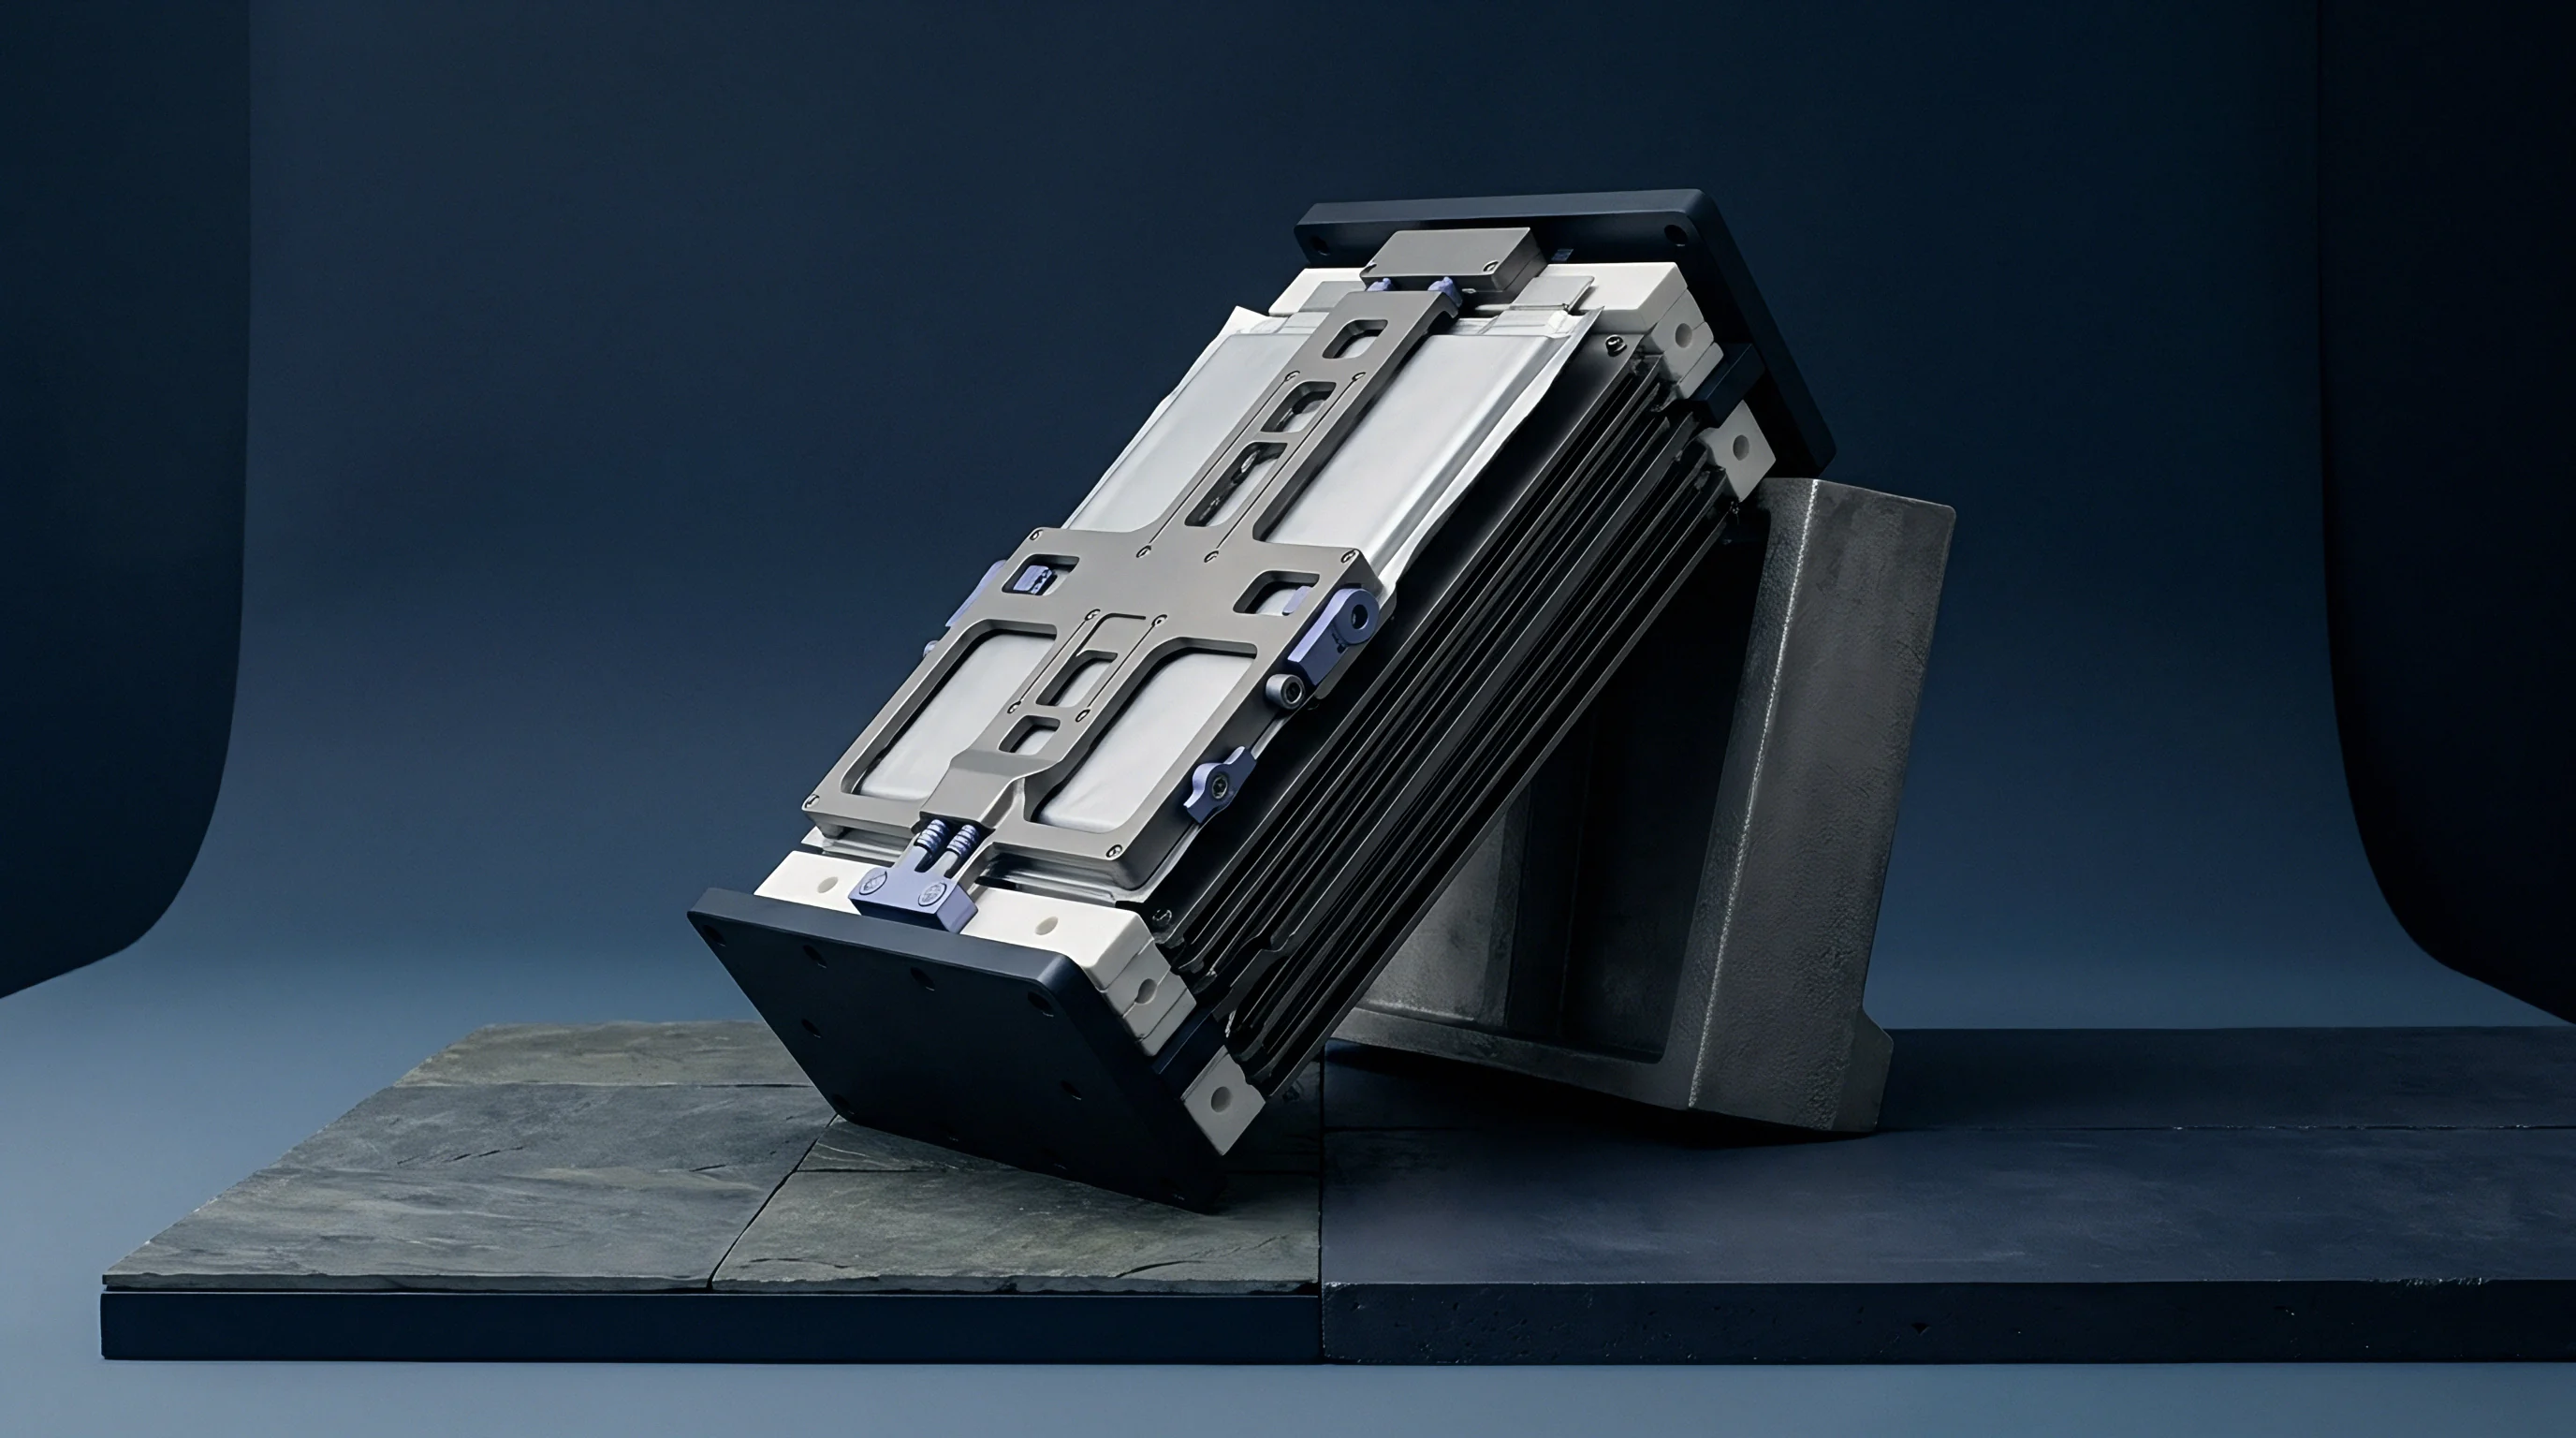
A battery pack’s structural enclosure sets both its volumetric energy density and its thermal boundary conditions. Internal dimensions define the envelope available for cells, cooling plates, interconnects, and insulation. If perimeter dimensions drift from nominal targets, the mechanical alignment between neighboring cells shifts immediately, raising the risk of localized over-compression, busbar shear fatigue, and displacement of thermal interface materials.

Spatial Boundaries and Component Datums
Prismatic and pouch cells require tight spatial envelope controls to prevent localized stress buildup. Component drawings typically rely on a primary datum scheme anchored to machined locating surfaces or stamped alignment features. Because flexible sheet metal housings deform easily during inspection, establishing repeatable datum targets requires careful fixture design.
A three-point primary datum on a bottom cast surface establishes a stable reference plane, while secondary and tertiary pin slots control lateral translation.
Variations in sidewall flatness propagate across the full cell array, making it critical to tie profile tolerances governed by ASME Y14.5 directly to primary datums rather than virtual centerlines. Extruded aluminum sidewalls offer high structural rigidity while maintaining profile tolerances over long module spans. Standard 6063-T6 extrusions hold profile tolerances within plus or minus 0.35 mm over a 600 mm length without secondary machining, though progressive die wear gradually expands cross-sectional dimensions over extended production runs.
Individual cell pitch is set by positioning slots stamped into the lower tray structure. If hole-to-hole center distances drift across twenty consecutive slots, the cumulative error shifts cell positions relative to fixed busbar mounts. Holding a pitch tolerance of plus or minus 0.12 mm per slot prevents misalignments during automated ultrasonic wire bonding or laser welding.
When accumulated pitch errors exceed these compliance limits, mating interconnects experience mechanical binding during automated assembly.
| Component Feature | Manufacturing Process | Nominal Dimension (mm) | Tolerance Limit (mm) | Process Capability (Cpk) |
|---|---|---|---|---|
| Extruded Wall Flatness | Aluminum Extrusion (6063-T6) | 600.00 | ± 0.35 | 1.45 |
| Stamped Tray Pitch | Progressive Die Stamping | 18.50 | ± 0.08 | 1.67 |
| End Plate Parallelism | CNC Milling (6061-T6) | 150.00 | ± 0.05 | 1.33 |
| Cooling Plate Surface Flatness | Roll Bonding and Brazing | 550.00 | ± 0.40 | 1.12 |
Pouch and Prismatic Physical Enclosure Interfaces
Prismatic hard-can cells rely on their outer casing dimensions to set stack limits. Can width tolerances typically run plus or minus 0.15 mm per cell. In a module of twenty-four series-connected cells, width variations alone can add up to 3.6 mm of total linear stack variation under worst-case conditions.
End plates must absorb this dimensional range without losing baseline contact pressure against active cooling surfaces.
Pouch cells present additional envelope challenges due to flexible outer seals and variable thickness across their active areas, driven mainly by slurry coating distribution and separator tolerances. A pouch cell with a nominal thickness of 11.50 mm typically carries a tolerance band of plus or minus 0.20 mm. The peripheral heat seal introduces extra variation from foil folding and material squeeze-out during sealing.
An assembly wall designed without clearance for pouch thickness tolerance causes internal cell crushed tabs during module insertion.
Stacking pouch cells without compliant inter-cell pads transfers housing dimensional variations directly to internal tab joints. Excessive mechanical constraint concentrates stress along the current collector foil welds, causing overconstrained cell arrays to bind during assembly.
- Tab Fatigue Fracture driven by cumulative lateral cell displacement exceeding the elastic compliance limits of flexible copper busbars.
- Thermal Interface Shear caused by non-uniform contact force distributions across localized cooling plate regions.
- Short Circuit Instability resulting from peripheral pouch seal crimping against rigid structural frame ribs during high-G acceleration events.
- Cell Wall Buckling occurring when severe housing tolerance convergence forces rigid prismatic cans past their yield strength under fully compressed conditions.
Uncontrolled frame profile variations lead to electrical insulation breakdown, premature busbar weld fatigue, and immediate line rejections when module subassemblies exceed spatial envelope limits.
Stack
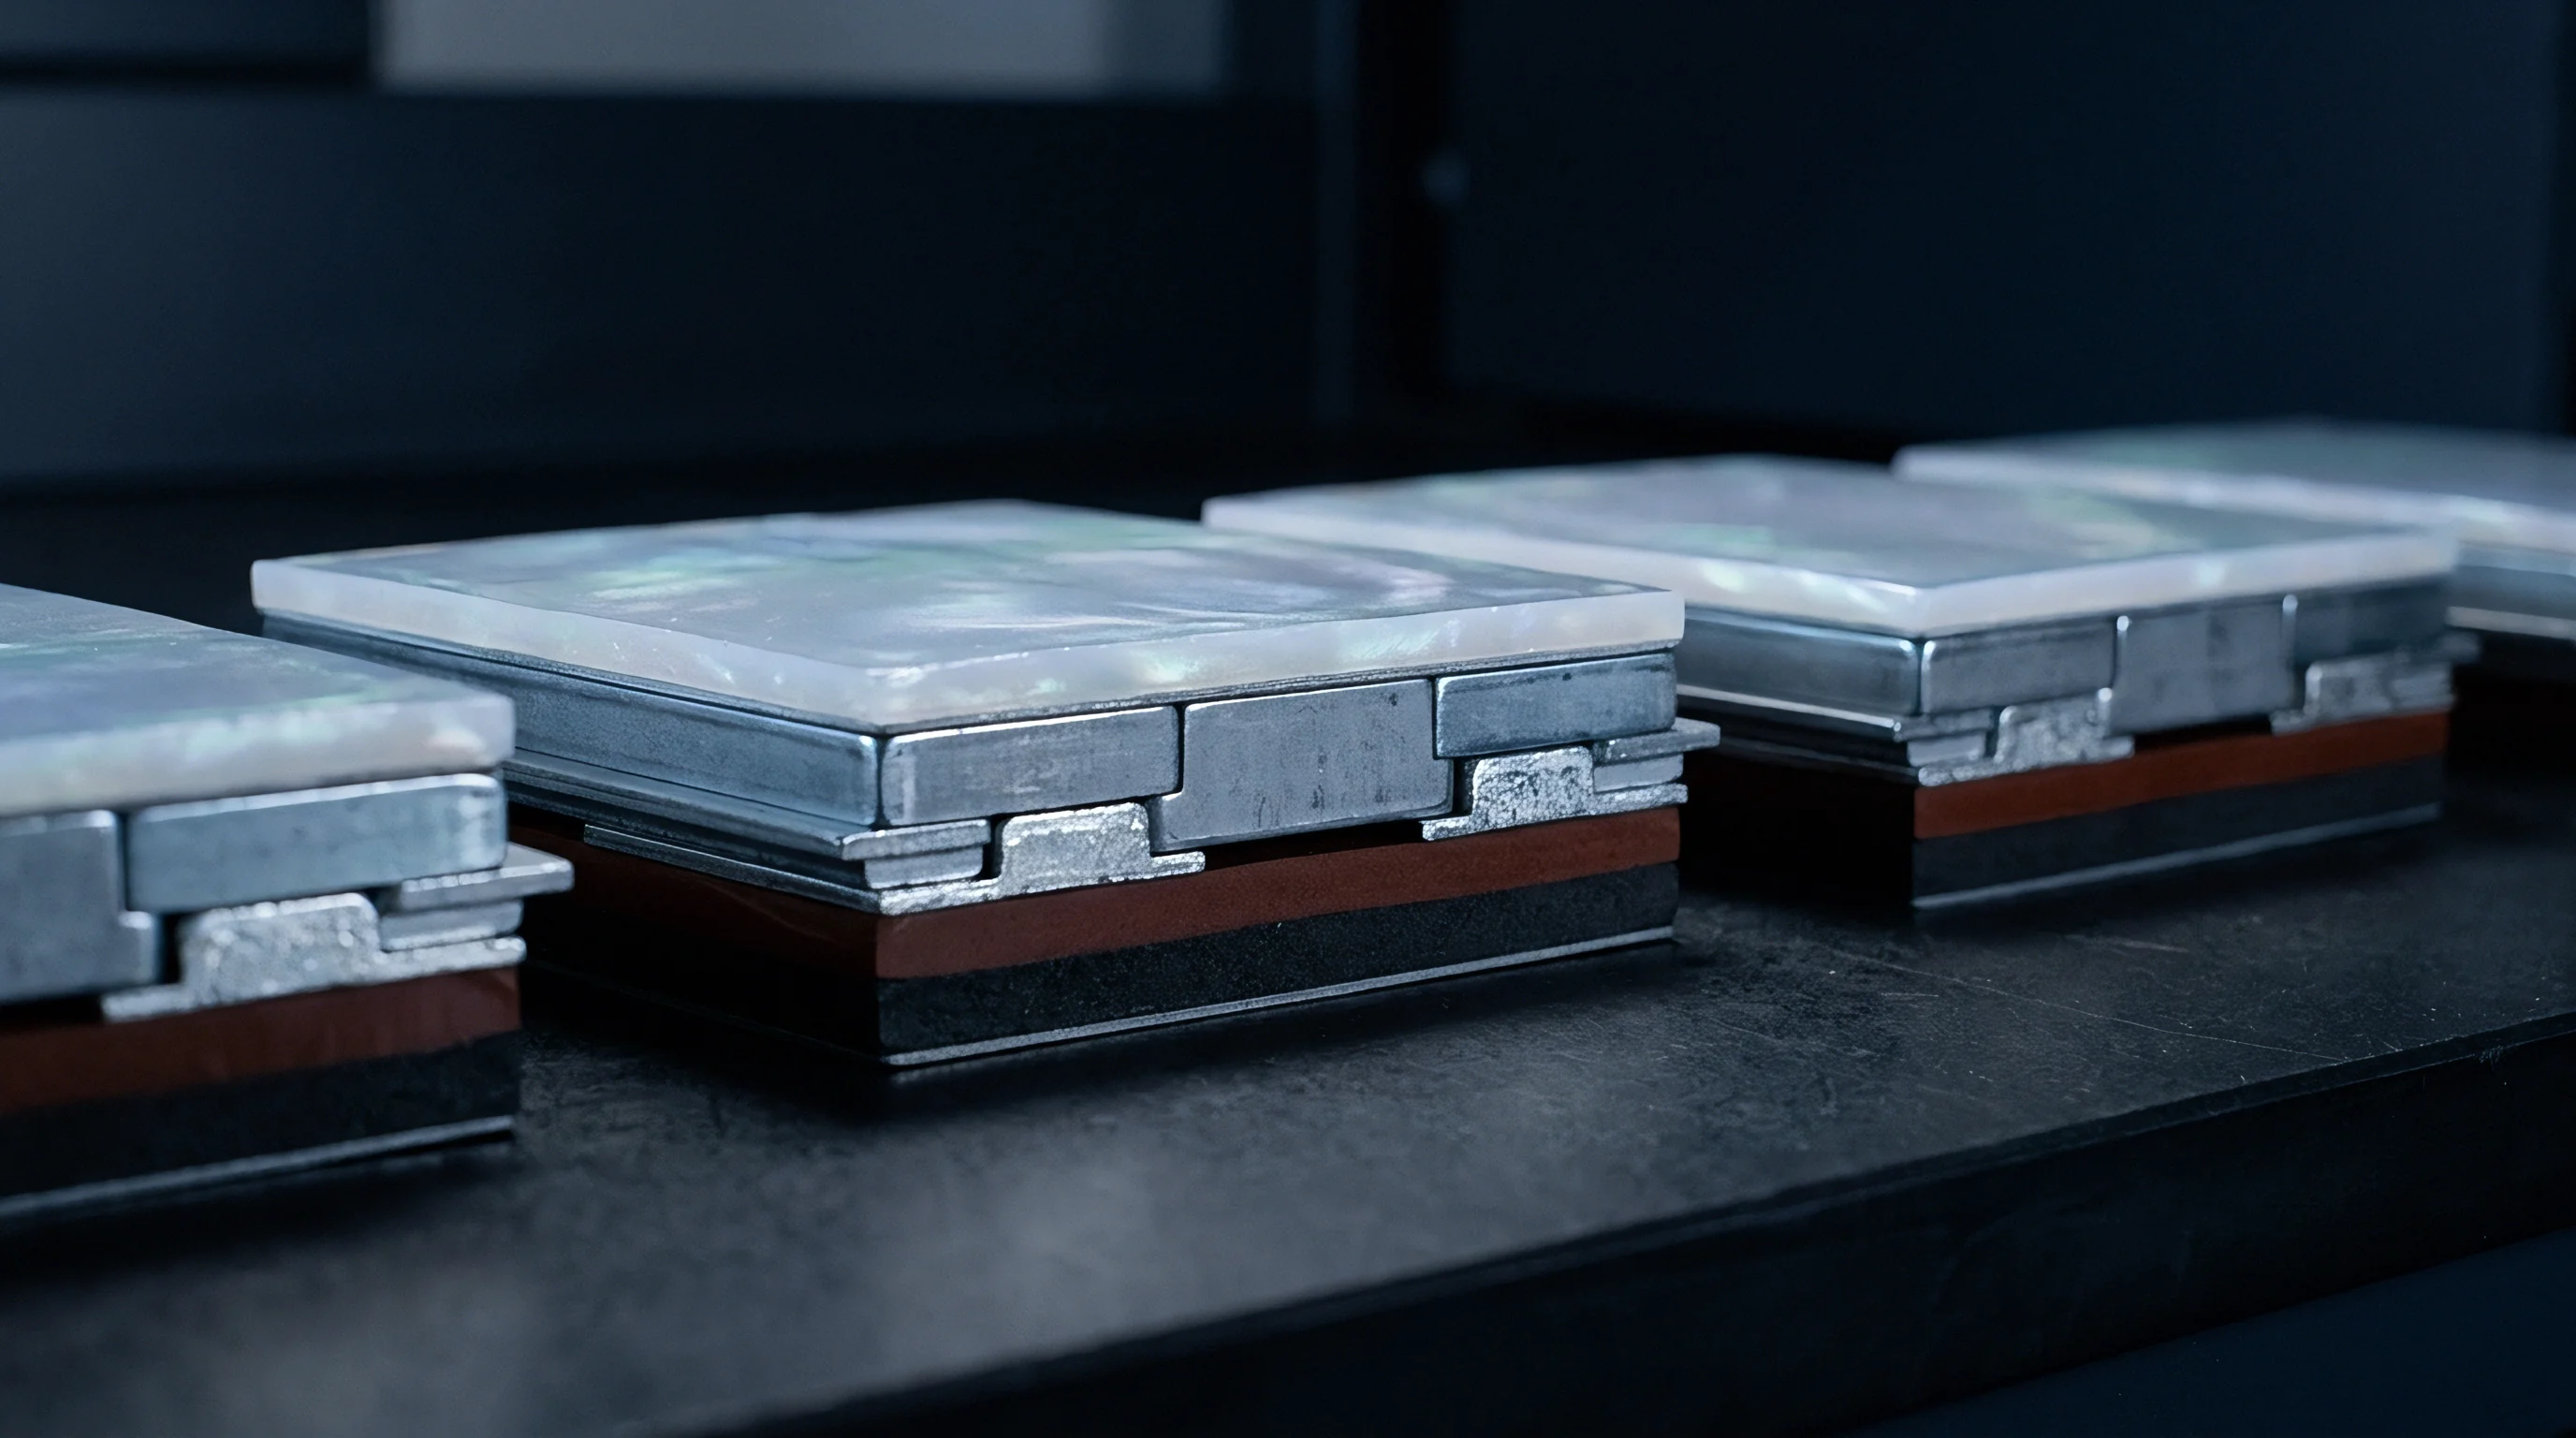
Dimensional variation accumulates across every mechanical layer in an energy storage module. Evaluating total spatial requirements requires analyzing both absolute worst-case boundaries and statistical probability distributions. Stack models that omit thermal expansion, cell swelling, and component manufacturing tolerances risk binding during installation or losing required compression pressure over the module’s operating life.
Worst Case against Statistical Distribution Models
Linear summation assumes every component lands simultaneously at its extreme material limit. Arithmetic worst-case models add absolute tolerance values directly:
T_worst_case = sum(t_i)
where t_i represents the tolerance bandwidth for each layer. For a twenty-cell prismatic stack with cell thickness tolerances of plus or minus 0.15 mm, twenty compression pads at plus or minus 0.08 mm, and two end plates at plus or minus 0.10 mm, worst-case stack variation reaches plus or minus 4.80 mm. Sizing structural housings for this extreme requires excessive packaging volume and overly soft foam pads.
Statistical tolerancing uses probability density functions to model stack accumulation. Standard root-sum-square analysis assumes component dimensions follow independent normal distributions centered within their tolerance bands:
T_rss = sqrt(sum(t_i^2))
Applying root-sum-square calculations to the same twenty-cell module gives a statistical stack tolerance of plus or minus 0.77 mm, assuming manufacturing processes operate at a process capability index of 1.0. If process distributions drift off-center, simple root-sum-square models underestimate actual assembly variance. Modified equations add a process shift factor k to preserve realistic design margins:
T_mrss = k sqrt(sum(t_i^2))
Because tool wear and batch shifts alter mean dimensions over time, standard practice sets k between 1.3 and 1.5 to balance packaging density against assembly yield risk.
Statistical root sum square tolerance calculations overstate safety when cell swelling exhibits spatial correlation across contiguous slots.

Can Statistical Tolerancing Safely Lower End Plate Thickness?
Replacing arithmetic stack limits with probabilistic distributions allows reductions in end plate mass, provided incoming component capability is strictly verified. When cell thickness metrics consistently demonstrate Cpk values above 1.67, end plate thickness can be reduced by up to thirty percent without compromising structural integrity under worst-case loading.
Statistical stack models must integrate geometric features such as parallelism, flatness, and perpendicularity alongside linear dimensions. A cell with face parallelism off by 0.05 degrees creates uneven contact pressure across its surface, converting linear stack variation into angular distortion. A typical calculation sequence proceeds through the following steps:
- Gather statistical mean and standard deviation metrics for cell thickness, compression foam thickness, and insulation sheet dimensions from supplier first-article inspection sheets.
- Establish primary housing datums on engineering drawings, linking module mounting brackets to internal cell positioning stops.
- Compute linear arithmetic worst-case upper and lower limits to verify absolute physical boundary envelope constraints under maximum material conditions.
- Calculate statistical root sum square variation at a three-sigma level using measured component process capability indices.
- Apply thermal expansion coefficients across operating temperature ranges from minus forty degrees Celsius to eighty-five degrees Celsius.
- Incorporate long-term irreversible electrochemistry cell swelling figures at eighty percent state of health into the baseline stack sum.
- Adjust initial structural pre-charge displacement metrics to maintain required mechanical contact pressure across the entire life cycle.
General untoleranced housing dimensions fall under DIN 7168 medium-grade classifications unless engineering drawings specify tighter precision callouts.
Expansion
Lithium-ion cells experience both reversible dynamic swelling during charge-discharge cycles and irreversible volumetric growth over their operating life. Inserting lithium ions into the graphite anode expands the crystal lattice during charging, while repeated cycling builds up the solid electrolyte interphase, fractures electrode particles, and generates gas, driving permanent thickness growth.
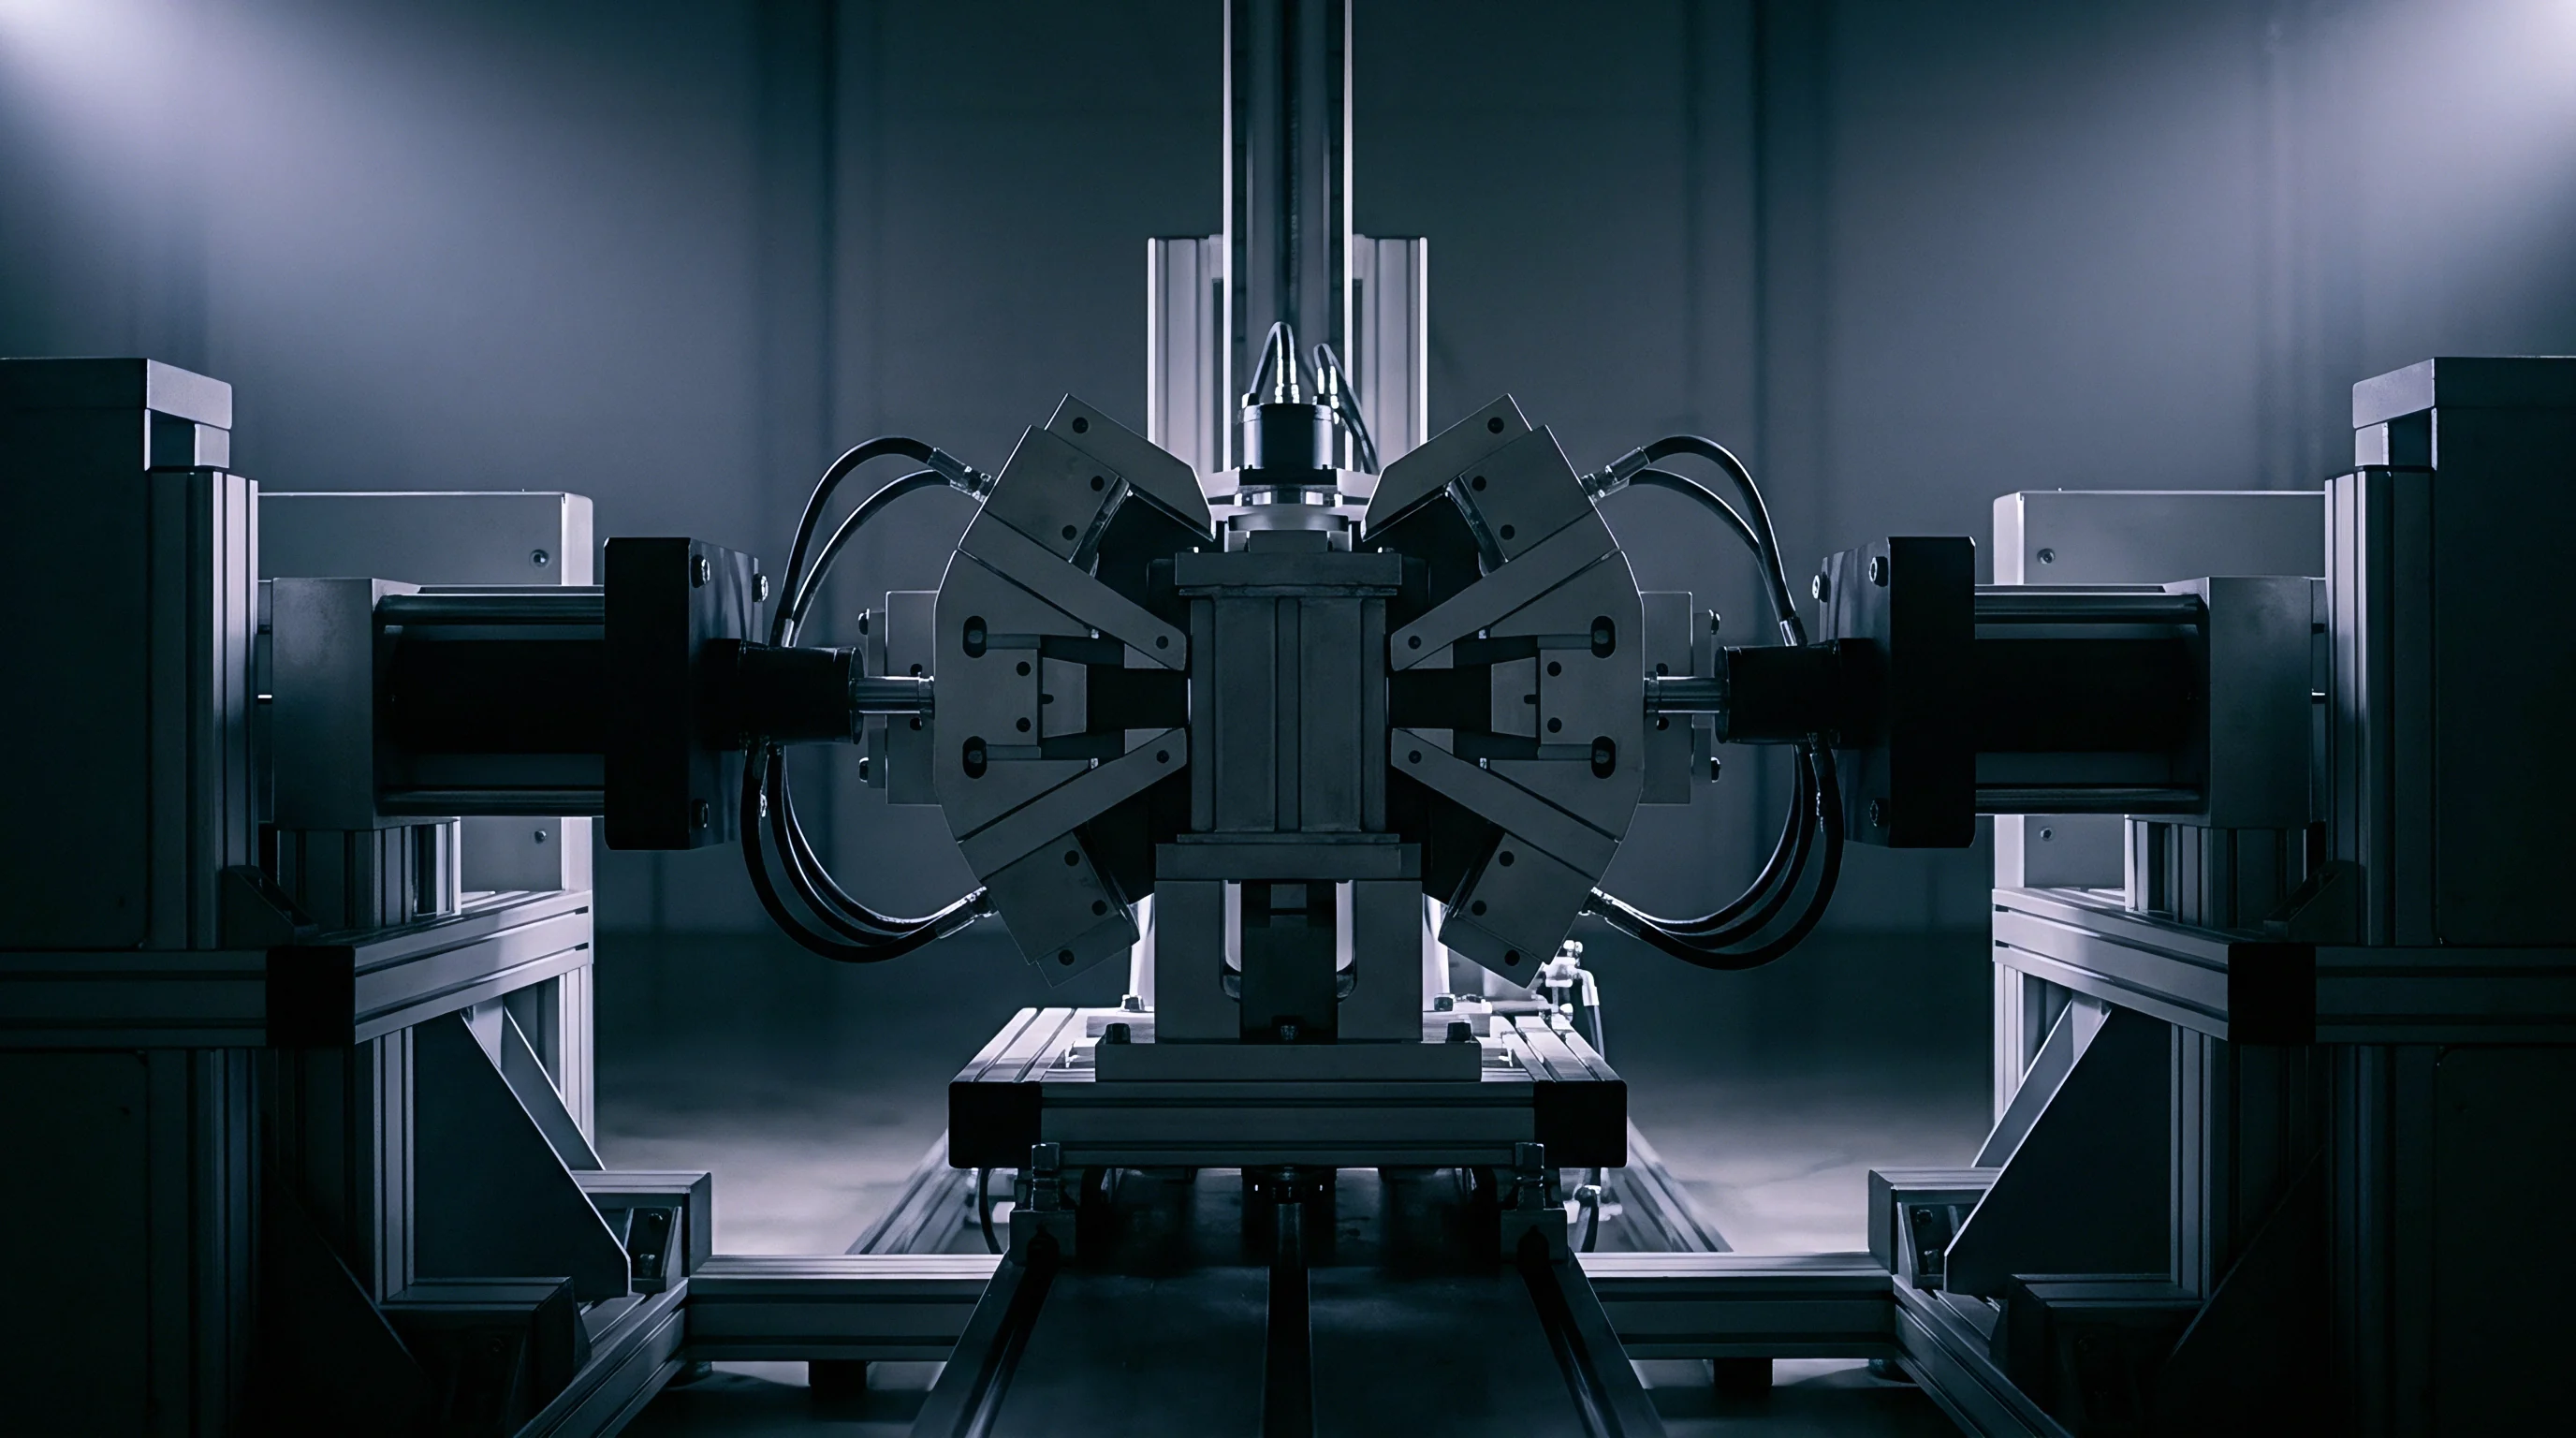
Electrode Growth Mechanics and Polymeric Pad Deflection
Electrode breathing in graphite and silicon-composite anodes compresses the elastomeric pads placed between cells. Pouch cells with silicon-alloy anodes can exhibit up to twelve percent linear swelling over eight hundred full equivalent cycles. By contrast, prismatic lithium iron phosphate cells undergo less growth, typically expanding between three and five percent over five thousand cycles.
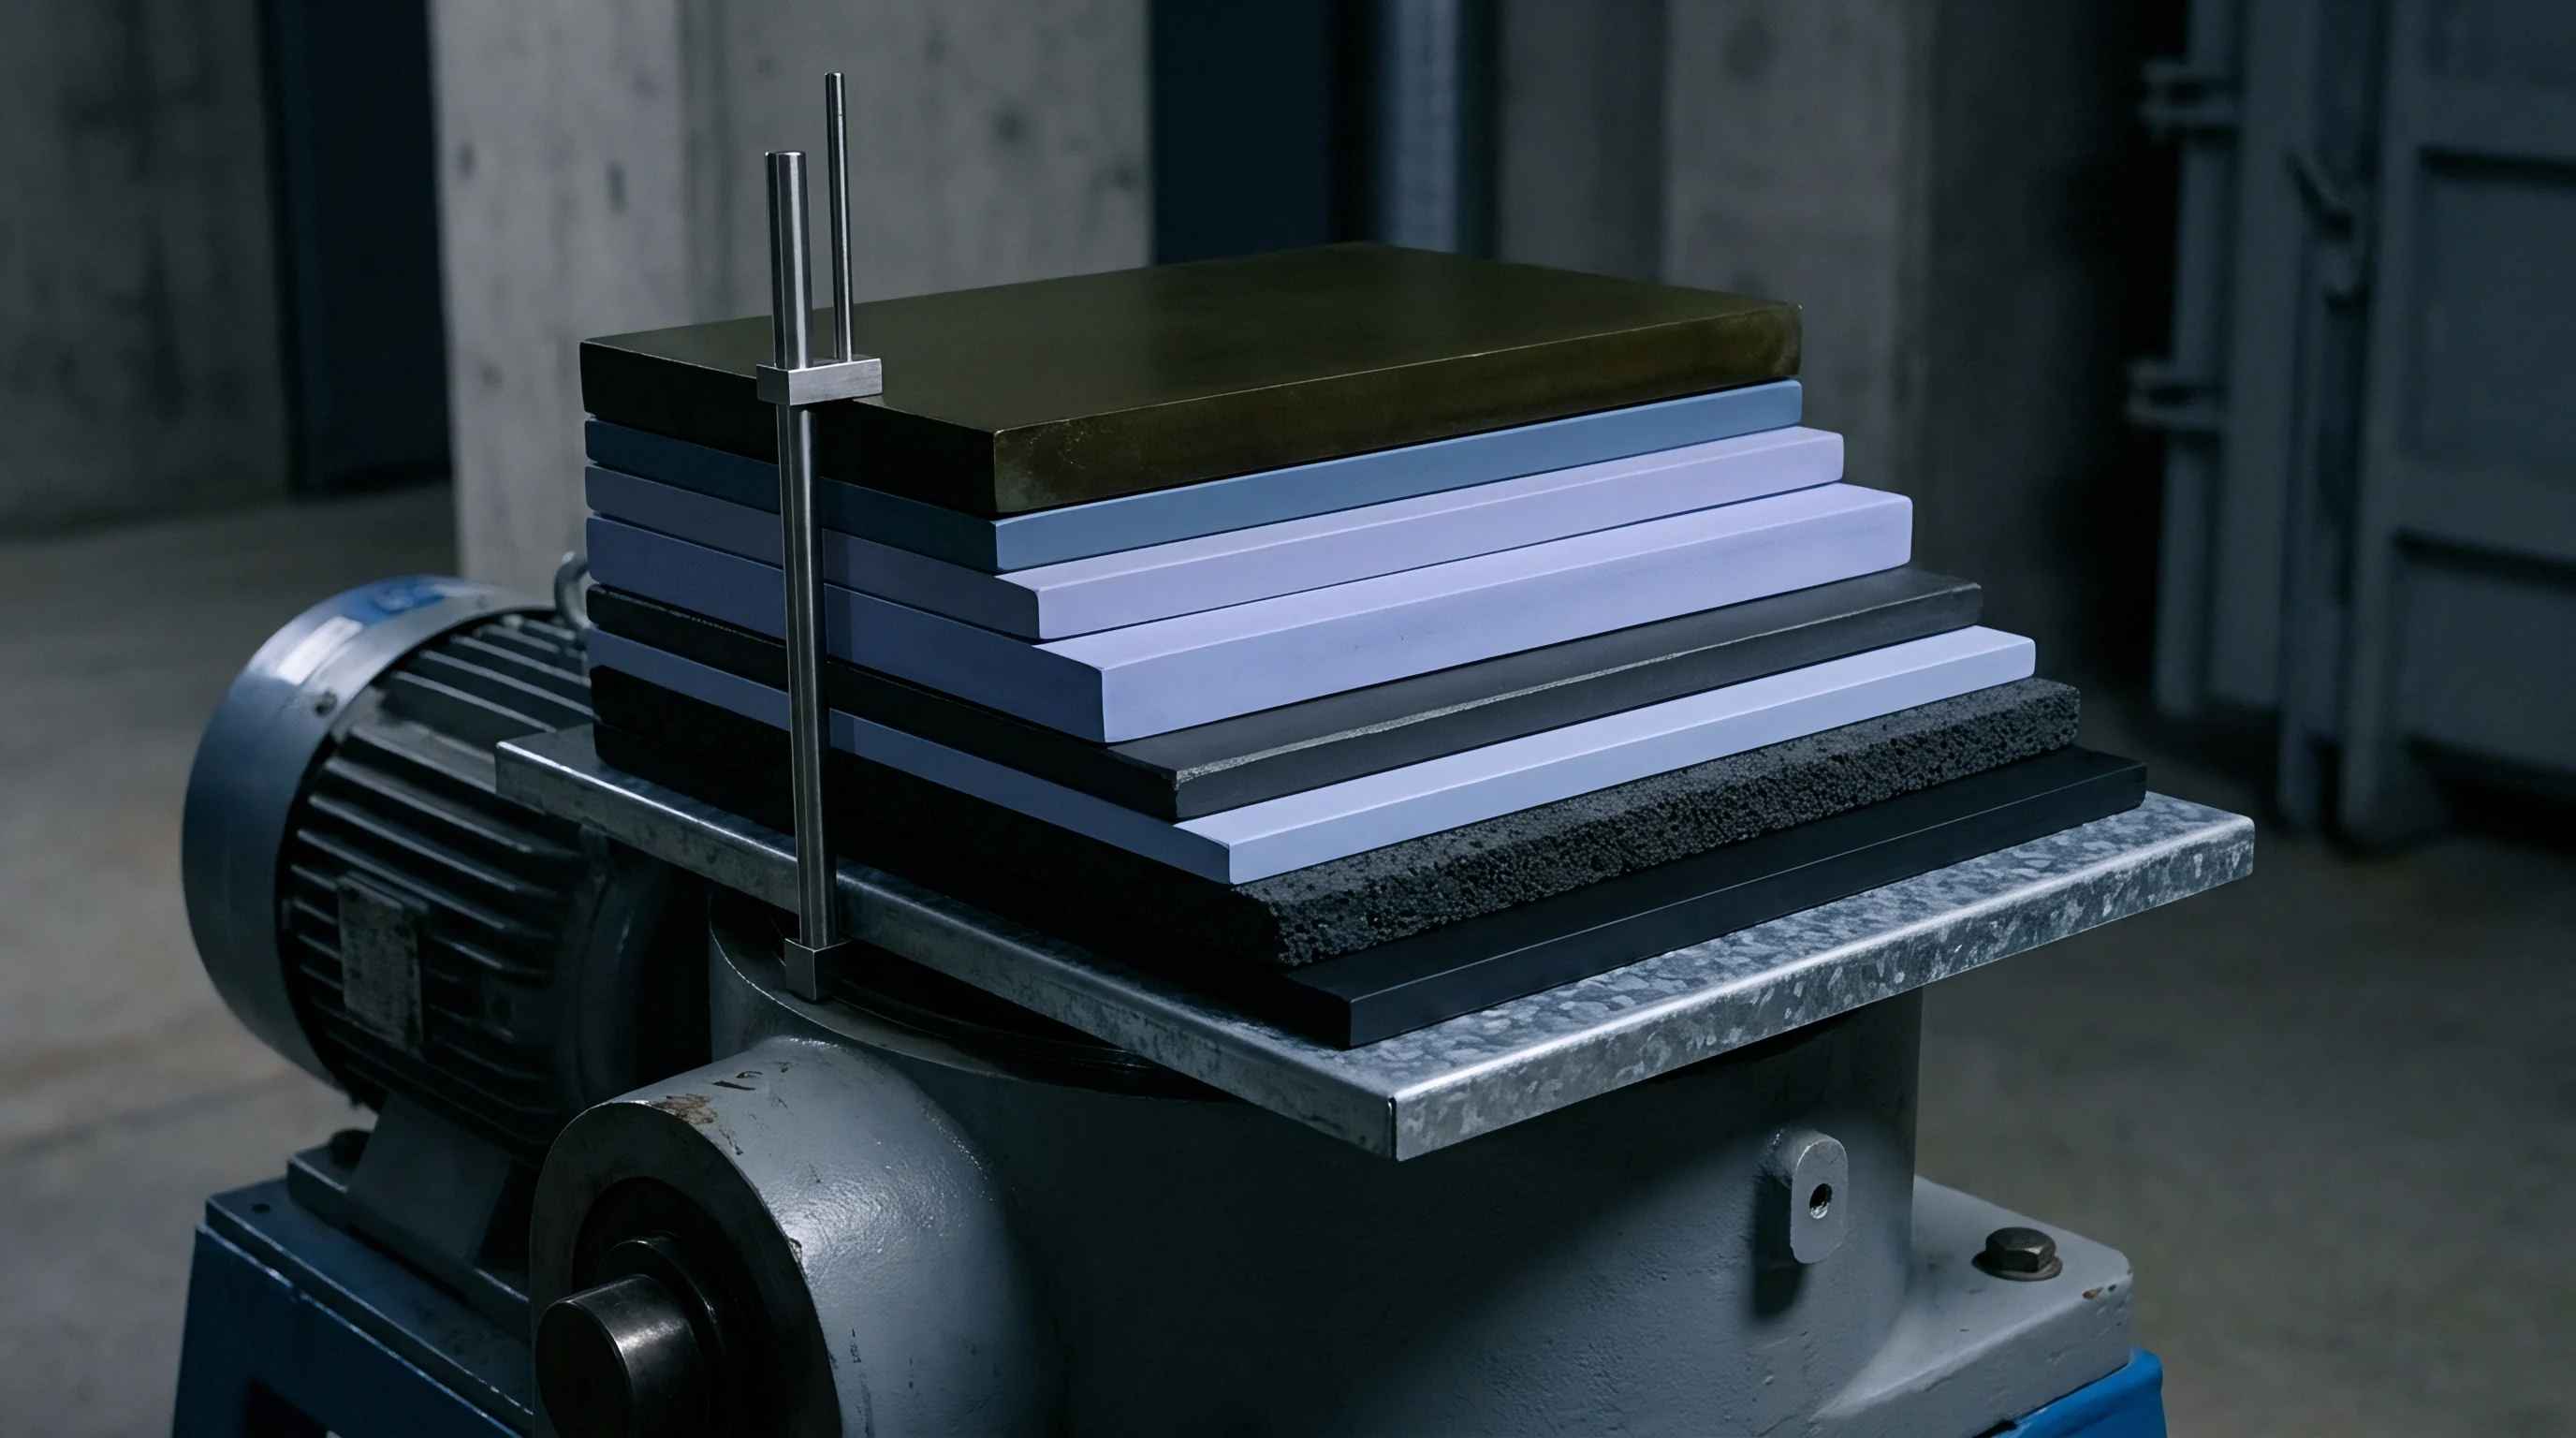
Microcellular polyurethane pads placed between cells absorb these dimensional changes. Because elastomeric compression pads exhibit non-linear stress-strain behavior, they dictate the internal mechanical pressure within the stack. At low strain, the foam deforms readily under initial assembly pre-loads, but once cell swelling pushes strain past fifty percent, the foam enters its densification regime and internal stress rises exponentially.
Operating deep within this densification range significantly elevates baseline pressure across adjacent cell faces.
| State of Health (%) | Cell Swelling Strain (%) | Pad Strain (%) | Compressive Stress (MPa) | Secant Modulus (MPa) |
|---|---|---|---|---|
| 100 (Beginning of Life) | 0.00 | 15.00 | 0.05 | 0.33 |
| 90 | 1.80 | 27.00 | 0.12 | 0.44 |
| 80 (End of Life Limit) | 4.20 | 45.00 | 0.48 | 1.07 |
| 70 (Deep Degradation) | 6.50 | 58.00 | 1.25 | 2.15 |
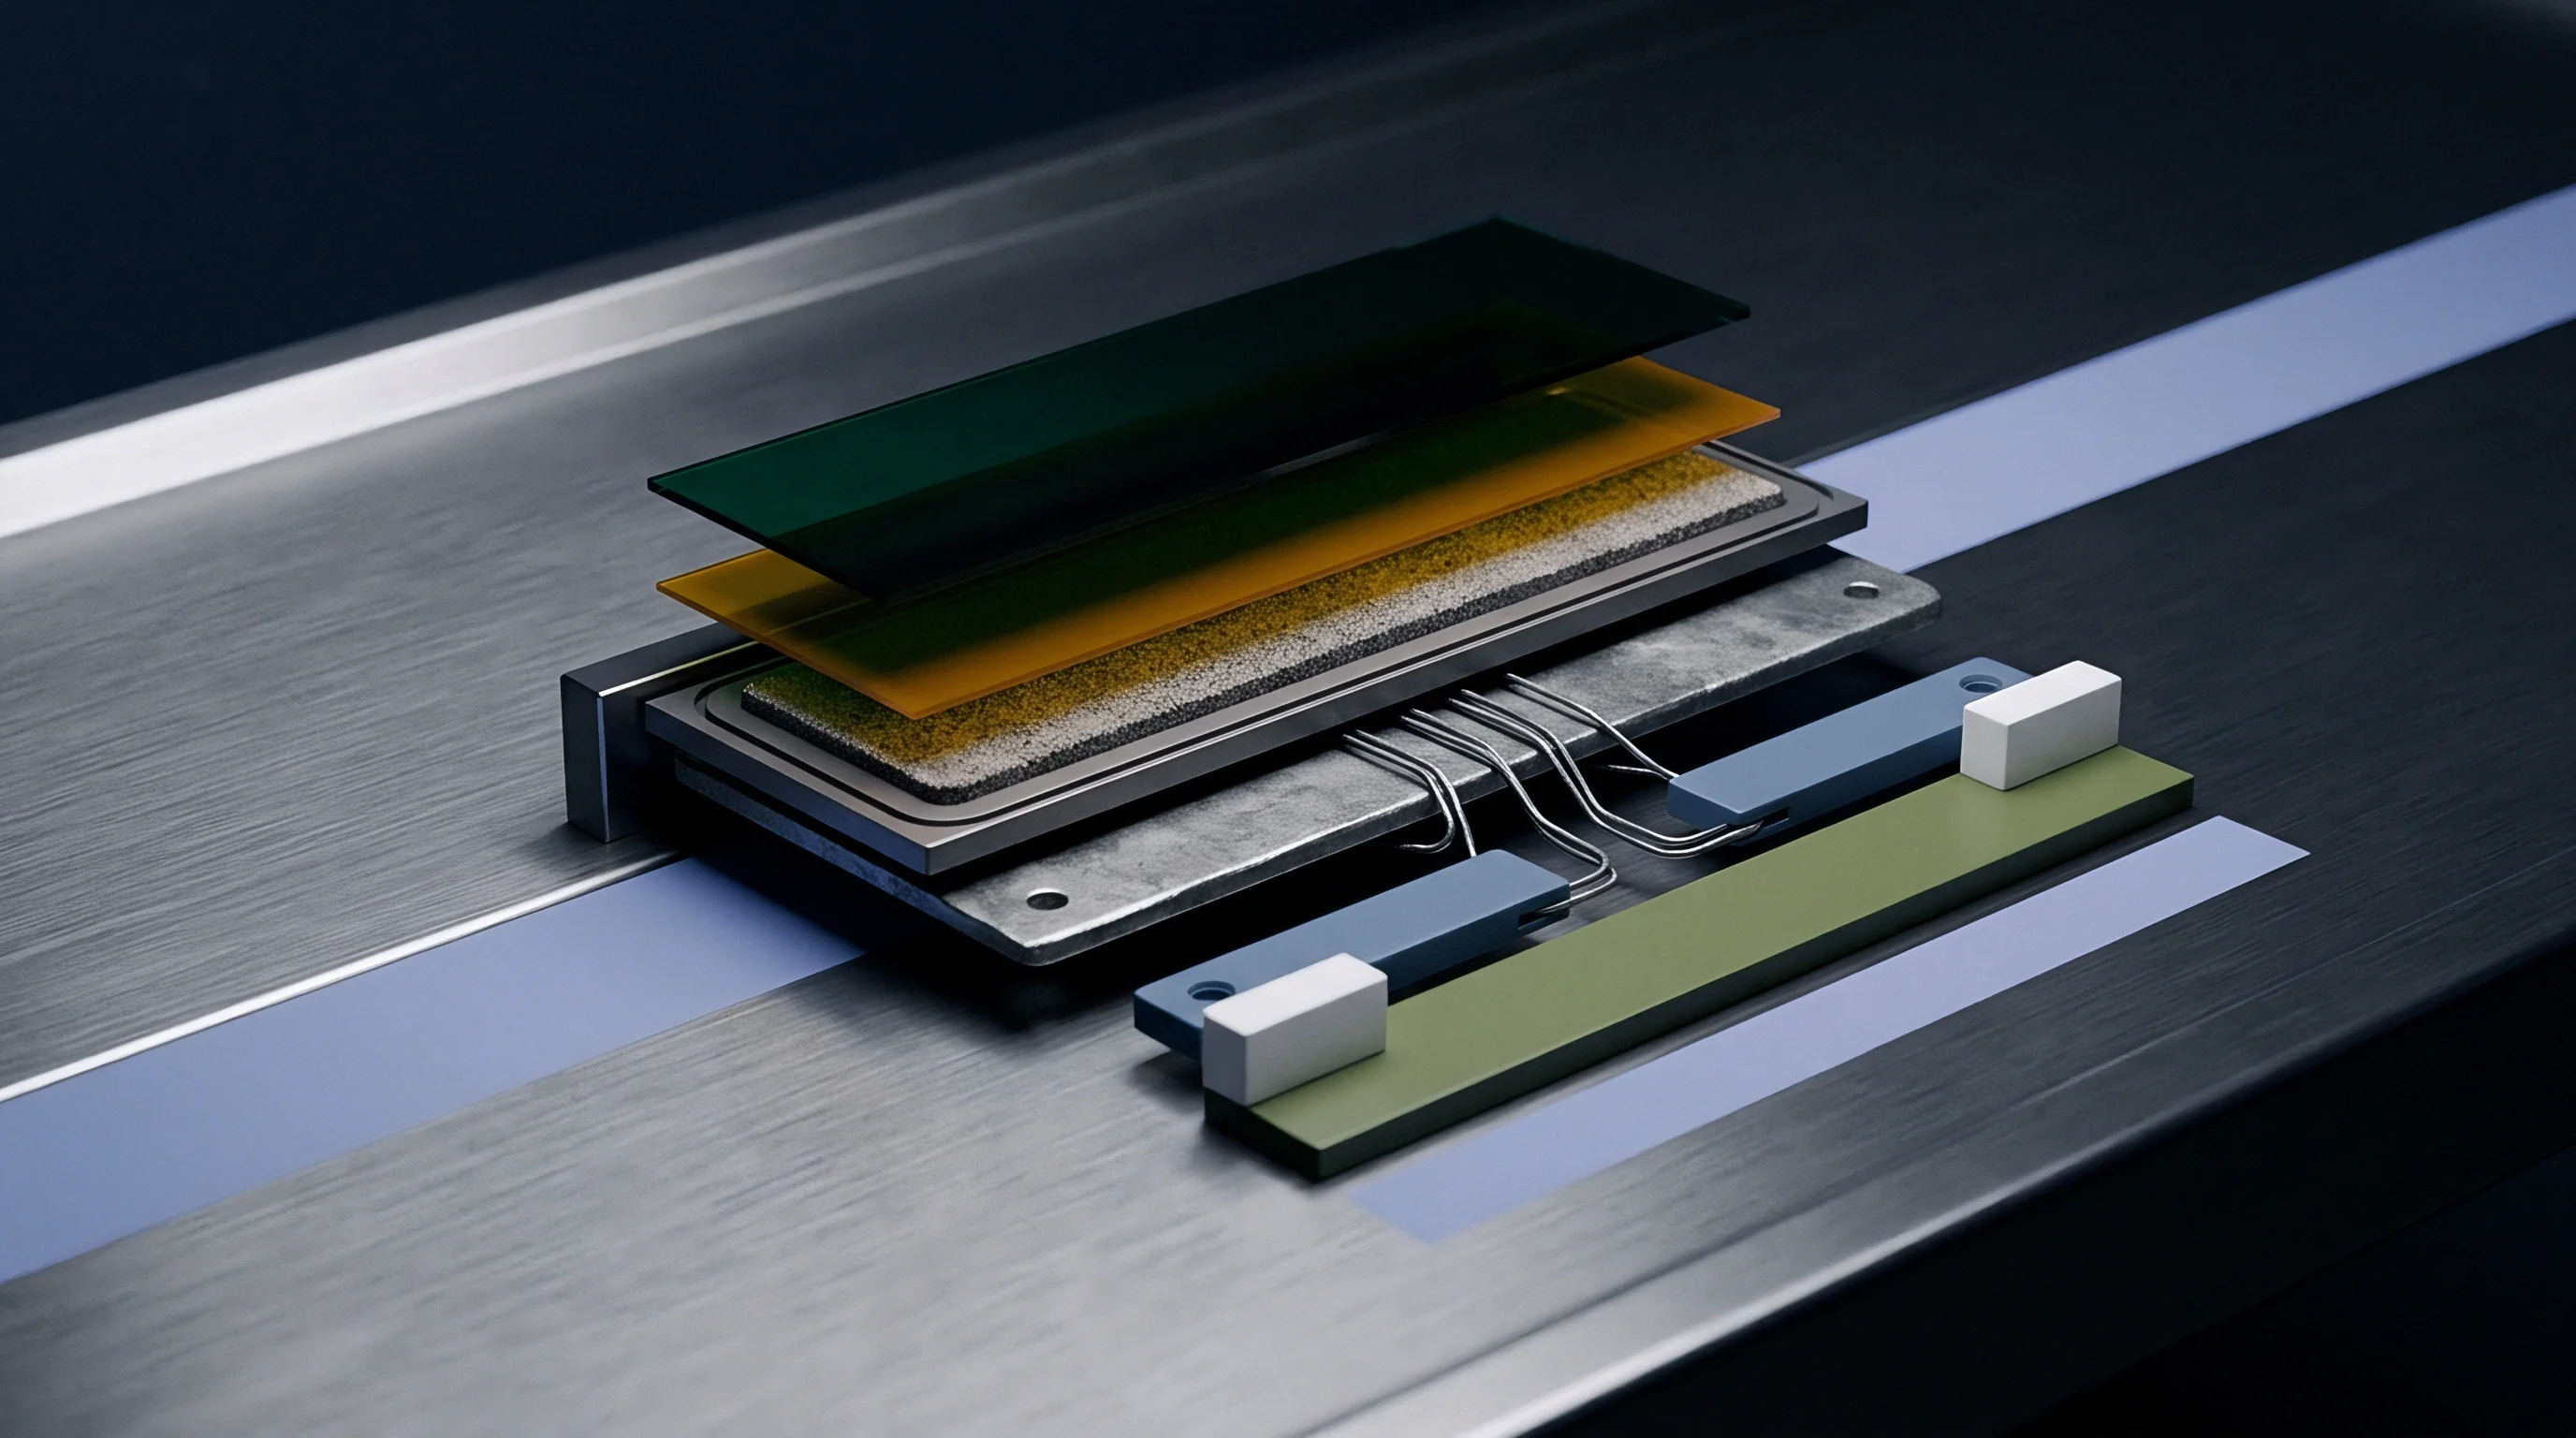
End of Life Pressure Equilibrium Calculations
Sustained cell sidewall pressure above 0.8 MPa risks separator damage and localized lithium plating. Conversely, letting pressure fall below 0.02 MPa can cause internal layer delamination and localized hot spots from elevated interfacial electrical resistance. The module enclosure must keep contact pressure bounded within this window throughout the pack’s life.
Consider a module stack of twelve prismatic cells with an initial nominal thickness of 28.00 mm and a tolerance of plus or minus 0.18 mm per cell. Each cell pairs with a 2.00 mm polyurethane compression pad having a thickness tolerance of plus or minus 0.05 mm. Rigid aluminum side plates fix the internal housing cavity length to exactly 360.00 mm.
At beginning of life, total uncompressed cell thickness equals 336.00 mm, leaving 24.00 mm of space for the twelve foam pads. Applying a pre-load displacement during module assembly compresses each pad by 0.30 mm, establishing an initial strain of fifteen percent. At an initial secant modulus of 0.33 MPa, beginning-of-life interface pressure sits at 0.05 MPa.
By end of life (eighty percent state of health), each cell expands irreversibly by 4.2 percent, adding 1.176 mm per cell for a total stack growth of 14.11 mm. Because elastic strain in the aluminum side plates limits total cavity expansion to 0.25 mm, the twelve pads must absorb 13.86 mm of displacement, or an extra 1.155 mm of compression per pad.
This pushes total pad strain to 72.75 percent. Deep in the densification region, compressive stress reaches 1.18 MPa, exceeding the 0.80 MPa sidewall limit. Resolving this over-pressure condition requires increasing baseline pad thickness to 3.00 mm or reducing initial assembly pre-load.
Silicon-graphite composite anodes exhibit up to twelve percent thickness expansion at full state of charge after eight hundred cycles.
Aerospace pressure vessels use similar dynamic load-balancing principles to prevent casing failure during thermal cycling. Applying these structural mechanics methods to battery pack enclosures prevents localized material yielding.
How do localized cell swelling variations across asymmetric thermal gradient fields shift side plate tension distributions during fast charging?
Fastener
Threaded rods, side straps, and cold-drawn tie bars contain internal expansion forces by placing the housing under controlled tension. These tensioning systems maintain structural alignment under vehicle vibration while absorbing stack breathing. The choice of joining method determines whether an assembly retains bolt torque over time or suffers clamping loss through material creep.

Clamping Bolt Preload and Side Plate Shear Stresses
Structural side plates joined to end frames restrain dynamic stack breathing during fast charging. When side plates are bolted, initial fastener preload must accommodate both joint clamping requirements and maximum end-of-life swelling loads.
Under peak swelling, side plates carry high tensile loads along their longitudinal axis, generating high bearing stresses around fastener holes in aluminum plates. Bearing stress sigma_b is expressed as:
sigma_b = F_shear / (d t)
where F_shear is the shear load transferred per bolt, d is nominal shank diameter, and t is side plate thickness. If local bearing stress exceeds the yield strength of 6061-T6 aluminum (typically 240 MPa), hole elongation causes permanent loss of joint clamp load.
Localized yielding around fastener holes permanently reduces baseline torque retention across the joint.
- Bolt Preload Loss triggered by thread plastic deformation under maximum cyclic dynamic shock loading.
- Side Strap Buckling occurring when thermal contraction of end plates induces compressive stress state along thin side metal strips.
- Weld Seam Fatigue Failure occurring along laser-welded side plate joints subjected to continuous inter-cell swelling strain cycles.
- Thread Stripping Strain developing in extruded internal aluminum threads subjected to elevated high-temperature torque conditions.

Thermal Expansion Mismatch across Dissimilar Metals
Aluminum housing walls expand at twenty-three micrometers per meter per Kelvin, compared to twelve for steel tie rods. Operating across temperature extremes from minus forty degrees Celsius to eighty-five degrees Celsius introduces significant differential expansion stresses.
In a module using 500 mm steel tie rods to restrain an aluminum housing, a 65 Kelvin temperature rise above ambient creates a differential expansion delta_L:
delta_L = L (alpha_aluminum – alpha_steel) delta_T
delta_L = 0.500 (23e-6 – 12e-6) 65 = 0.3575 mm
This growth differential pulls additional tension into the steel tie rods. The resulting axial force delta_F is calculated as:
delta_F = (delta_L E_steel A_rod) / L
For two steel tie rods with a total cross-sectional area of 100 mm^2 and a Young’s Modulus of 210 GPa, thermal expansion adds 15.01 kN of tension. Unaccounted thermal mismatch can cause bolt yielding or thread shear during thermal shock testing.
While thread-locking compounds are intended to prevent torque loss, physical teardowns routinely reveal localized aluminum thread creep under sustained thermal expansion loads.

Margin
Maintaining production yield depends on controlling dimensional variance before components reach final module fit-up. Uncontrolled stackup creates high scrap costs when finished modules jam during pack-level tray installation. Combining selective assembly strategies with unambiguous drawing standards protects manufacturing margins.
Shim Selection Strategies for Production Yield
Selective assembly uses graded shim sizes to absorb accumulated housing variance. Instead of holding sub-hundredth-millimeter tolerances on every piece part, end plate shims are chosen from measured stack data. Automated optical inline gauging measures uncompressed stack height right after cell stacking.
Using that measurement, automated assembly equipment selects a specific shim thickness from inventory to equalize housing length before laser welding the structural side plates. This keeps component machining callouts within standard economic tolerances while securing consistent external module dimensions.
| Measured Stack Height Range (mm) | Deviations from Nominal (mm) | Selected Shim Thickness (mm) | Resulting Housing Cavity (mm) | Assembly Yield Impact (%) |
|---|---|---|---|---|
| 332.10 to 333.50 | -3.90 to -2.50 | 3.50 | 336.10 to 337.00 | 99.2 |
| 333.51 to 334.90 | -2.49 to -1.10 | 2.50 | 336.01 to 337.40 | 99.8 |
| 334.91 to 336.30 | -1.09 to +0.30 | 1.00 | 335.91 to 337.30 | 99.9 |
| 336.31 to 337.70 | +0.31 to +1.70 | 0.00 (No Shim) | 336.31 to 337.70 | 98.5 |

Drawing Notes and Contractual Specification Limits
Engineering drawings must define explicit datum targets, reference temperatures, and gauging contact loads. Measuring flexible pouch cells or foam pads without specifying contact force produces inconsistent dimensional data, making explicit inspection callouts mandatory on engineering prints.
Flatness specifications should include surface refinement controls to prevent center crowning from concentrating loads on cell centers. Profile tolerances on extruded aluminum side plates must reference 3D CAD models under ASME Y14.41 digital product definition standards.
ISO 2768-m fine tolerances apply only to machined aluminum housing surfaces prior to anodization or structural adhesive application.
Incoming inspection procedures require thermal correction for dimensions measured away from standard temperature before issuing rejection notices. For example, an aluminum side plate measured at thirty-five degrees Celsius on a shop floor without thermal compensation can falsely appear out of specification, causing unnecessary disputes and line stoppages.