Spatial Thermal Conductivity Characterization in Prismatic Formats
Measuring anisotropic conductivity tensors under mechanical stack compression prevents thermal modeling errors in large prismatic lithium battery packs.


Anisotropy
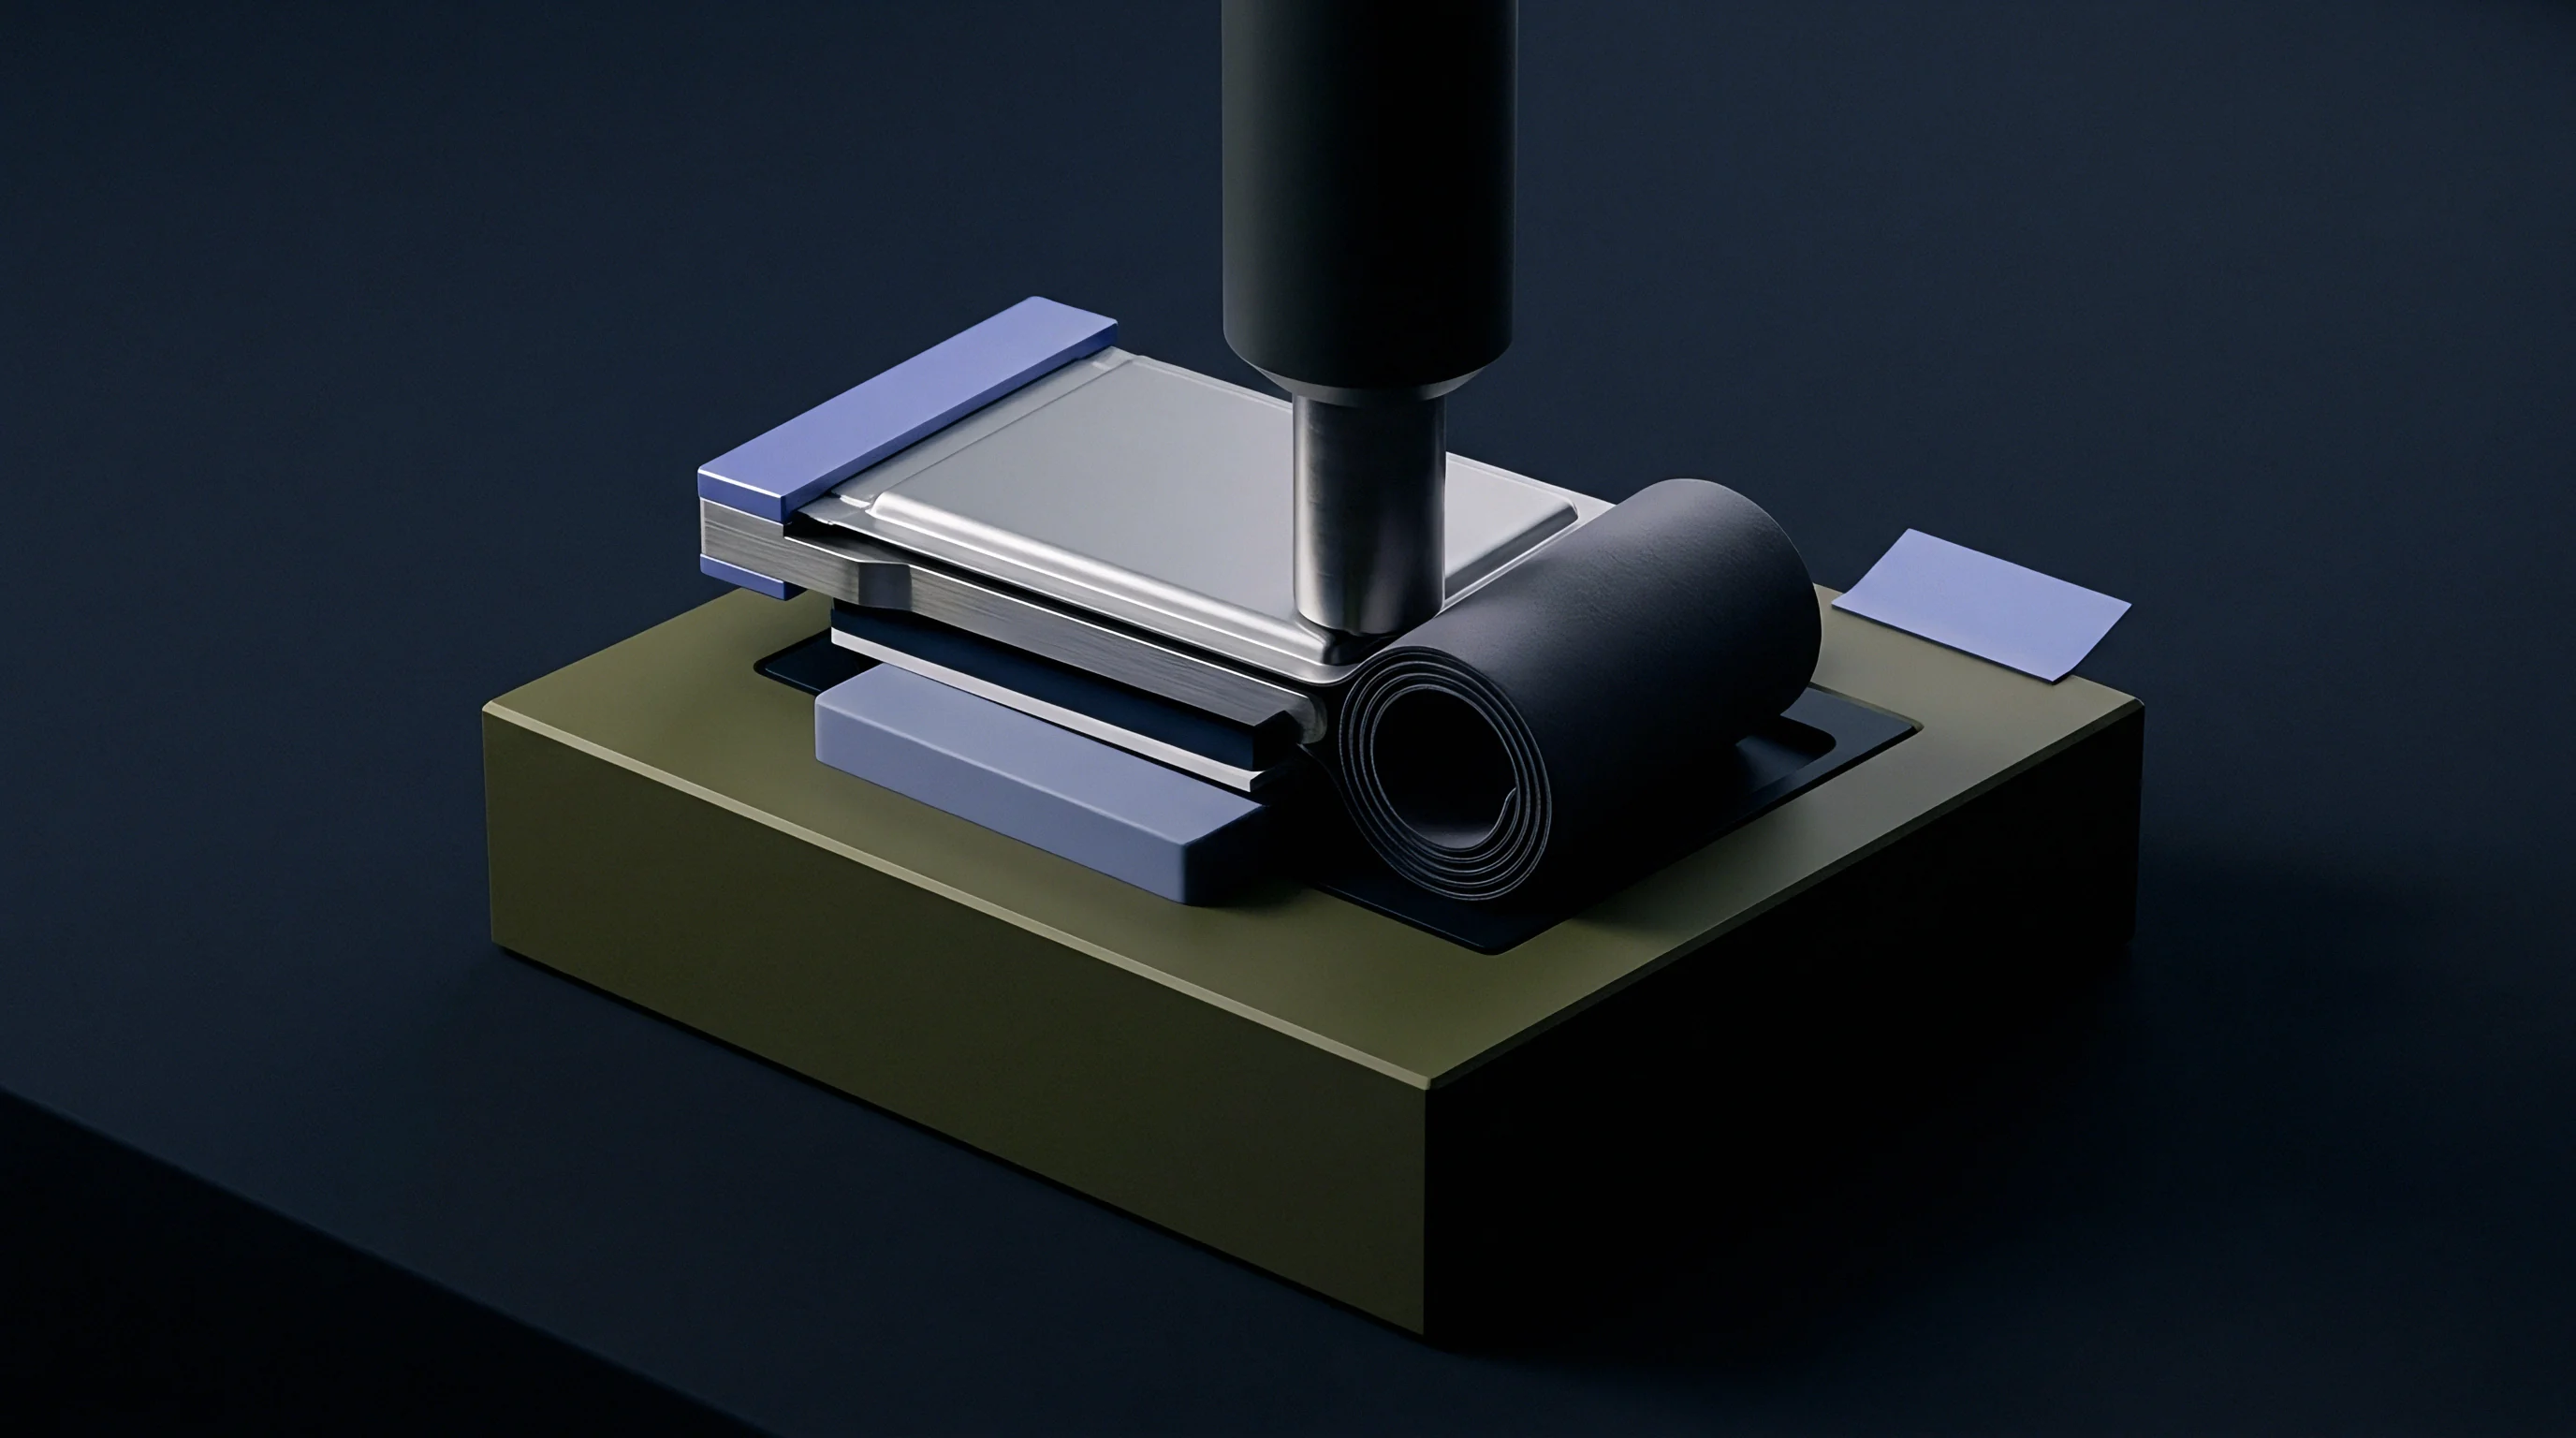
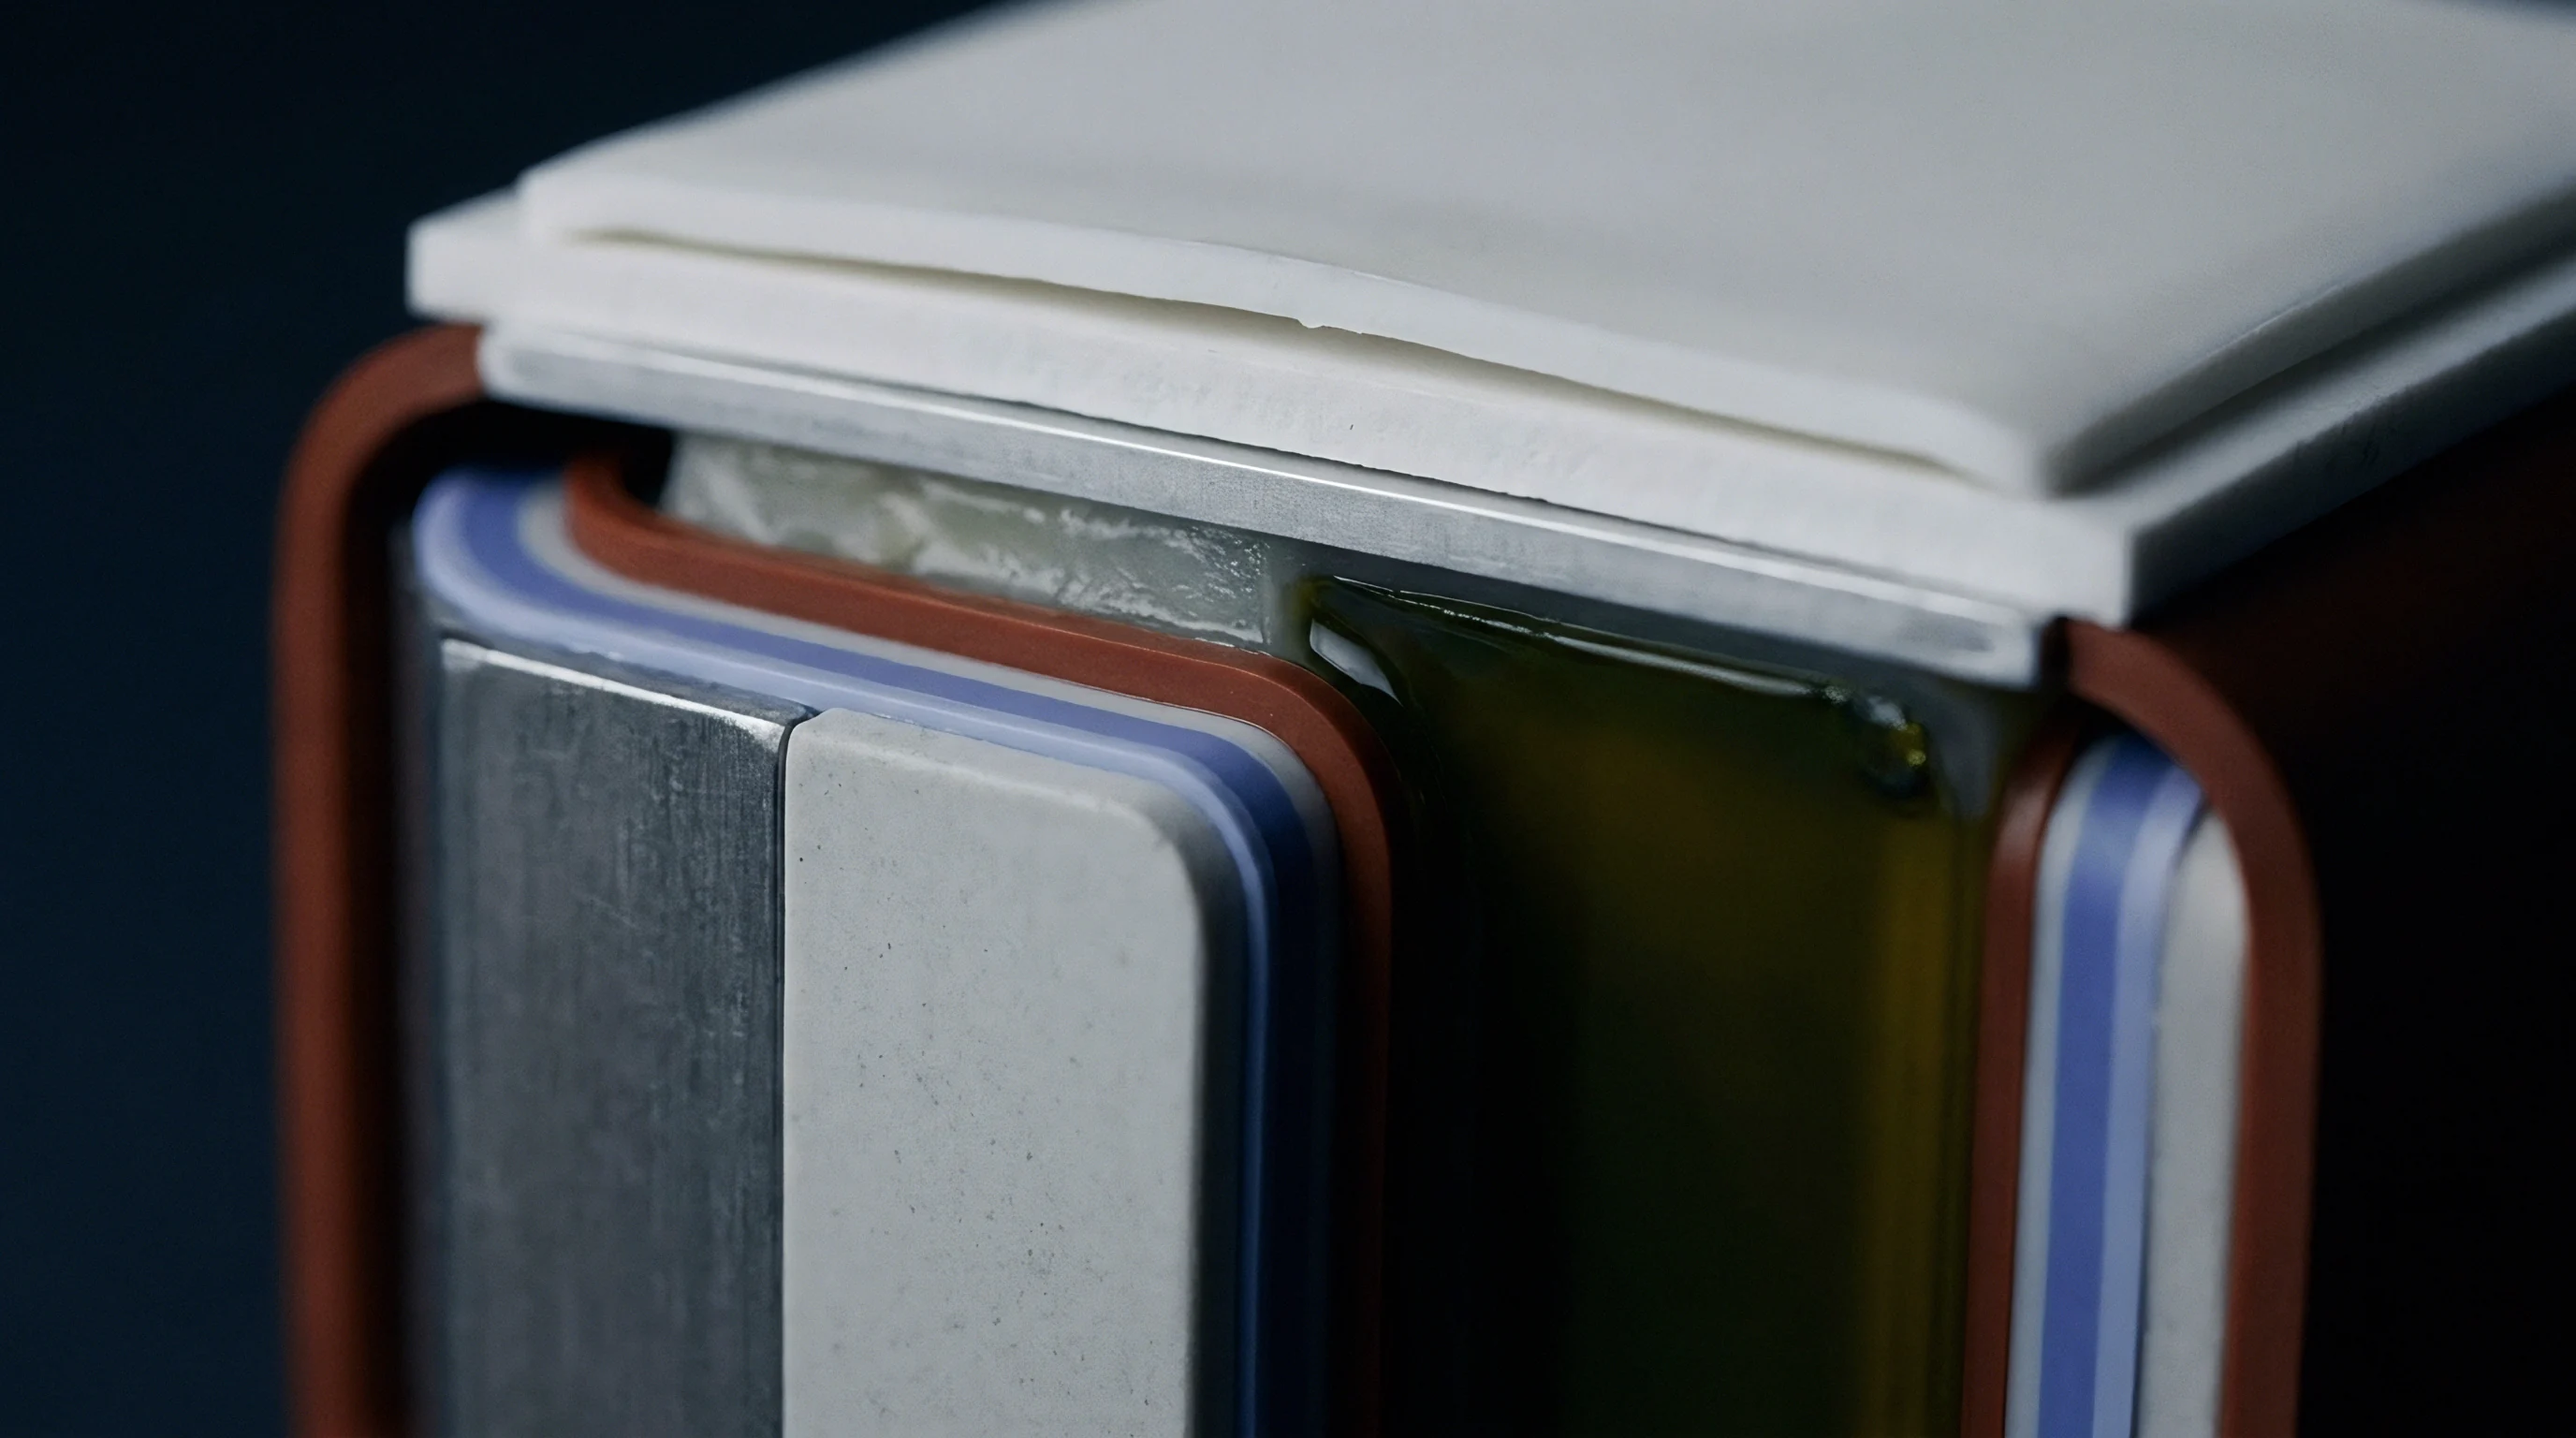
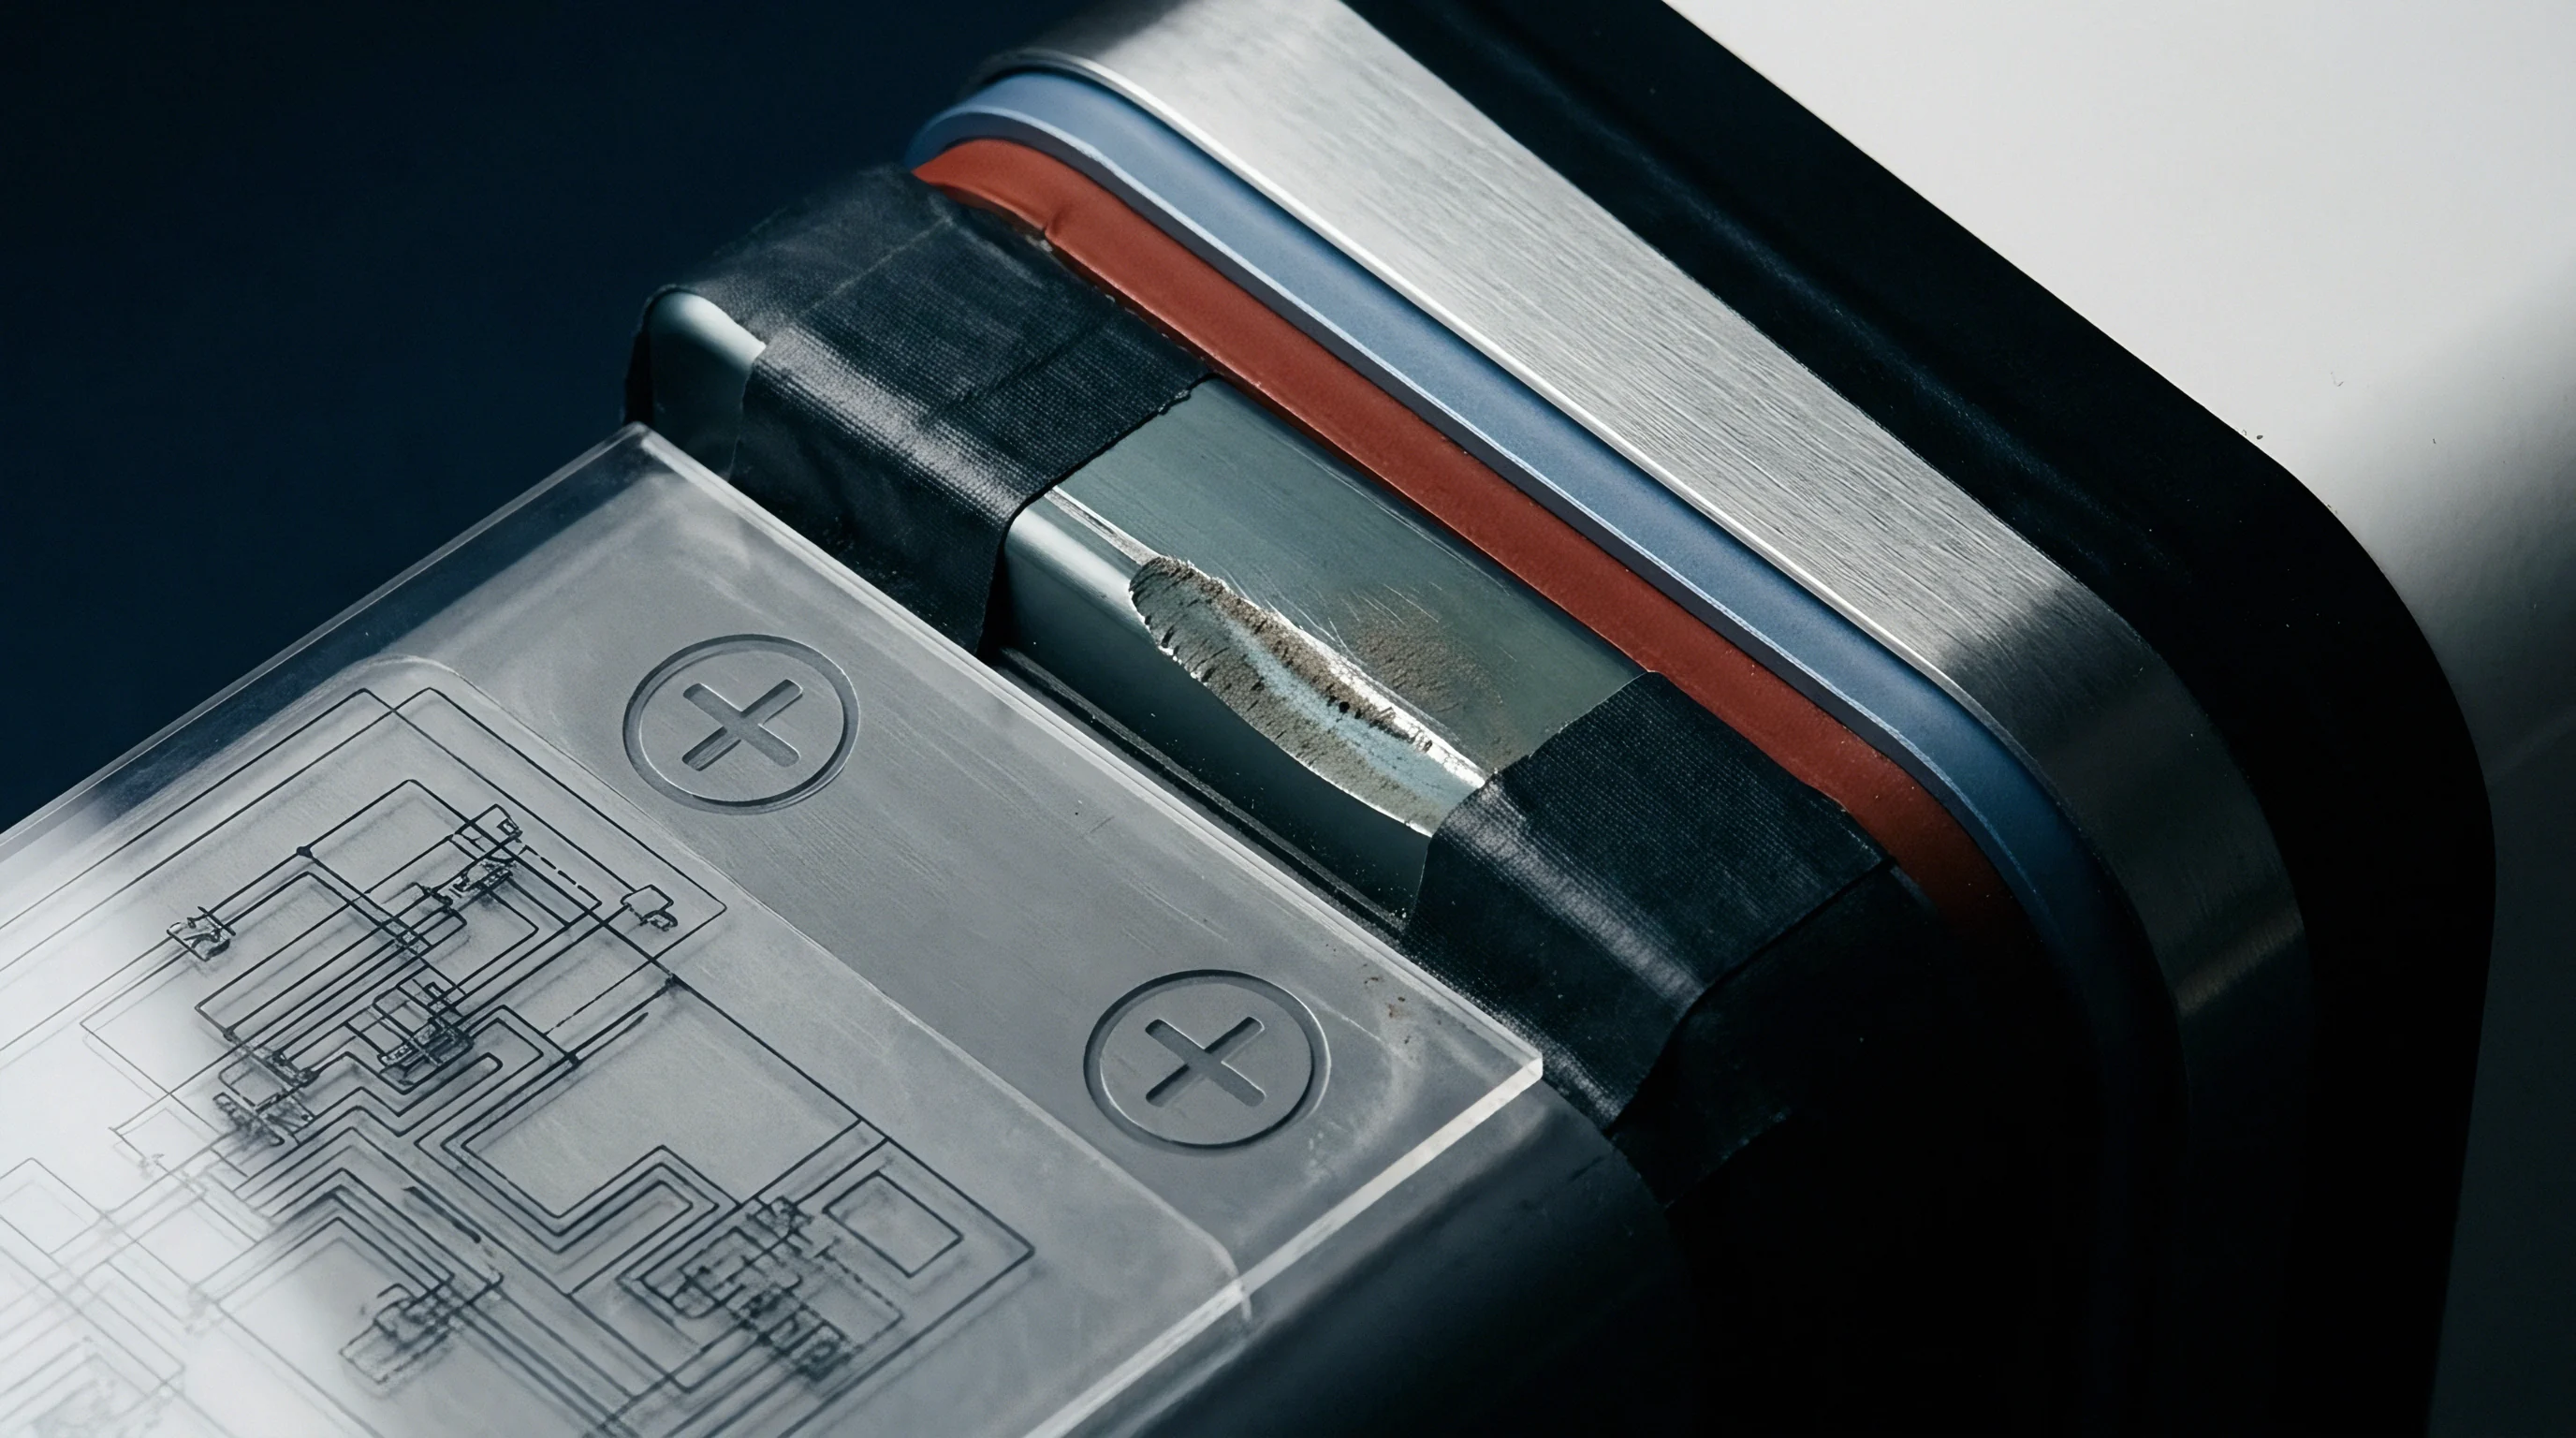
Heat transport inside a prismatic lithium-ion cell is highly directional. Modern prismatic cells house tightly packed, alternating layers of double-side coated current collectors, microporous polymer separators, and organic liquid electrolytes. Heat generated during charge and discharge flows easily along the metallic planes of the aluminum cathode and copper anode substrates.
In-plane thermal conductivity along horizontal and vertical cell dimensions routinely spans 20 to 32 W/m K. Across the stacked layers, through-plane thermal conductivity drops to between 0.55 and 1.15 W/m K, yielding an anisotropy ratio between 20:1 and 40:1 within a single casing.
Heat Transport Vectors across Laminated Stacks
Metallic current collectors dominate in-plane heat transfer. Annealed copper foil maintains a bulk thermal conductivity near 398 W/m K at room temperature, while battery-grade aluminum foil conducts heat at approximately 237 W/m K. Active materials add thermal resistance along these metal planes. Lithium iron phosphate coatings have an intrinsic solid-state thermal conductivity around 1.5 to 2.8 W/m K, whereas nickel manganese cobalt oxide active layers range from 1.2 to 2.1 W/m K depending on nickel stoichiometry and state of charge.
Because active coatings are thin ~ typically 40 to 90 micrometers per side ~ the high conductance of the 6 to 15 micrometer current collector foils provides the primary path for heat to dissipate along the cell’s length and height.
Through-plane conduction meets a chain of thermal resistances in series. Applying Fourier’s law across N repeating unit layers defines effective through-plane conductivity as total thickness divided by the sum of individual layer thermal resistances and interfacial contact resistances:
kz = fracsumi=1N disumi=1N fracdiki + sumj=1N-1 Rint, j
Polyolefin separators, ceramic surface coatings, and organic carbonate liquid electrolytes all have low solid-state thermal conductivities. Dry polyolefin membranes show values between 0.12 and 0.18 W/m K, though liquid electrolyte saturation elevates effective separator conductivity to roughly 0.35 to 0.50 W/m K. In the thickness direction, the composite stack acts essentially as a thermal insulator, driving steep temperature differences between the cell core and external heat sinks.
Laminated prismatic jellyrolls function as efficient thermal conductors along foil planes and effective thermal insulators through the stack thickness.
Pushing for higher volumetric energy density worsens through-plane thermal resistance. Thicker active material coatings lower the ratio of conductive metal foil to active mass. Raising single-side electrode coating weight from 12 mg/cm² to 22 mg/cm² increases cell capacity, but it also extends the through-plane thermal path and adds layer-to-layer contact resistance.
In large-format cells exceeding 100 Ah capacity, this structural anisotropy creates uneven internal temperature fields during high C-rate operation.
Chemical Composition and Tensor Dynamics
Thermal properties vary directly with cathode chemistry and volumetric loading. The table below lists ambient thermal conductivity tensor components and volumetric heat capacities for commercial prismatic cells measured under a standard pre-load compression of 0.3 MPa.
| Chemistry Type | Nominal Capacity (Ah) | In-Plane Conductance k_xy (W/m K) | Through-Plane Conductance k_z (W/m K) | Volumetric Heat Capacity C_v (MJ/m³ K) | Anisotropy Ratio (k_xy / k_z) |
|---|---|---|---|---|---|
| LFP / Graphite | 100 | 28.5 | 0.82 | 2.35 | 34.8 |
| LFP / Graphite | 280 | 31.2 | 0.74 | 2.48 | 42.2 |
| NMC 622 / Graphite | 60 | 24.1 | 0.95 | 2.15 | 25.4 |
| NMC 811 / Silicon-Graphite | 150 | 21.8 | 0.68 | 2.08 | 32.1 |
| LTO / NMC 532 | 40 | 18.4 | 1.12 | 2.62 | 16.4 |
Cell geometry shapes spatial conduction paths. Wide, tall prismatic casings rely on rapid vertical and lateral heat transfer to clear hot spots that form near internal tab connections, where high current densities generate local ohmic heating up to five times greater than the bulk electrochemical heat in the jellyroll. Underestimating through-plane thermal resistance risks unexpected core temperature spikes and localized degradation during fast-charge cycles.
Metrology
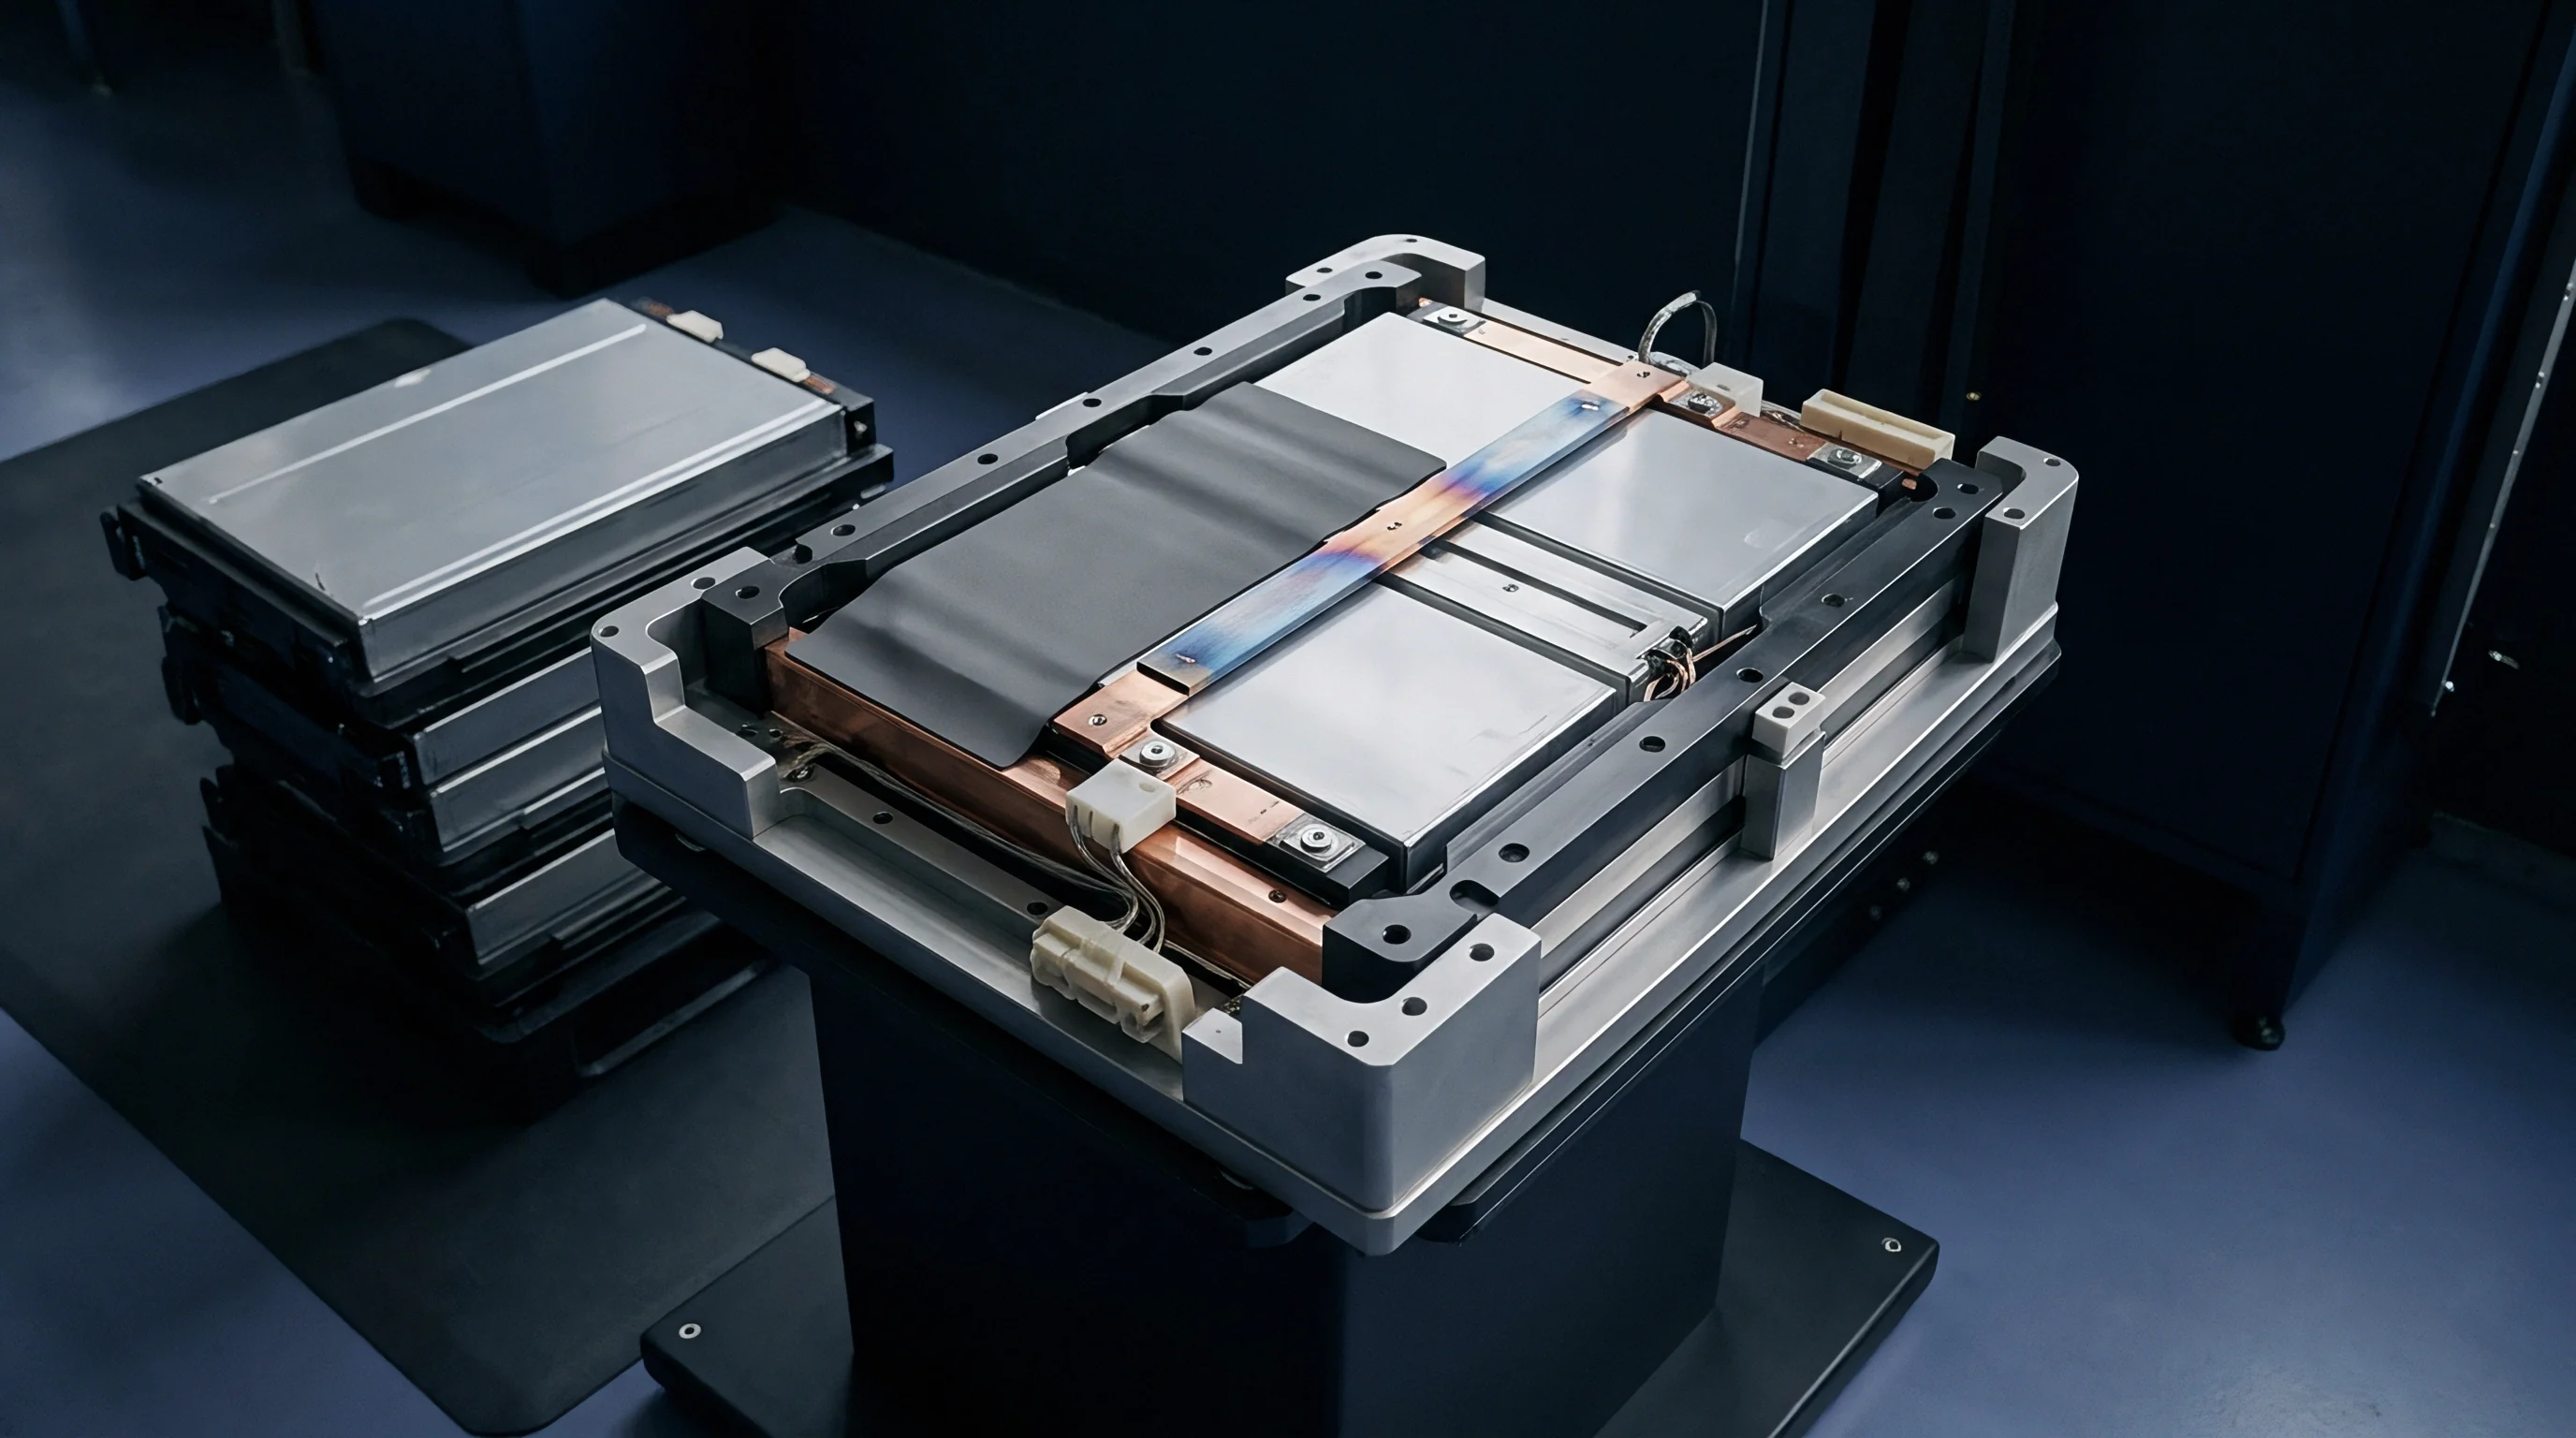
Characterizing spatial thermal conductivity accurately requires techniques that can isolate tensor directionality in non-uniform materials. Standard transient plane source methods and xenon flash analysis present specific optical and thermal calibration hurdles when used on intact commercial cells. Test protocols must strictly control state of charge, ambient temperature, and clamping pressure; fluctuating clamping pressure changes internal contact resistance and skews comparative data.
Transient and Steady-State Characterization Methods
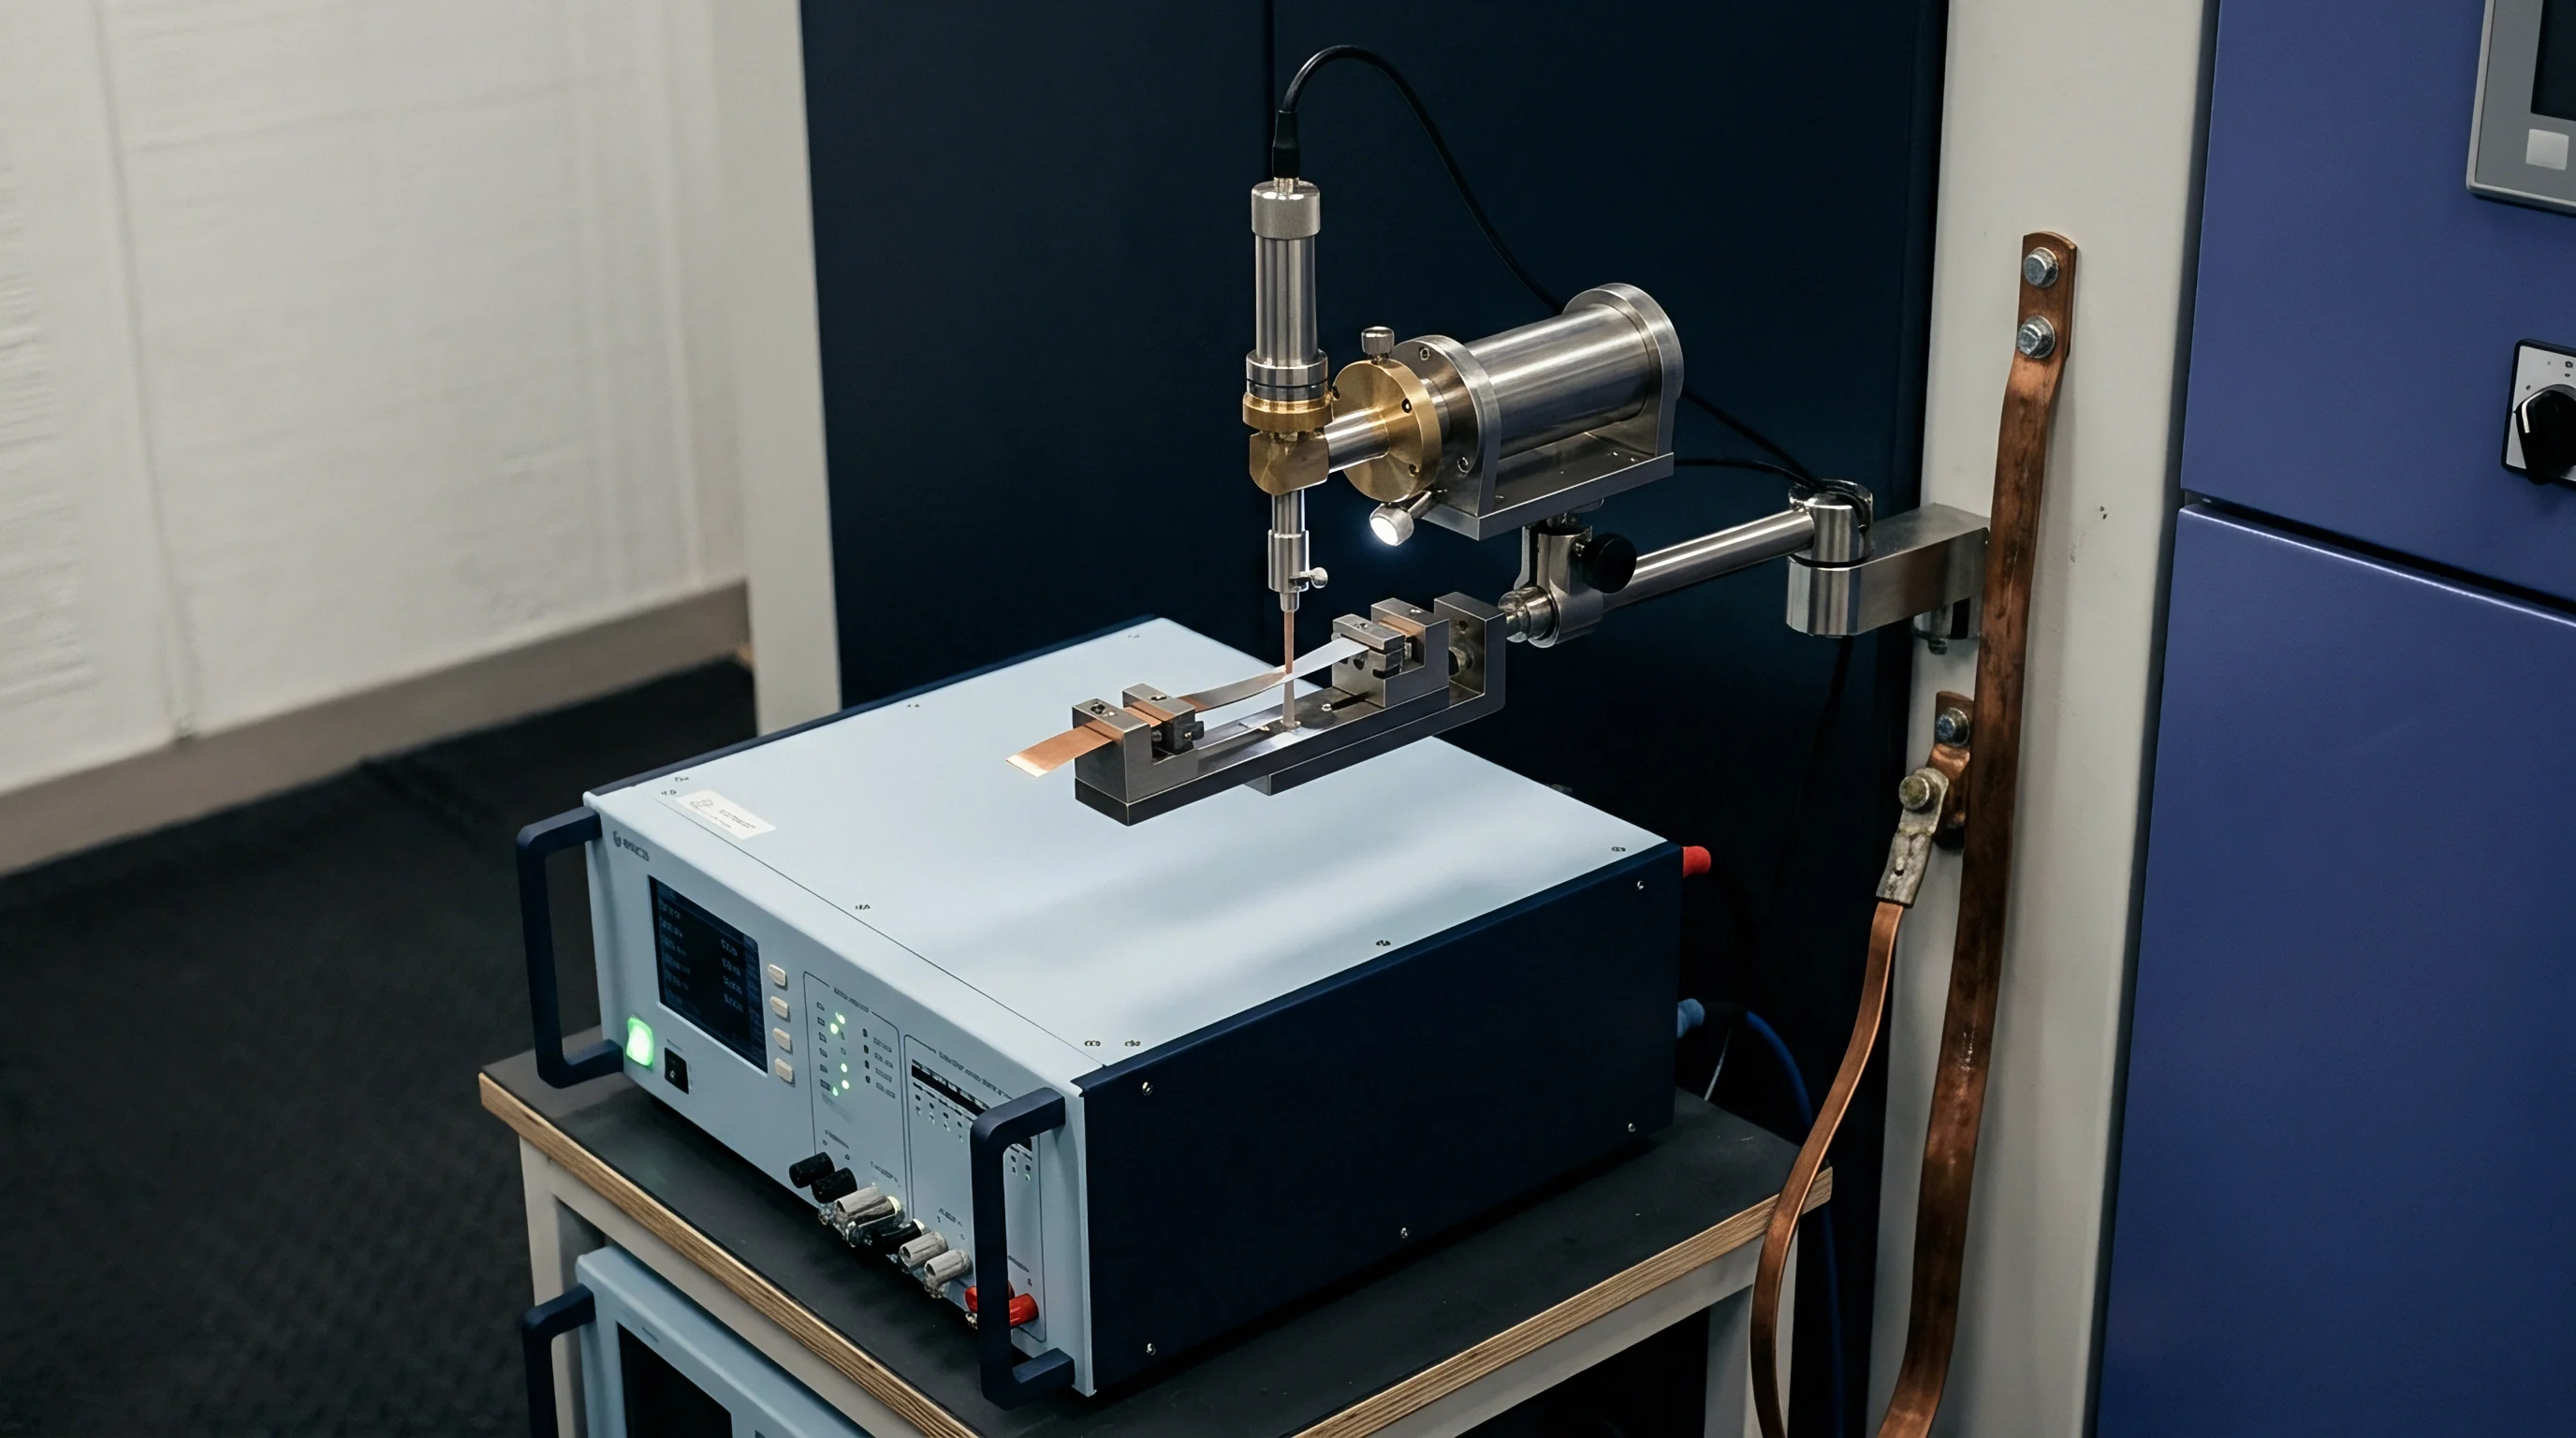
The Transient Plane Source method, defined by ISO 22007-2, uses a nickel double-spiral sensor as both heat source and resistance thermometer. Applying this method to prismatic cells requires anisotropic analytical models. Clamping the sensor between two identical cell specimens allows a single transient measurement to extract radial in-plane conductivity and axial through-plane conductivity at the same time, provided the thermal probing depth stays within the cell’s physical boundaries.
Laser Flash Analysis per ASTM E1461 measures through-plane thermal diffusivity on small samples dissected from unaged cells. The instrument fires a brief light pulse at one face of the specimen and records the temperature rise on the opposite face with an infrared detector. Converting diffusivity to thermal conductivity requires specific heat capacity data from Differential Scanning Calorimetry (ASTM E1269) and accurate bulk density measurements.
Dissecting sealed cells under an inert argon atmosphere is critical to retain liquid electrolyte, as volatile solvent loss distorts both density and diffusivity values.
Steady-state guarded heat flow testing under ASTM E1530 measures through-plane thermal resistance directly. A cell sample is placed under controlled mechanical load between two temperature-regulated plates, and calibrated heat flux transducers calculate thermal resistance from the temperature drop across the thickness. Steady-state testing is particularly effective for isolating interfacial contact resistance under realistic compression loads.
In-plane thermal conductivity in 100Ah LFP prismatic cells reaches 28.5 W/m K along copper foil vectors, whereas through-plane values collapse to 0.85 W/m K under 0.3 MPa compression at 25 degrees Celsius.

Systematic Errors in Characterization Executions
Procedural errors corrupt thermal datasets whenever test boundary conditions depart from actual operating conditions. Obtaining reliable thermal measurements on prismatic cells requires strict adherence to calibration steps that prevent edge heat leaks and sensor decoupling.
- Inadequate mechanical pre-load application lowers measured through-plane conductivity by introducing microscopic air gaps between internal active layers and the casing wall during transient testing.
- Electrolyte evaporation during dissection skews porous separator thermal conductivity toward dry polyolefin values, artificially depressing through-plane figures by over 50 percent.
- Edge heat loss along aluminum casings distorts transient plane source radial calculations by adding unmodeled lateral heat sinks into infinite-medium analytical models.
- Sensor thermal mass mismatch distorts early temperature-rise curves, introducing systematic errors into thin-specimen contact measurements.
- State of charge drift during steady-state heat flux application creates entropic heating or cooling artifacts that contaminate purely conductive heat flow measurements.
Thermal characterization must account for structural variations across the cell profile. Casing edges, gas collection spaces, and terminal tab zones display effective thermal conductivities that differ dramatically from the central active jellyroll. Single isotropic thermal conductivity values published in technical datasheets often reflect dry, unpressurized component calculations rather than dynamic wet cell measurements under compression.

Interface
Internal heat must pass through multiple interfaces before reaching external cold plates. The primary bottleneck inside a prismatic cell lies at the boundary between the outermost jellyroll layer and the inner wall of the aluminum casing. Mechanical contact quality across this boundary governs total internal thermal resistance.

Where Does Through-Plane Resistance Dominate Heat Rejection?
Through-plane thermal impedance governs heat rejection in bottom-cooled battery packs, where heat flows perpendicular to the electrode coatings. Heat generated inside the central stack must cross dozens of polymer and metal interfaces before reaching the outer aluminum shell. Interfacial contact conductance across these solid-solid boundaries depends on surface roughness, layer flatness, and the microscopic contact area produced by clamping pressure.
Liquid electrolyte wetting helps bridge microscopic roughness at layer boundaries. Organic carbonate solvents fill micro-voids to form a fluid bridge with a thermal conductivity around 0.16 to 0.20 W/m K. If electrolyte becomes depleted from extended cycling or incomplete initial wetting, gas bubbles replace liquid in these micro-voids. Air and breakdown gases have thermal conductivities below 0.03 W/m K, forming localized thermal barriers that drive up core operating temperatures.
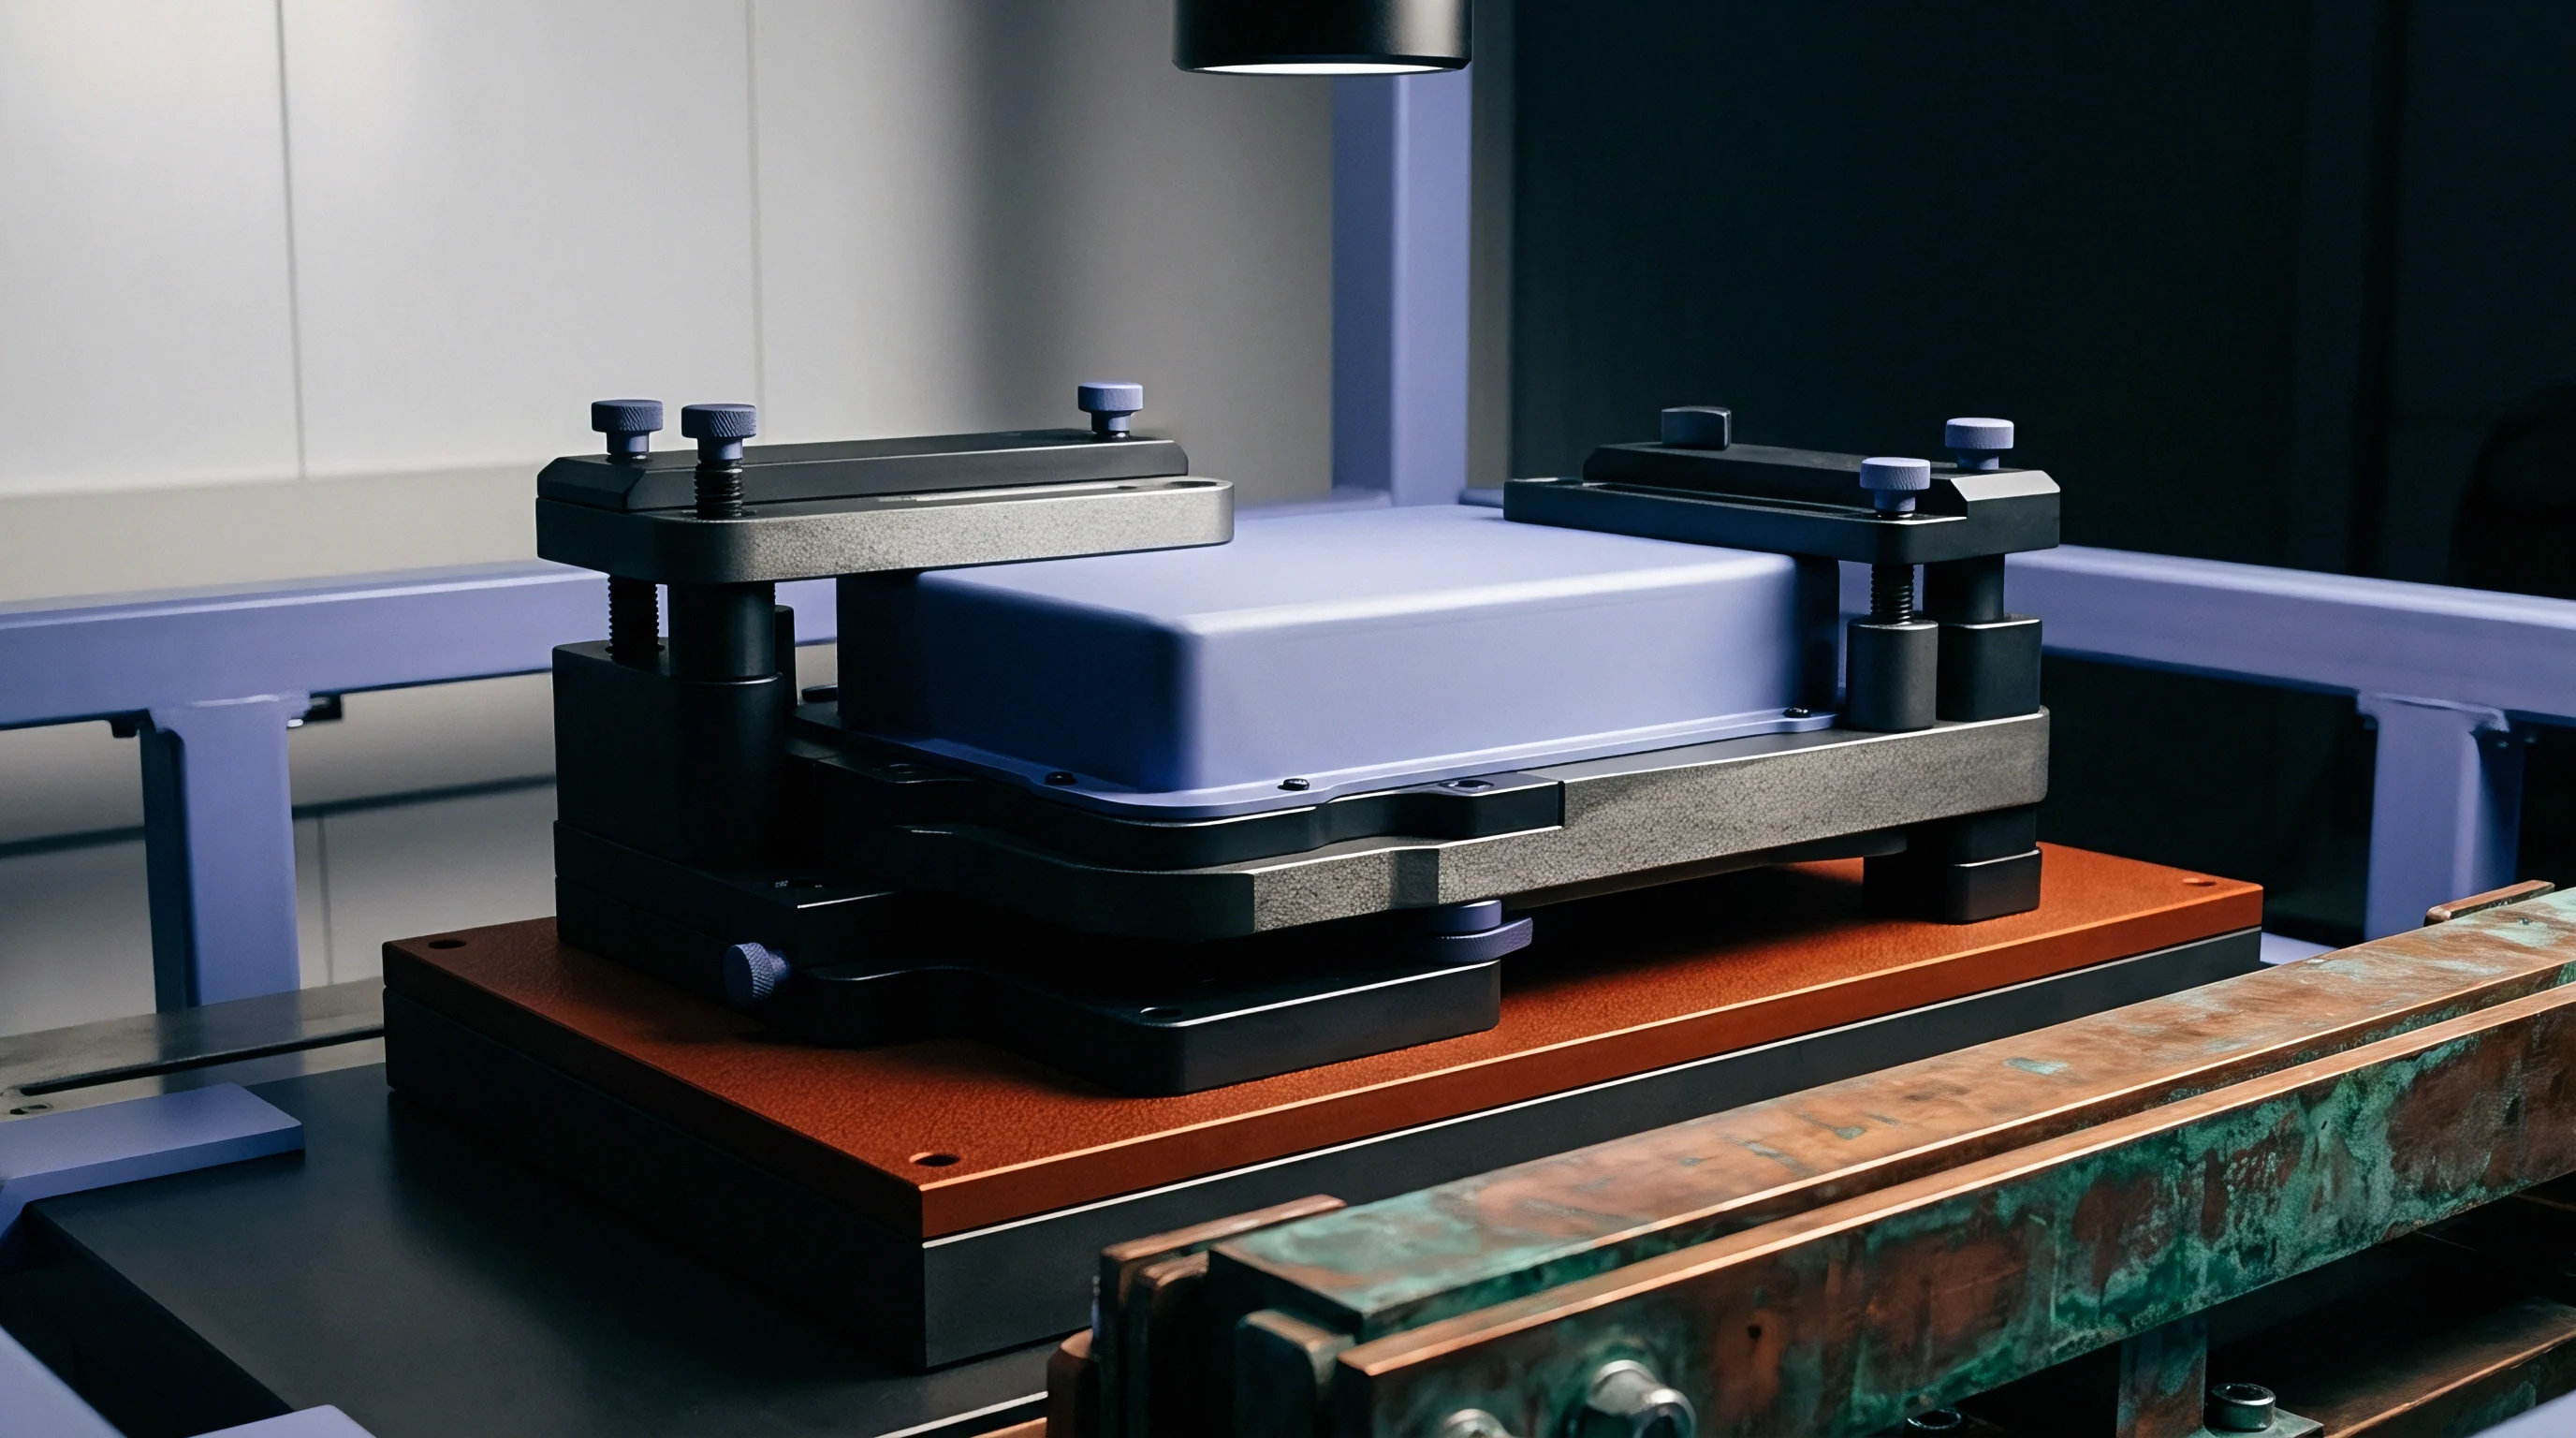
Interfacial thermal resistance inside the cell follows a non-linear relationship with compression. Higher compressive stress closes microscopic gaps, driving thermal resistance down toward a baseline limit set by bulk material properties. The procedure below measures through-plane thermal contact conductance under varying stack compression using a steady-state heat flux meter.
- Prepare a sealed prismatic cell sample inside an insulated environmental chamber set to 25 degrees Celsius.
- Mount calibrated heat flux sensors and high-precision thermocouples on the large primary faces of the casing.
- Apply an initial uniaxial mechanical load of 0.05 MPa perpendicular to the primary face using a hydraulic actuator.
- Establish a steady-state temperature gradient of 10 degrees Celsius between opposing thermal plates in contact with the sensors.
- Record heat flux density and face-to-face temperature differentials once thermal equilibrium stabilizes to within 0.02 degrees per minute.
- Increase mechanical load in steps of 0.2 MPa up to 1.5 MPa, holding at each step to take steady-state measurements.
- Calculate thermal contact conductance for each step by subtracting bulk layer resistances from total measured resistance.
Compression benefits level off once mechanical stress compresses internal porous layers past their linear elastic limits. Exceeding 1.2 MPa yields diminishing returns in through-plane conductance and increases the risk of separator pore closure and localized lithium plating. To maintain thermal contact across the cell’s lifespan without bowing the casing, applied contact pressure must stay above the cell’s internal swelling pressure.

Swell
Prismatic cells undergo continuous dimensional changes over their operating life. Intercalation swelling during charging expands jellyroll thickness and alters internal pressure profiles. This dynamic volumetric expansion changes both through-plane thermal conductivity and interfacial contact resistance as a function of state of charge and cycle aging.
State of Charge and Expansion Micro-Mechanics
Lithium insertion causes graphite anode lattices to expand along the crystallographic c-axis, with graphitic structures swelling up to 10 percent at full lithiation. Inside rigid aluminum casings, this expansion increases physical packing pressure during charge cycles. Higher internal stress compresses the microporous separator, squeezing out fluid volume while increasing solid-to-solid contact area between active material grains and current collectors.
Through-plane thermal conductivity increases alongside state of charge due to this compression effect. For example, a 100Ah LFP prismatic cell with a through-plane conductivity of 0.72 W/m K at 0 percent state of charge rises to 0.88 W/m K at 100 percent state of charge under fixed casing constraints. In-plane thermal conductivity remains nearly constant across state of charge changes, as metal current collectors carry over 90 percent of in-plane heat flux regardless of lithiation state.
Thermal contact conductance across internal electrode interfaces degrades rapidly as gas nucleation separates active material from current collectors.
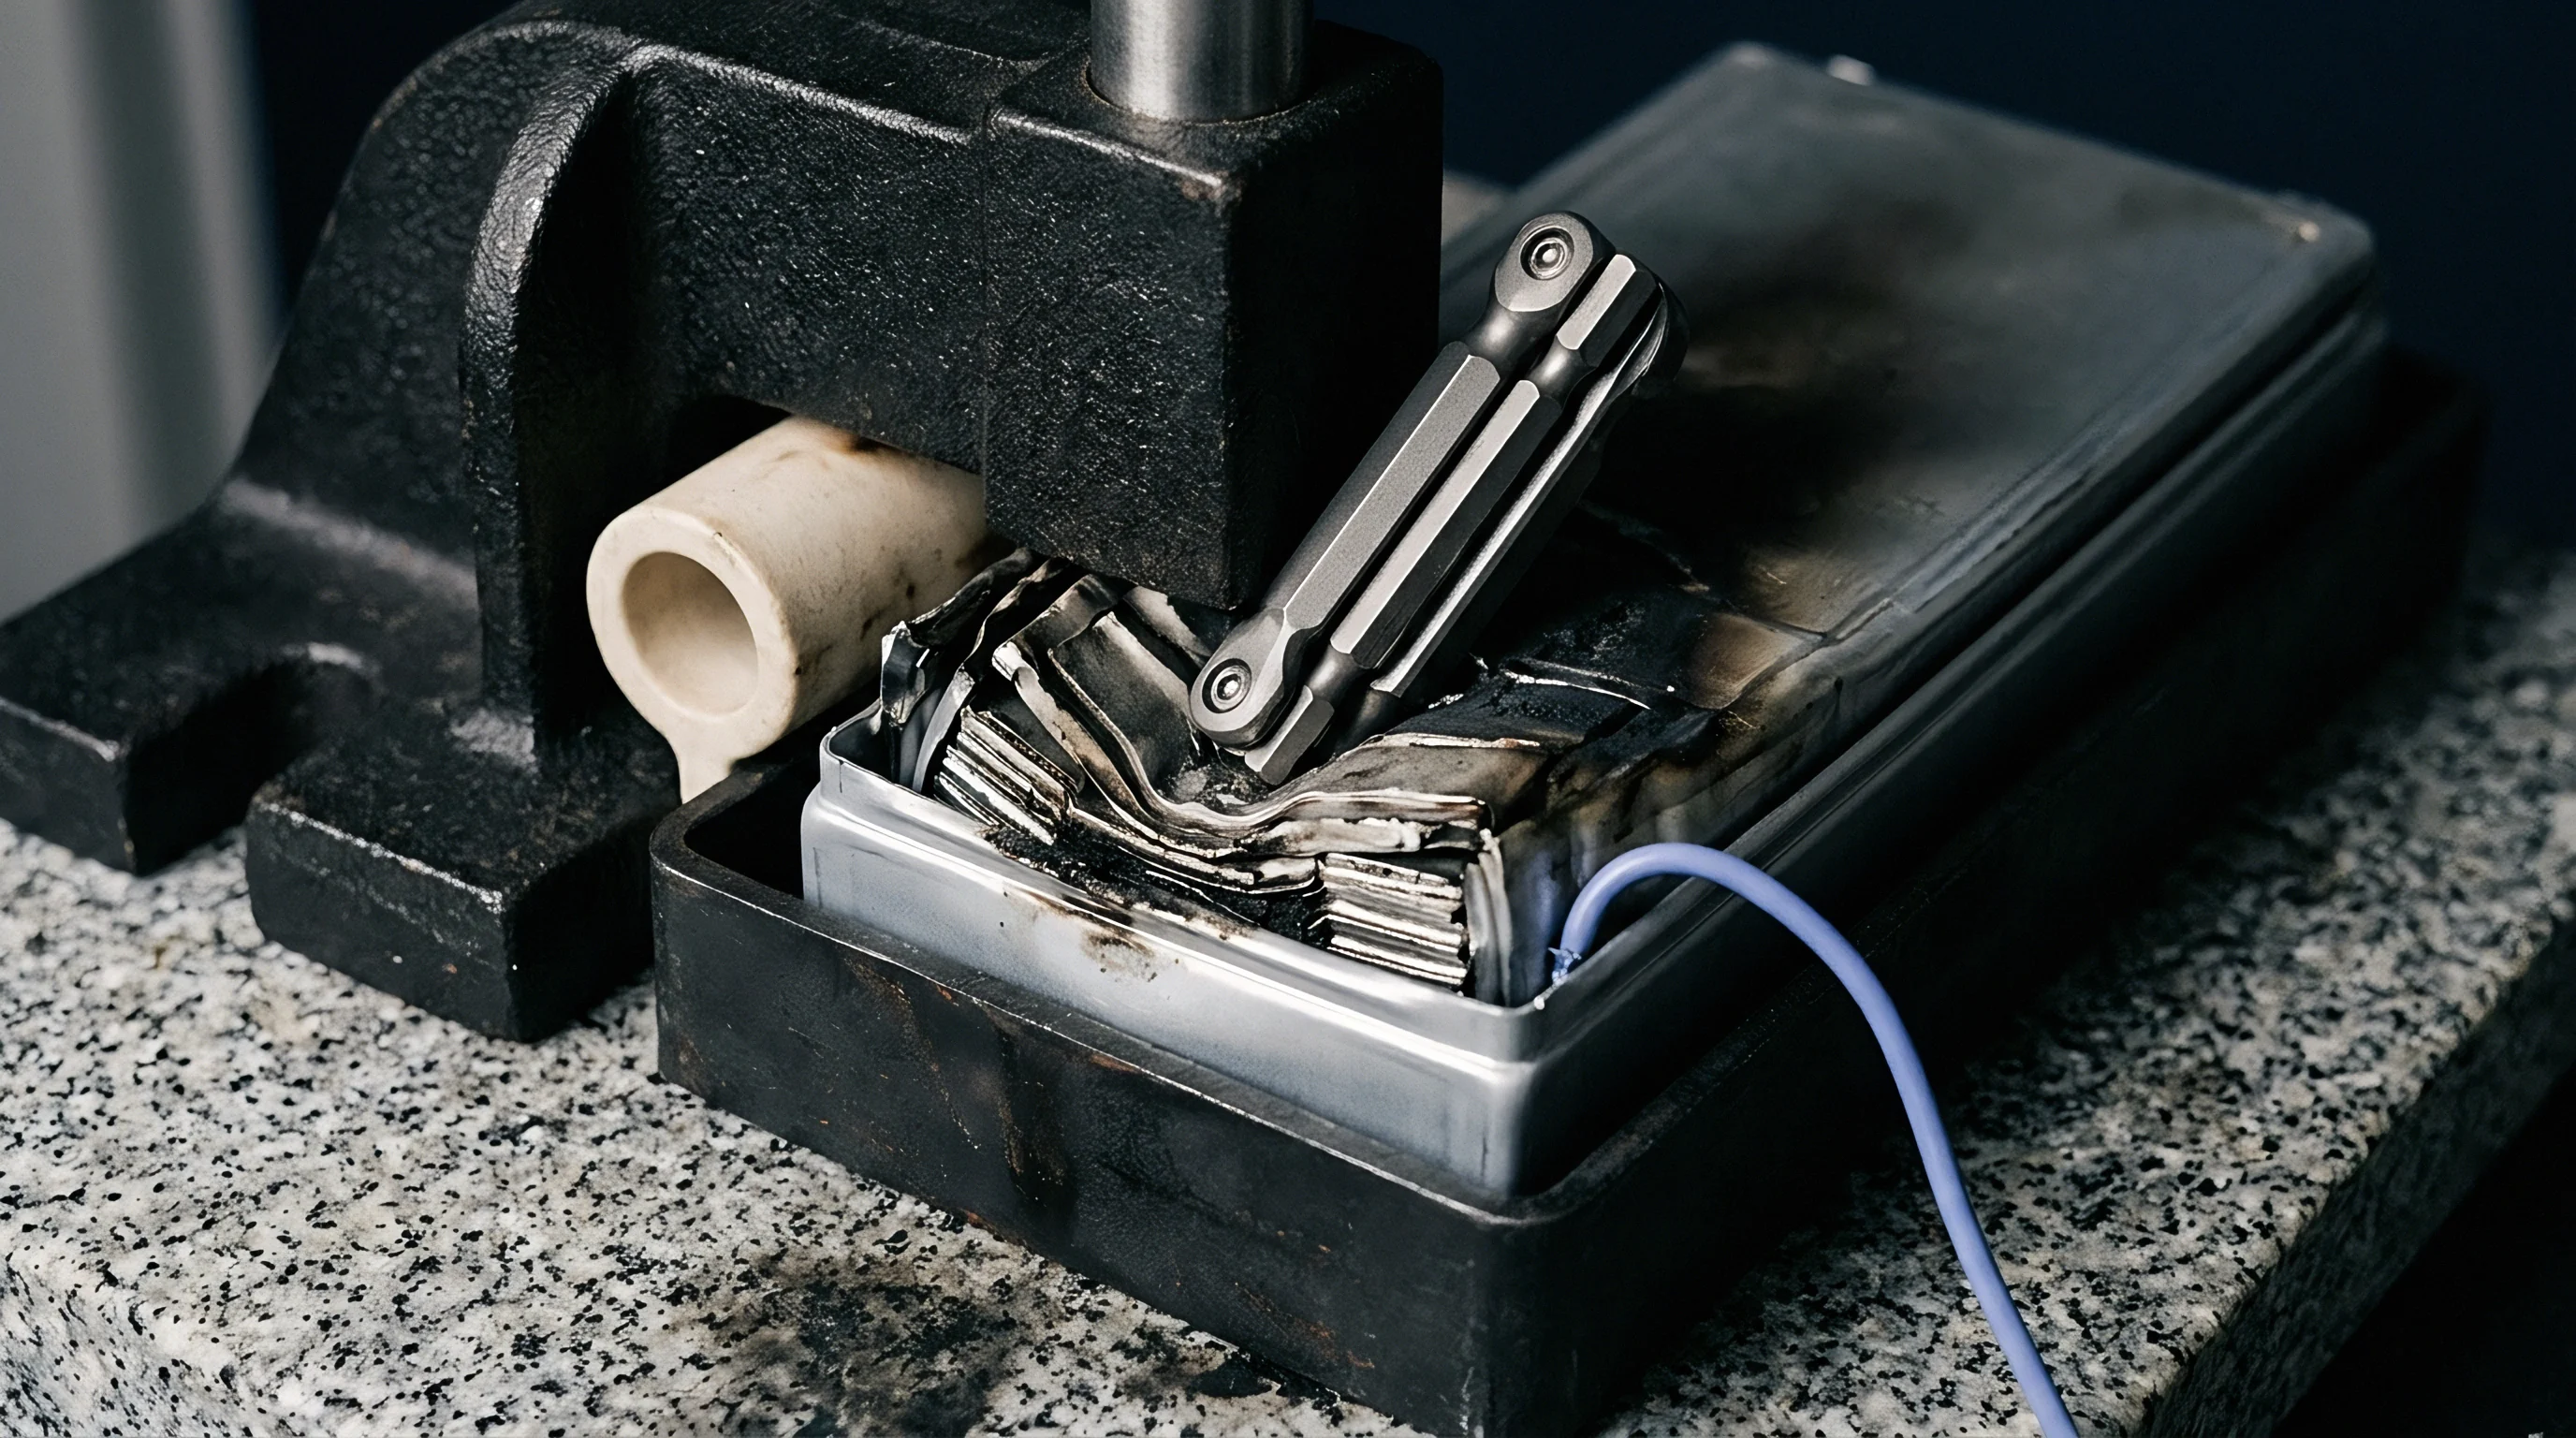
Long-term cycling introduces structural degradation that reverses early-life contact gains. Solid Electrolyte Interphase growth consumes liquid electrolyte and forms a resistive surface layer on graphite particles. Particle cracking, electrode delamination, and localized gas generation create internal voids.
The table below shows spatial thermal conductivity degradation measured at 50 percent state of charge over extended cycle aging under different external compression regimes.
| Equivalent Full Cycles | Capacity Retention (%) | Low Pre-load (0.1 MPa) k_z (W/m K) | Optimal Pre-load (0.5 MPa) k_z (W/m K) | Over-compressed (1.2 MPa) k_z (W/m K) | In-Plane Conductance k_xy (W/m K) |
|---|---|---|---|---|---|
| 0 (Fresh) | 100.0 | 0.78 | 0.86 | 0.89 | 28.2 |
| 500 | 94.2 | 0.71 | 0.83 | 0.84 | 28.1 |
| 1500 | 86.5 | 0.59 | 0.76 | 0.75 | 27.8 |
| 3000 (End of Life) | 78.1 | 0.42 | 0.68 | 0.62 | 27.3 |
Cyclic expansion squeezes electrolyte away from central jellyroll regions toward the casing perimeter. Dry spots form in central active areas, causing local drops in through-plane thermal transport. Aged cells can show local through-plane thermal conductivities up to 40 percent lower than initial datasheet ratings.
Thermal management designs that assume static properties over the cell’s lifespan risk severe core overheating as the battery ages.
Decoupling mechanical degradation from intrinsic material changes requires targeted diagnostic methods, as mechanics and electrochemistry interact tightly inside a sealed casing. Whether localized thermal impedance growth from gas evolution can be non-destructively separated from mechanical stack relaxation remains an active area of investigation.
Dissipation
Integrating prismatic cells into high-voltage battery packs requires matching the cooling architecture to the cell’s heat dissipation vectors. Cold plate placement, thermal interface material selection, and module bracing all depend on the anisotropy ratio of the specific cell format.
Cooling Plate Placement and Module Integration
Bottom cooling is the most common architecture for prismatic modules because of its manufacturing simplicity and volumetric efficiency. Heat generated in the cell core must travel through-plane across half the jellyroll height or length to reach the bottom plate. Because through-plane thermal conductivity is low, bottom cooling creates significant vertical temperature differences (Δ Tcore-base), often exceeding 12 degrees Celsius during continuous 2C discharge rates.
Side cooling along primary casing faces takes advantage of high in-plane conductivity (kxy), provided the internal foil layers connect to the casing walls through thermal ties. If an internal gap or insulator separates the jellyroll from the side walls, heat must still travel through-plane regardless of cooling placement. Tab cooling targets localized heat directly at terminal studs through high-conductance copper busbars.
Combining heat removal across multiple faces helps prevent local thermal aging and capacity imbalances across cell groups.
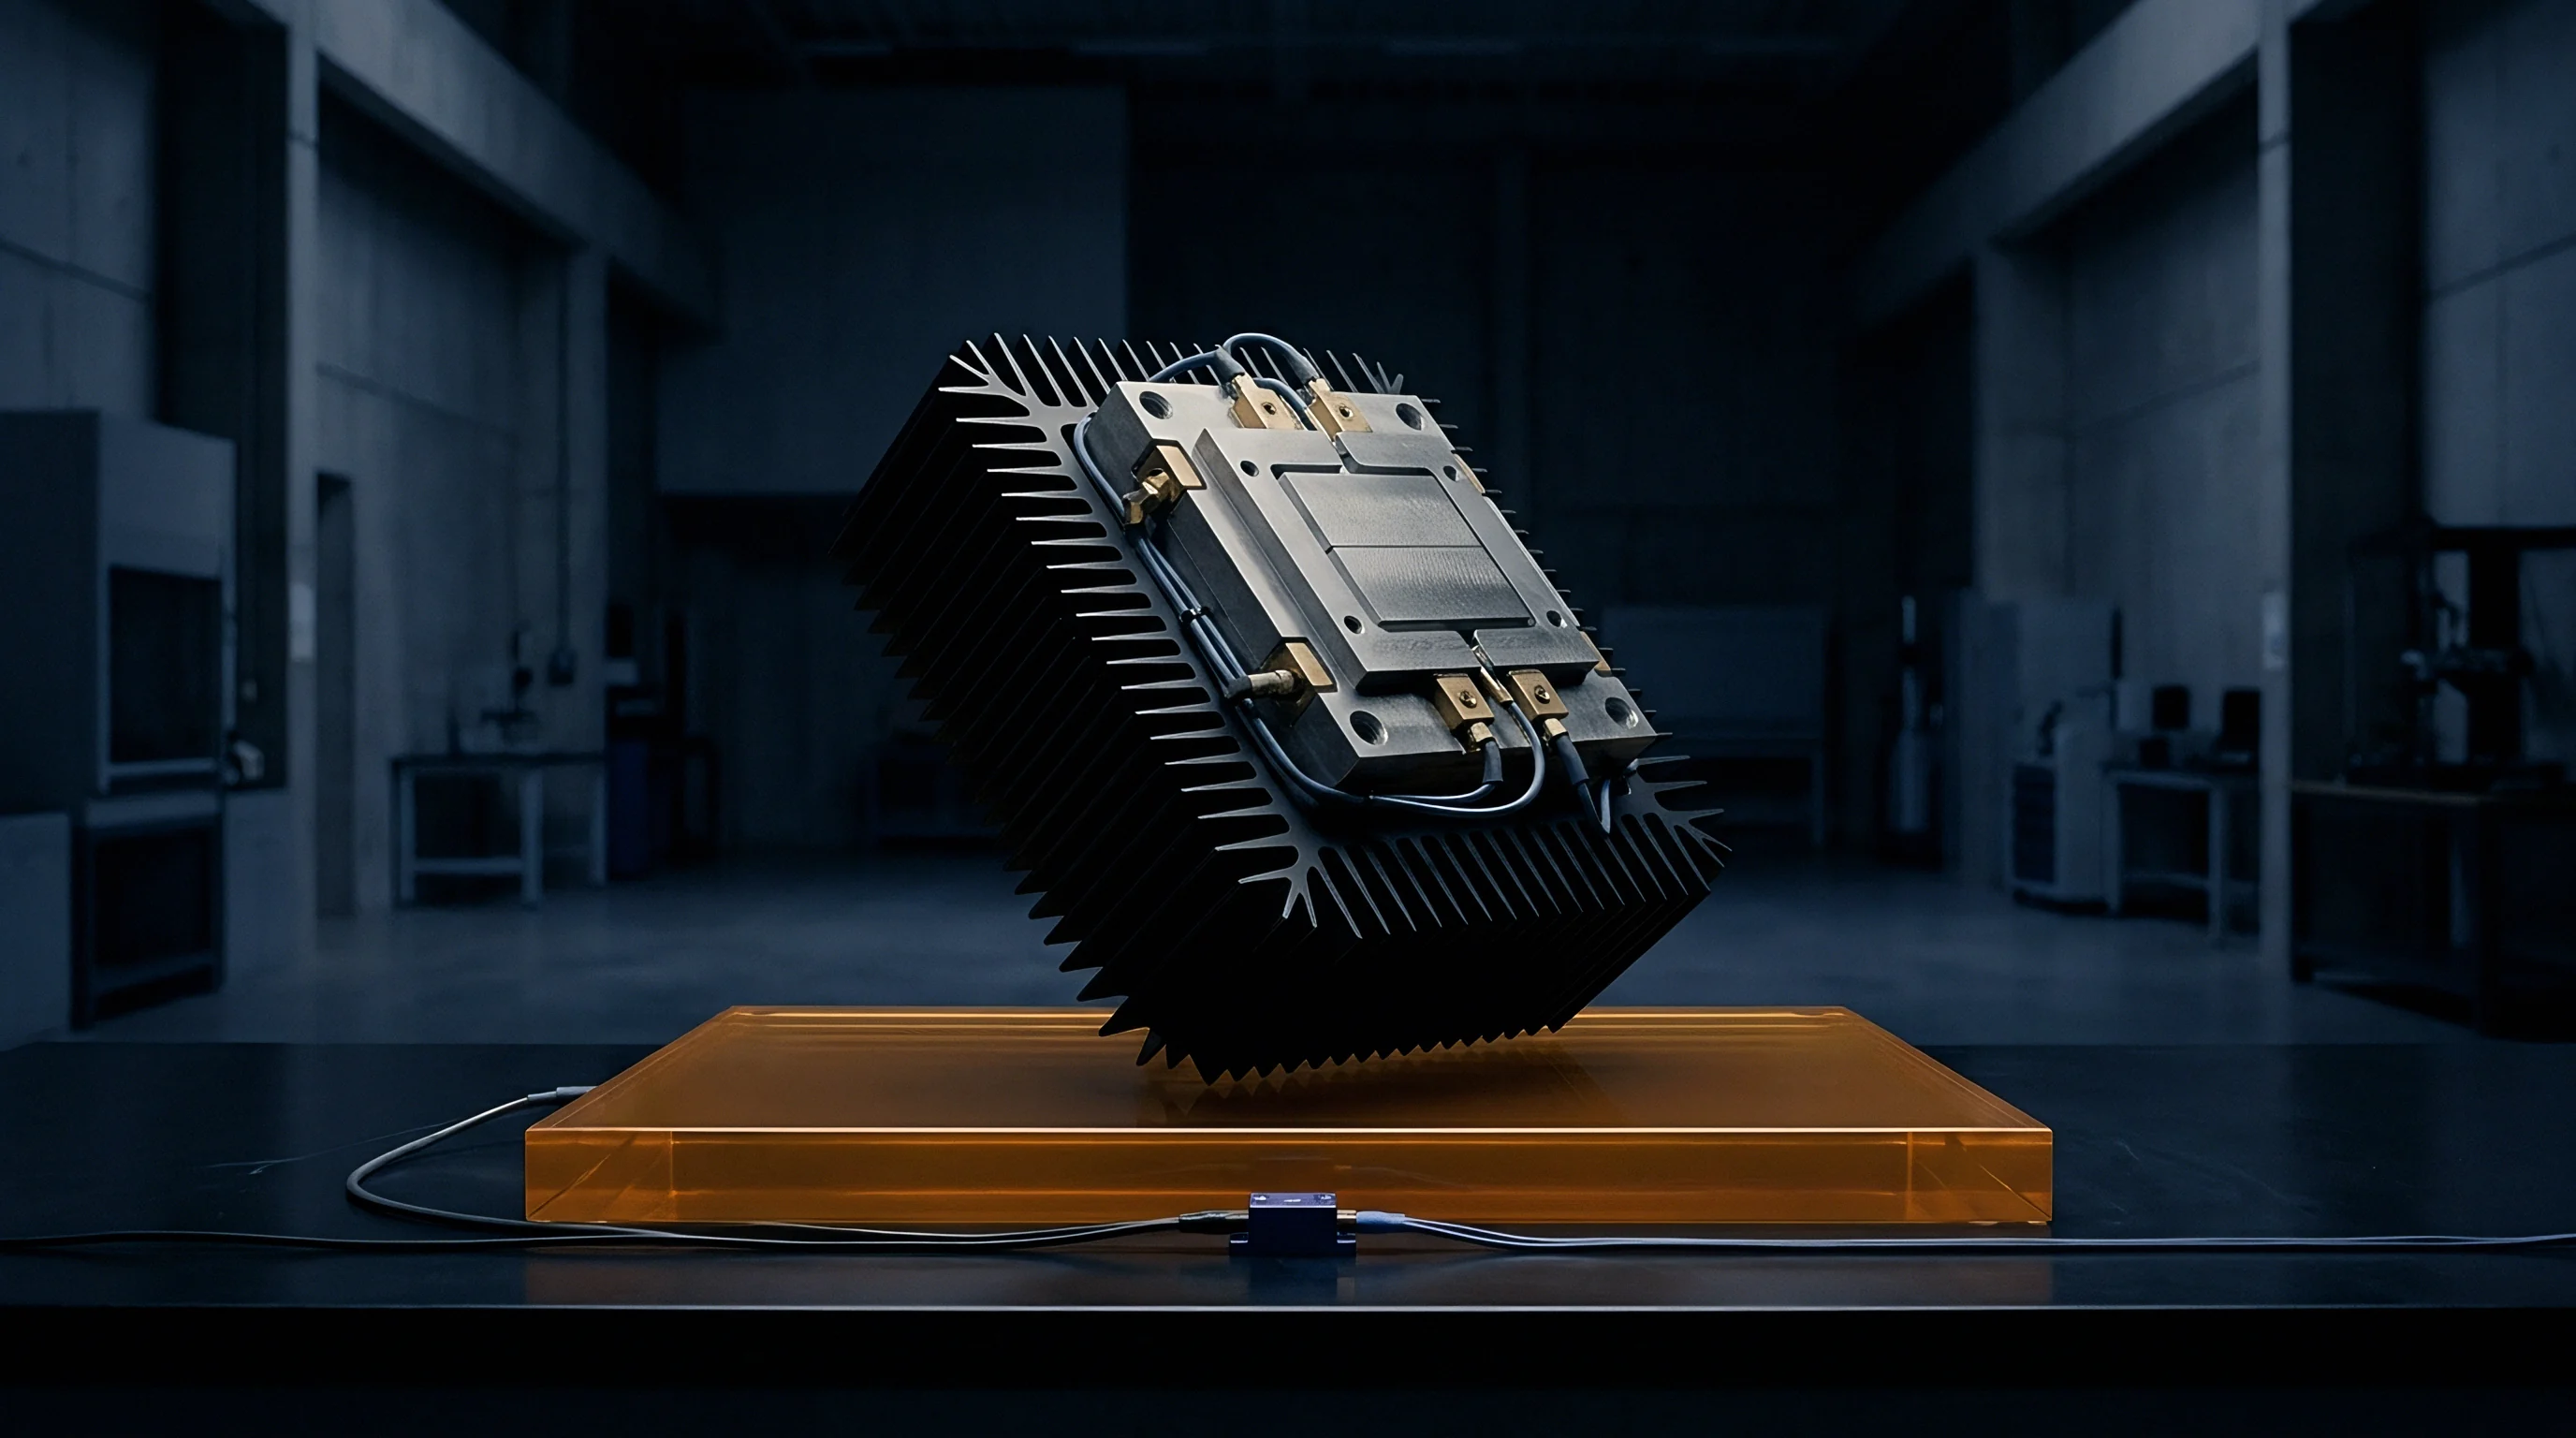
Thermal Interface Materials (TIMs) take up dimensional tolerances between cell casings and cold plates. Performance depends on bond-line thickness, thermal conductivity, and compliance under swelling forces. The table below compares common thermal interface materials used in prismatic pack assembly.
| Material Category | Bulk Conductance (W/m K) | Nominal Gap Thickness (mm) | Thermal Contact Resistance (cm² K/W) | Compressive Stress at 50% Deflection (MPa) |
|---|---|---|---|---|
| Silicone Gap Filler Liquid | 3.5 | 1.0 | 1.8 | 0.15 |
| Non-Silicone Polyurethane Pad | 2.8 | 1.5 | 2.6 | 0.35 |
| Acrylic Thermal Adhesive | 1.8 | 0.3 | 0.8 | 1.10 |
| Phase Change Material Sheet | 5.0 | 0.2 | 0.4 | 0.60 |
Module structures must maintain even compression across thermal interface materials without concentrating load on cell casing corners. Casing distortion can create air pockets at the cold plate interface, sharply increasing thermal resistance.
Specifying cell thermal impedance testing under IEC 62660-3 standard compression bounds heat dissipation guarantees prior to pack thermal management integration.
Procurement and Technical Verification Clauses
Sourcing large prismatic cells without strict thermal verification introduces unmanaged warranty and safety risks. Datasheet thermal figures often reflect ideal, single-component calculations rather than operating conditions. Engineering specifications need to define spatial thermal characterization methods explicitly within procurement contracts.
- Anisotropic Tensor Verification Clause requires certified ISO 22007-2 or ASTM E1530 spatial thermal conductivity datasets covering both kxy and kz vectors.
- State of Charge Matrix Requirement mandates thermal property reporting across 0, 20, 50, 80, and 100 percent state of charge under standard pre-load conditions.
- End-of-Life Thermal Impedance Allowance sets maximum allowable thermal conductivity degradation limits after 2000 standard charge-discharge cycles.
- Pre-load Sensitivity Mapping Standard specifies thermal conductance reporting across a mechanical compression range of 0.05 MPa to 1.0 MPa.
- Batch Thermal Acceptance Sampling establishes lot acceptance criteria using non-destructive thermal impedance measurements during incoming quality control.
Defining spatial thermal limits in supply contracts guards against undisclosed design changes. Swapping separator coatings or thinning copper foil alters thermal behavior even if electrical capacity appears unchanged. Requiring dynamic thermal mapping across 20% to 80% state of charge under nominal preload ensures cooling system sizing remains valid across the product lifespan.


Dossier
A complete qualification dossier ties together electrochemical testing, spatial thermal characterization, and landed cost modeling. Selecting a cell based purely on initial electrical capacity or bill-of-materials cost per kilowatt-hour is risky. A cell with lower through-plane thermal conductivity requires larger cold plates, thicker thermal interface materials, and higher coolant flow rates, cutting into pack energy density and pushing up total system costs.
Worked Thermal-System Cost Sensitivity Analysis
Evaluating the financial impact of thermal performance requires comparing total system costs. Consider two candidate 280Ah LFP prismatic cells evaluated for a 100 kWh stationary storage module, operating at a continuous rating of 0.5C (140 A per cell) in a 1P52S configuration with a maximum internal core limit of 40 degrees Celsius.
Candidate Cell A has an in-plane conductivity kxy of 30 W/m K and a through-plane conductivity kz of 0.85 W/m K at 0.3 MPa preload, priced at 52.00 USD per kWh at the cell level. Candidate Cell B uses a cheaper, high-density separator that lowers through-plane conductivity kz to 0.50 W/m K while maintaining identical dimensions and electrical capacity, priced at 48.50 USD per kWh. Both options assume standard bottom-cooling cold plates.
Calculations set the internal thermal resistance for Candidate Cell A at 0.18 K/W per cell. Under 0.5C operation, heat generation is 12.5 W per cell at nominal resistance. Candidate Cell A produces a core-to-case temperature drop (Δ T = Q · Rth) of 2.25 degrees Celsius, allowing coolant to run at 35.0 degrees Celsius while keeping core temperatures below 38.0 degrees Celsius.
This setup uses a standard 1.0 mm bond line of 2.0 W/m K gap filler costing 1.20 USD per cell.
Candidate Cell B shows a higher internal thermal resistance of 0.31 K/W per cell due to its lower through-plane conductivity. At the same 12.5 W heat generation, the core-to-case temperature drop rises to 3.88 degrees Celsius. To keep core temperatures below 38.0 degrees Celsius, the coolant temperature must be lowered to 32.0 degrees Celsius, requiring a larger chiller that adds 4.50 USD per kWh at the system level.
Alternatively, upgrading to a high-performance 4.0 W/m K gap filler adds 3.80 USD per cell in material costs.
Summing cell cost, thermal interface materials, and cooling hardware reveals the true system economics. Candidate Cell A results in an integrated pack cost of 55.40 USD per kWh. Candidate Cell B ~ despite its 3.50 USD per kWh initial cell discount ~ ends up at 57.10 USD per kWh once accounting for higher-grade interface materials or increased chiller capacity.
The lower-conductivity cell costs an extra 1.70 USD per delivered kWh while generating higher internal temperature gradients that accelerate non-uniform aging.
Incoming Quality Inspection and Qualification Protocols
Verifying thermal performance on incoming cell shipments requires non-destructive inspection. Dissecting production lots destroys valuable inventory, making transient thermal response testing an effective screening method for batch acceptance sampling.
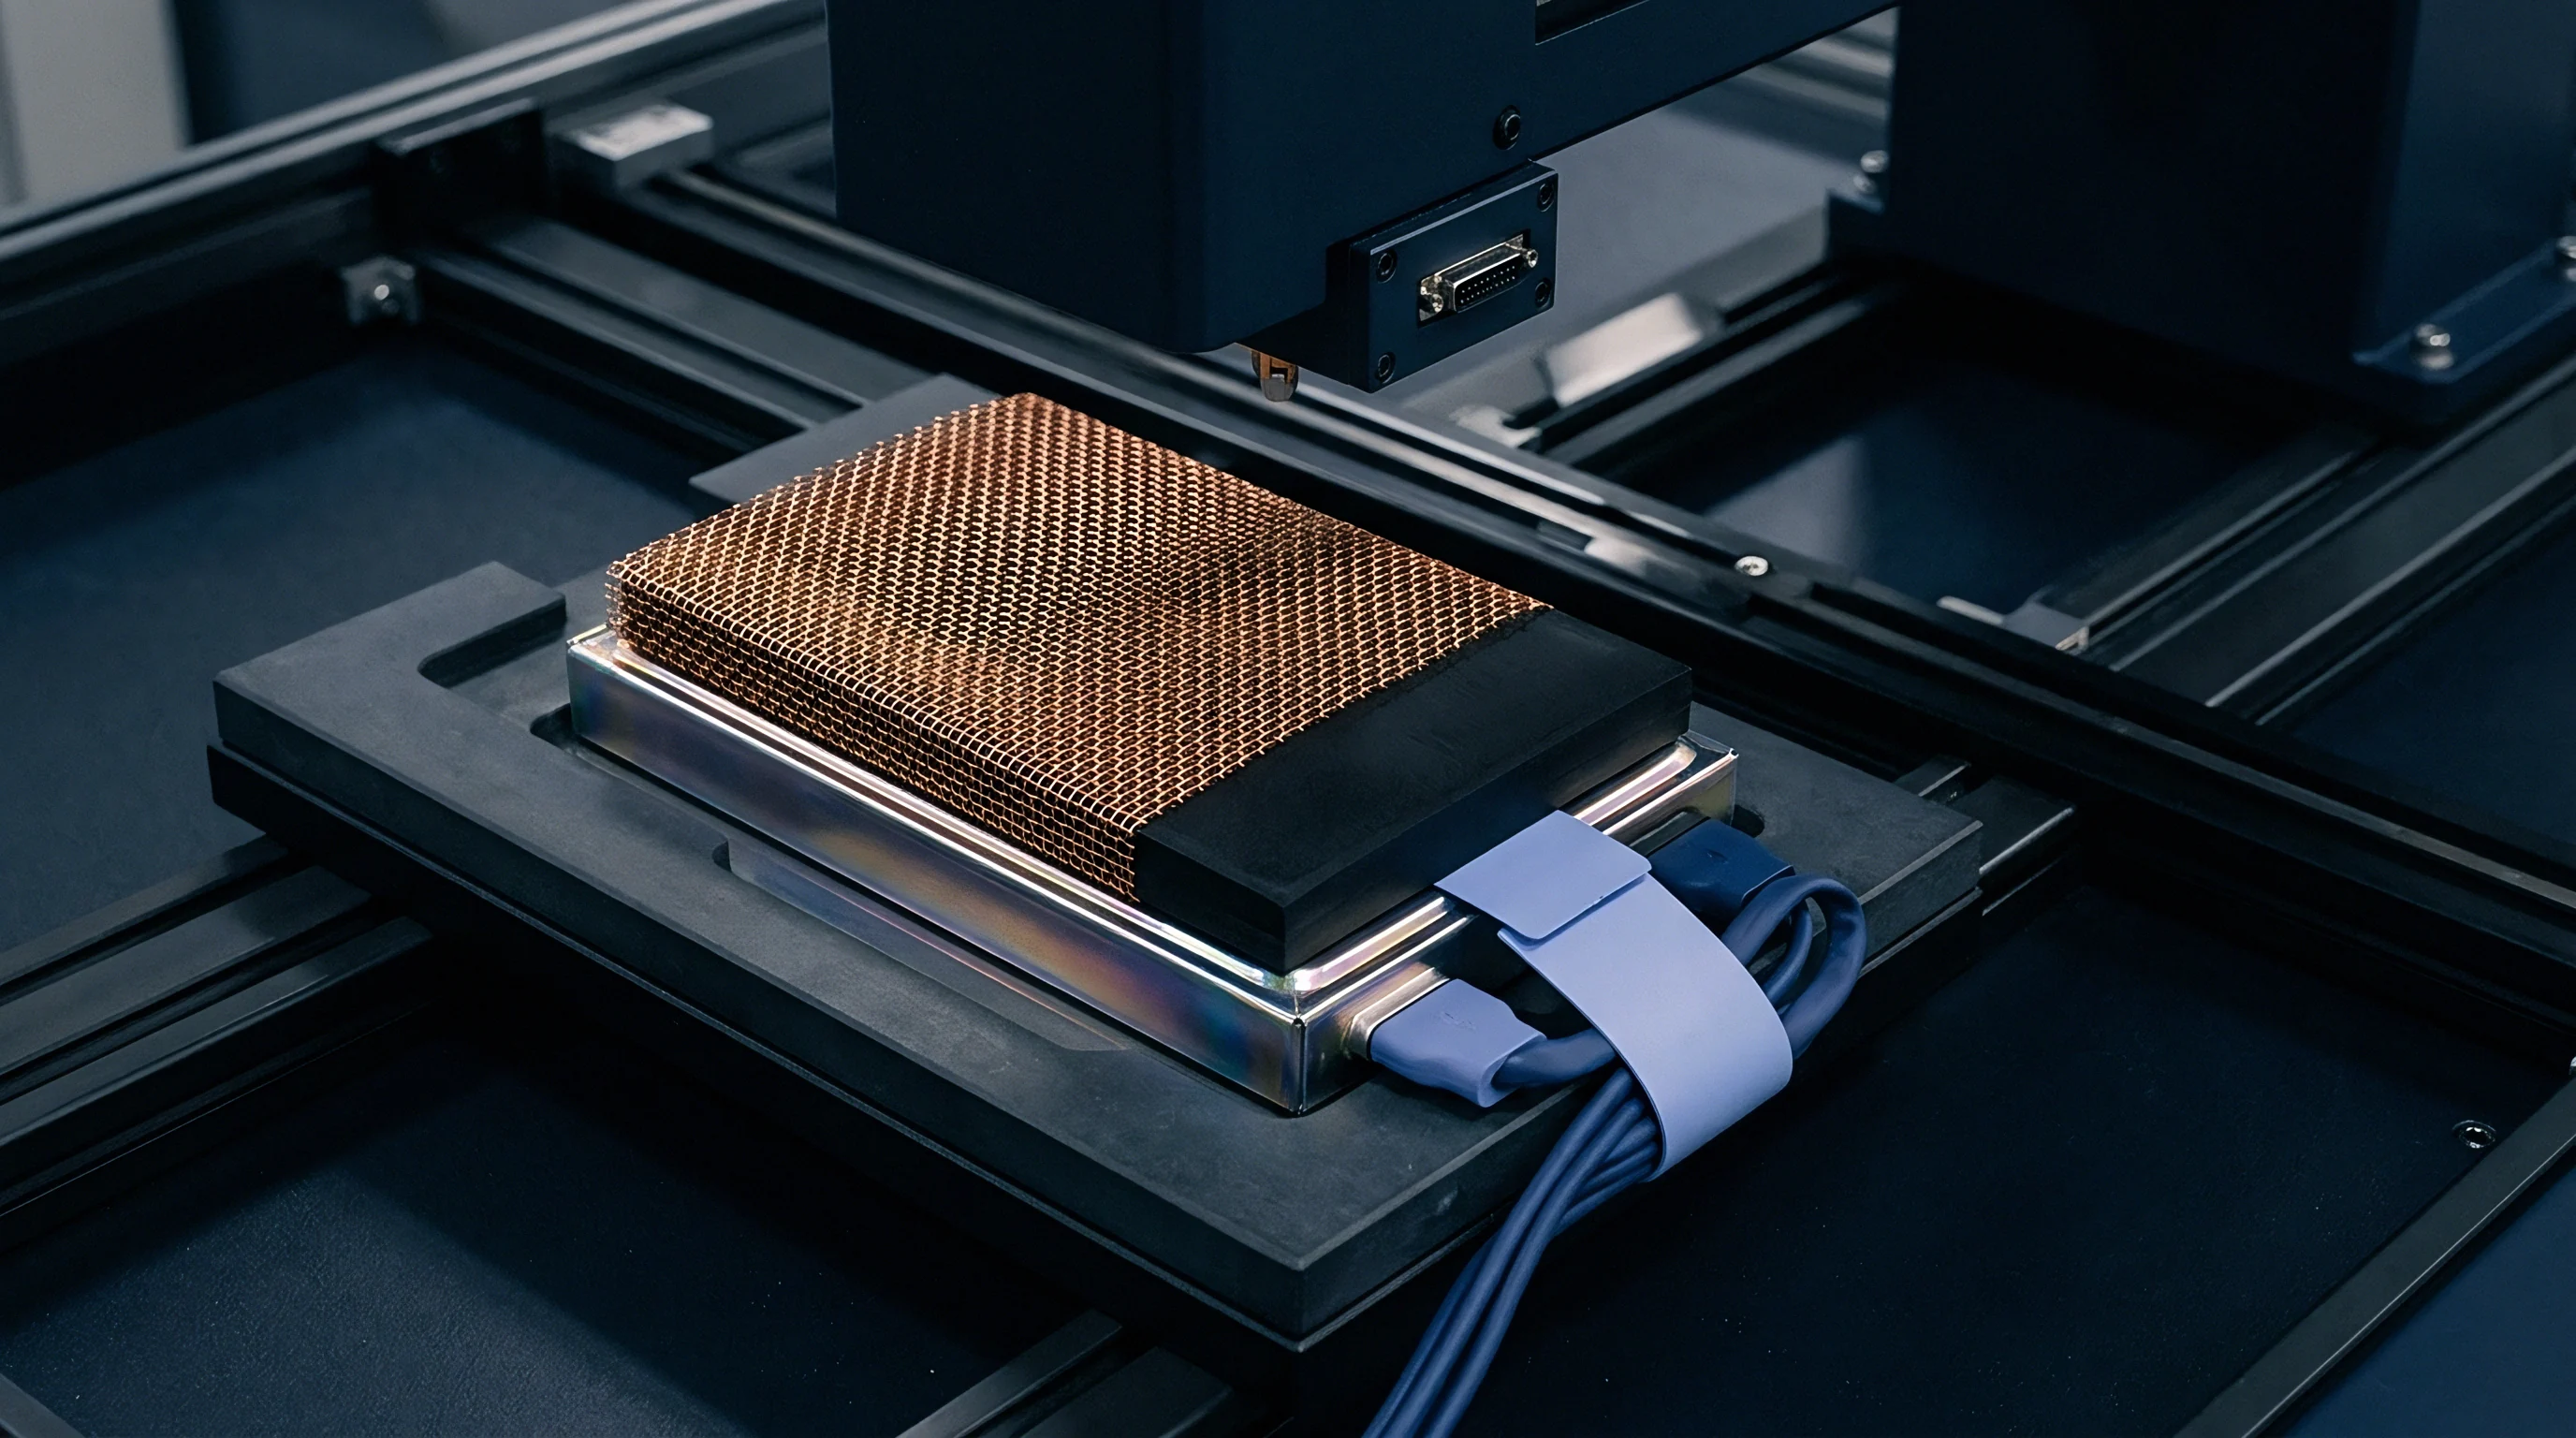
Incoming quality control can use automated thermal contact fixtures to fire precise heat pulses into the cell face and measure the surface temperature response with infrared sensors or thermocouples. Comparing these response curves against baseline qualification data flags internal defects. Structural issues like jellyroll misalignment, local electrolyte dry-out, internal delamination, or housing gaps show up immediately as deviations in the thermal signature.
Lots showing a thermal response variance greater than 8 percent from certified reference dossiers should be quarantined. Non-destructive thermal screening catches internal assembly defects that pass standard AC (1 kHz) and DC electrical resistance checks. Adding thermal metrics to factory acceptance testing ensures that only stable cells enter module assembly, protecting warranty reserves and maintaining long-term cooling performance.