Understanding Four Wire Kelvin Probe Testing for Battery Internal Resistance
Four-wire Kelvin testing eliminates lead and contact resistance errors, enabling precise micro-ohm battery internal resistance measurement for cell grading.
Bridge
Direct current flowing through a metallic conductor creates a potential drop proportional to path resistance. In electrochemical cell testing, standard two-wire ohmmeters introduce errors that easily obscure the true impedance of low-resistance batteries. A 302Ah lithium iron phosphate prismatic cell, for instance, has an internal AC resistance between 0.15 milliohms and 0.25 milliohms.
Yet a standard copper test lead adds 5 milliohms to 50 milliohms per meter, and probe-to-terminal contact interfaces add another 0.5 milliohms to over 20 milliohms of erratic resistance. Connect a two-pole instrument across that cell, and over 95 percent of the measured voltage drop comes from the leads and contacts rather than the battery itself.
Four-wire Kelvin sensing bypasses lead and contact resistance by separating the excitation current path from the voltage measurement circuit. The meter connects two paired or coaxial conductors to each terminal. The force loop (current force positive and negative) drives a known AC or DC signal through the cell.
The sense loop (voltage sense positive and negative) leads directly to an internal voltmeter with input impedance above 10 megohms. Because that input impedance dwarfs any resistance in the sense leads or contacts, current through the sense loop stays near zero. With no current flowing through the sense leads, Ohm’s Law dictates there is no voltage drop across them either, so the voltmeter records only the actual potential drop across the cell terminals.
Electromechanical Isolation of Force and Sense Paths
Excitation signals in automated test systems range from 100 milliamperes to 10 amperes, depending on cell capacity and target resolution. Higher drive currents pull the voltage signal clear of the analog-to-digital converter’s thermal noise floor ~ essential when resolving shifts under 10 microhms. Running high currents through thin leads causes localized Joule heating, altering lead resistance over continuous test runs.
In a four-wire setup, these thermal resistance changes in the force loop slightly alter power supply loading, but they have no effect on sense loop accuracy.
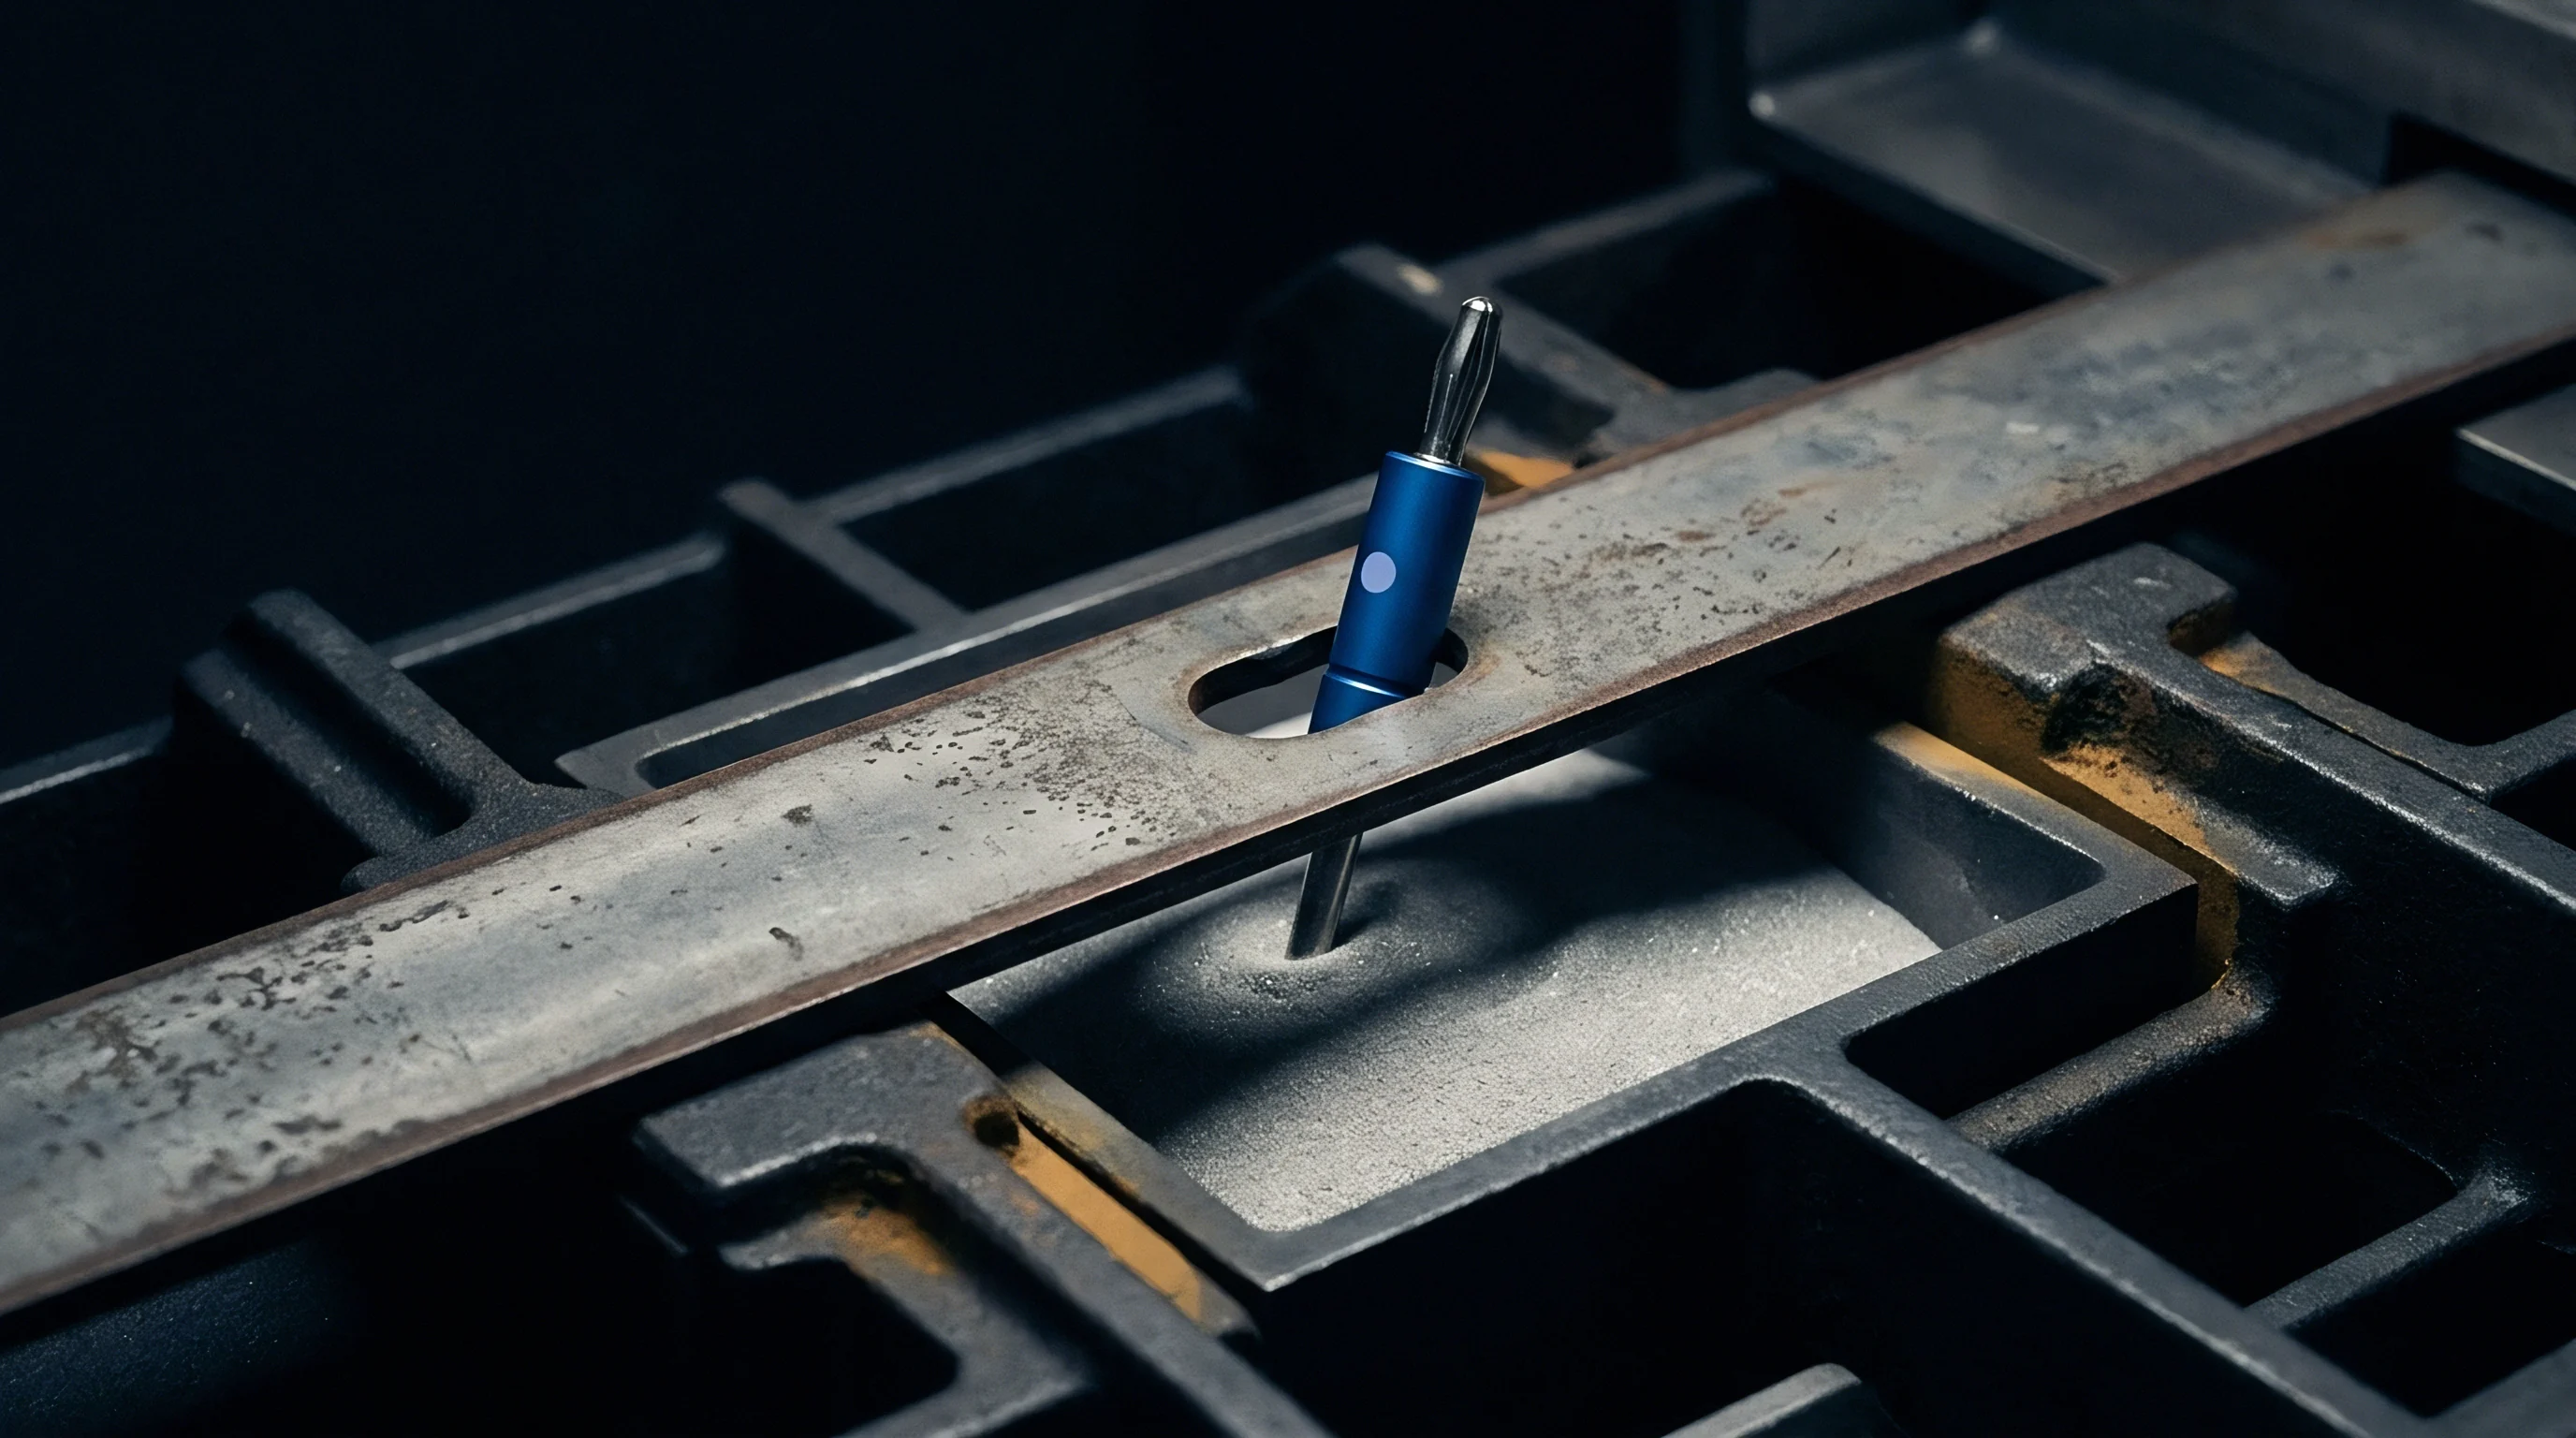
Resolving micro-ohms requires physical separation of force and sense connections all the way to the terminal surface. If the probe tips touch or merge before contacting the cell terminal, the contact resistance of that shared point gets dragged back into the measurement loop. True Kelvin arrangements keep the circuits electrically and physically isolated right down to the surface plane of the cap.
Double spring-loaded pins, coaxial probes, and split-blade clamps maintain this four-point isolation across cylindrical, pouch, and prismatic formats.
Coaxial Kelvin probes operating at 1 kHz AC maintain measurement repeatability within plus or minus 2 microhms when applied to nickel-plated steel cylindrical end caps under a constant vertical contact force of 2.5 Newtons.
Comparing error magnitudes between two-wire and four-wire setups shows why two-wire methods fail in production quality control. Consider a high-capacity lithium-ion cell measured under shifting contact conditions: cell impedance stays constant, but terminal oxidation and probe wear fluctuate across production runs.
| Cell Format & Chemistry | Nominal True AC-IR (mΩ) | Two-Wire Lead & Contact Resistance (mΩ) | Measured Two-Wire Resistance (mΩ) | Four-Wire Sense Lead Error (mΩ) | Measured Four-Wire Resistance (mΩ) | Two-Wire Measurement Error (%) |
|---|---|---|---|---|---|---|
| 18650 NMC (2.5 Ah) | 35.00 | 12.50 | 47.50 | 0.002 | 35.002 | +35.71% |
| 21700 NMC (5.0 Ah) | 13.20 | 8.80 | 22.00 | 0.001 | 13.201 | +66.67% |
| 100Ah LFP Prismatic | 0.45 | 4.50 | 4.95 | 0.0004 | 0.4504 | +1000.00% |
| 302Ah LFP Prismatic | 0.18 | 3.20 | 3.38 | 0.0002 | 0.1802 | +1777.78% |
As cell capacity grows and true internal resistance drops into the sub-milliohm range, two-wire error climbs past 1700 percent. A line trying to sort 302Ah prismatic cells with two-wire fixtures is measuring probe oxidation, not battery health. Four-wire Kelvin setups reduce lead and contact errors by four orders of magnitude, pulling absolute error well under 0.1 percent of true cell impedance.

Parasitic Loop Inductance and Electromagnetic Coupling
AC impedance measurements bring in inductive coupling effects that never show up in pure DC testing. A 1 kHz sinusoidal current in the force loop creates a time-varying magnetic field around the cables. If sense cables run parallel to force lines inside the same harness without shielding or twisting, that magnetic flux cuts across the sense loop.
Faraday’s law dictates that an unwanted voltage gets induced directly into the sense signal, adding a phase error that distorts both the real and imaginary parts of the measured impedance.
Keeping parasitic inductive coupling low requires strict physical cable routing. Twisting force positive with force negative ~ and sense positive with sense negative ~ shrinks the magnetic loop area of each pair. Running the sense pair inside a grounded shield separate from the force pair protects microvolt signals from high-frequency electromagnetic interference.
At 1 kHz, an unshielded 10-centimeter loop between parallel force and sense leads can add 15 microhms of inductive reactance error, throwing off phase-angle calculations during fast screening runs.
Ground loops are another recurring failure point on multi-channel test benches. When channels share a common ground or earth reference, tiny potential differences between channel grounds push stray currents through the voltage sense shields. Those currents corrupt the analog signal path with power line harmonics and switching noise.
Using isolated differential amplifiers on each sense channel breaks these loops, allowing cells in high-voltage series strings to be tested simultaneously without channel crosstalk.
Failing to isolate force and sense return paths inside automated probe heads remains a common flaw in custom battery test fixtures. Designers frequently specify sleek coaxial probe pins, only to solder the outer shield and inner core to a shared PCB trace millimeters behind the holder. That single mistake puts trace resistance and contact resistance right back into the measurement path, defeating the point of an expensive meter.
What specific parasitic inductive coupling limits arise when scaling 1 kHz four-wire Kelvin fixtures to ultra-high-speed automated screening lines operating below 50 milliseconds per cell test cycle?
Spectrum
An electrochemical cell’s internal resistance is not a fixed ohmic number. It is a complex, frequency-dependent impedance reflecting bulk physical resistance, charge-transfer kinetics across interfaces, and solid-state diffusion. Before choosing four-wire Kelvin equipment, engineers need to know whether the application calls for 1 kHz Alternating Current Internal Resistance (AC-IR) or Direct Current Internal Resistance (DC-IR) pulse testing.
The two methods interact with different physical mechanisms inside the cell, producing numbers that can differ by a factor of two to five on the same battery.
Standard AC-IR testing injects a 1 kHz sinusoidal current through the Kelvin force probes. At 1 kHz, the dielectric double-layer capacitance across active material particles acts as a low-impedance bypass. The signal skips past charge-transfer barriers and concentration gradients, capturing almost exclusively the cell’s pure ohmic resistance.
This includes liquid electrolyte ionic conductivity, separator porosity and tortuosity, electrode coating resistance, collector foils, tabs, and terminal welds.
Electrochemical Deconvolution of Resistance Components
DC internal resistance testing uses high-current charge or discharge pulses lasting anywhere from 100 milliseconds to 10 seconds while the Kelvin sense probes record the immediate and delayed voltage drop. A DC step forces charge across the solid-electrolyte interphase (SEI) and electrochemical double layer, engaging charge-transfer reactions at the electrode interface. Because of this, DC-IR reflects total operational resistance under load ~ combining bulk ohmic, charge-transfer, and early concentration polarization effects.
Pushing pulse lengths beyond one second brings solid-state lithium diffusion impedance into play within the active material host lattice ~ the behavior modeled by a Warburg element in equivalent circuits. For high-power applications like electric vehicle acceleration or grid frequency support, DC-IR directly predicts voltage sag and heat generation under load. For incoming quality checks, cell sorting, and weld inspection on factory lines, 1 kHz AC-IR gives a 20-millisecond reading that quickly flags tab weld flaws, dry electrolyte fills, or metallic contamination.
Mapping these response regimes onto an Electrochemical Impedance Spectroscopy (EIS) Nyquist plot helps visualize where each measurement fits. The real-axis intercept at high frequencies marks pure ohmic resistance (RΩ). The semicircle at high-to-medium frequencies reflects SEI layer resistance (Rsei) and charge-transfer resistance (Rct) in parallel with double-layer capacitance (Cdl).
The low-frequency tail represents Warburg diffusion (Zw).
| Test Spectrum & Method | Frequency / Duration | Dominant Electrochemical Mechanism Captured | Typical Value (280Ah LFP) | Typical Value (5Ah 21700 NMC) | Primary Industrial Application |
|---|---|---|---|---|---|
| Ultra-High AC-IR | 10 kHz | Inductive loop behavior, terminal geometry, tab foil stacking | 0.22 mΩ | 16.5 mΩ | High-frequency switching ripple analysis |
| Standard AC-IR (IEC 61960) | 1 kHz ± 10% | Pure bulk ohmic resistance (RΩ), electrolyte conductivity, tab welds | 0.18 mΩ | 12.8 mΩ | Factory cell grading, incoming sorting, tab weld QA |
| Short-Pulse DC-IR | 100 ms pulse | Ohmic resistance plus initial SEI breakdown and double-layer charging | 0.28 mΩ | 18.2 mΩ | Fast pulse power capability rating |
| Standard DC-IR (ISO 12405) | 10 s pulse | Bulk ohmic (RΩ) + Charge-transfer (Rct) + Diffusion (Zw) | 0.52 mΩ | 31.5 mΩ | EV acceleration modeling, pack thermal calculation |
| Extended DC-IR (IEC 62660) | 30 s pulse | Total cell impedance including full concentration polarization gradient | 0.74 mΩ | 42.0 mΩ | BMS software SOC/SOH state estimation models |
Understanding these differences prevents expensive misunderstandings between cell vendors and pack integrators. A datasheet reading 0.18 milliohms for 1 kHz AC-IR is accurate for that test condition. But if an integrator uses that 0.18 milliohm value to project voltage drop during a 10-second, 300-ampere discharge pulse, the real voltage drop will be roughly three times larger because charge-transfer and mass-transport resistances were left out of the calculation.

Systematic Errors in High-Frequency Resistance Testing
Getting reliable micro-ohm readings on high-speed test stations requires tight control over signal phase angles, electrical noise, and high-frequency current paths.
- Harmonic Line Interference occurs when 50 Hz or 60 Hz line noise couples into voltage sense preamps, modulating the 1 kHz carrier wave and driving display jitter above 5 microhms.
- Phase-Angle Demodulation Drift happens when cable capacitance shifts the phase of the sense signal against the force reference, turning reactive impedance into fake ohmic resistance readings.
- Thermal Voltage Offsets form at dissimilar metal joints along the harness, introducing microvolt DC biases that distort short-pulse DC-IR calculation algorithms.
- Non-Linear Contact Rectification occurs when oxidized terminal surfaces act like tiny Schottky diodes, distorting sine waves into harmonics that confuse phase-sensitive lock-in amplifiers.
Correcting phase error requires regular auto-zeroing and phase calibration against non-inductive precision shunts. Standard wire-wound resistors have too much parasitic inductance for 1 kHz calibration; only flat metal foil or coaxial manganin shunts stay purely resistive across 100 Hz to 10 kHz.
Relying solely on 1 kHz AC-IR for incoming screening misses cathode degradation and binder breakdown that show up only under DC charge-transfer conditions.


Penetration
The contact point between four-wire probe tips and battery terminals is the most sensitive mechanical junction in the test circuit. Terminal metallurgy varies considerably by format and chemistry: cylindrical cells use nickel-plated steel caps and cans; prismatics use solid aluminum positive terminals and copper or nickel-clad copper negatives; pouch cells use copper anode tabs and aluminum cathode tabs. Every combination forms oxide films, passivation layers, or surface contamination that must be broken mechanically to achieve true low-resistance metal-to-metal contact.
Spring-loaded pogo pins feature internal stainless steel springs driving beryllium copper (BeCu) or tungsten carbide cores plated with hard gold or rhodium over nickel. Gold keeps base contact resistance low and prevents oxidation, but thin gold layers wear off quickly in high-speed automated fixtures. Once that gold wears through, the exposed nickel underplate oxidizes fast, causing contact resistance to jump from 1 milliohm to over 50 milliohms in a few hundred cycles.
High-volume lines require thick hard gold (at least 1.25 microns) or pure rhodium engineered for over 250,000 insertions before replacement.
How Does Pin Tip Geometry Penetrate Surface Oxide Layers?
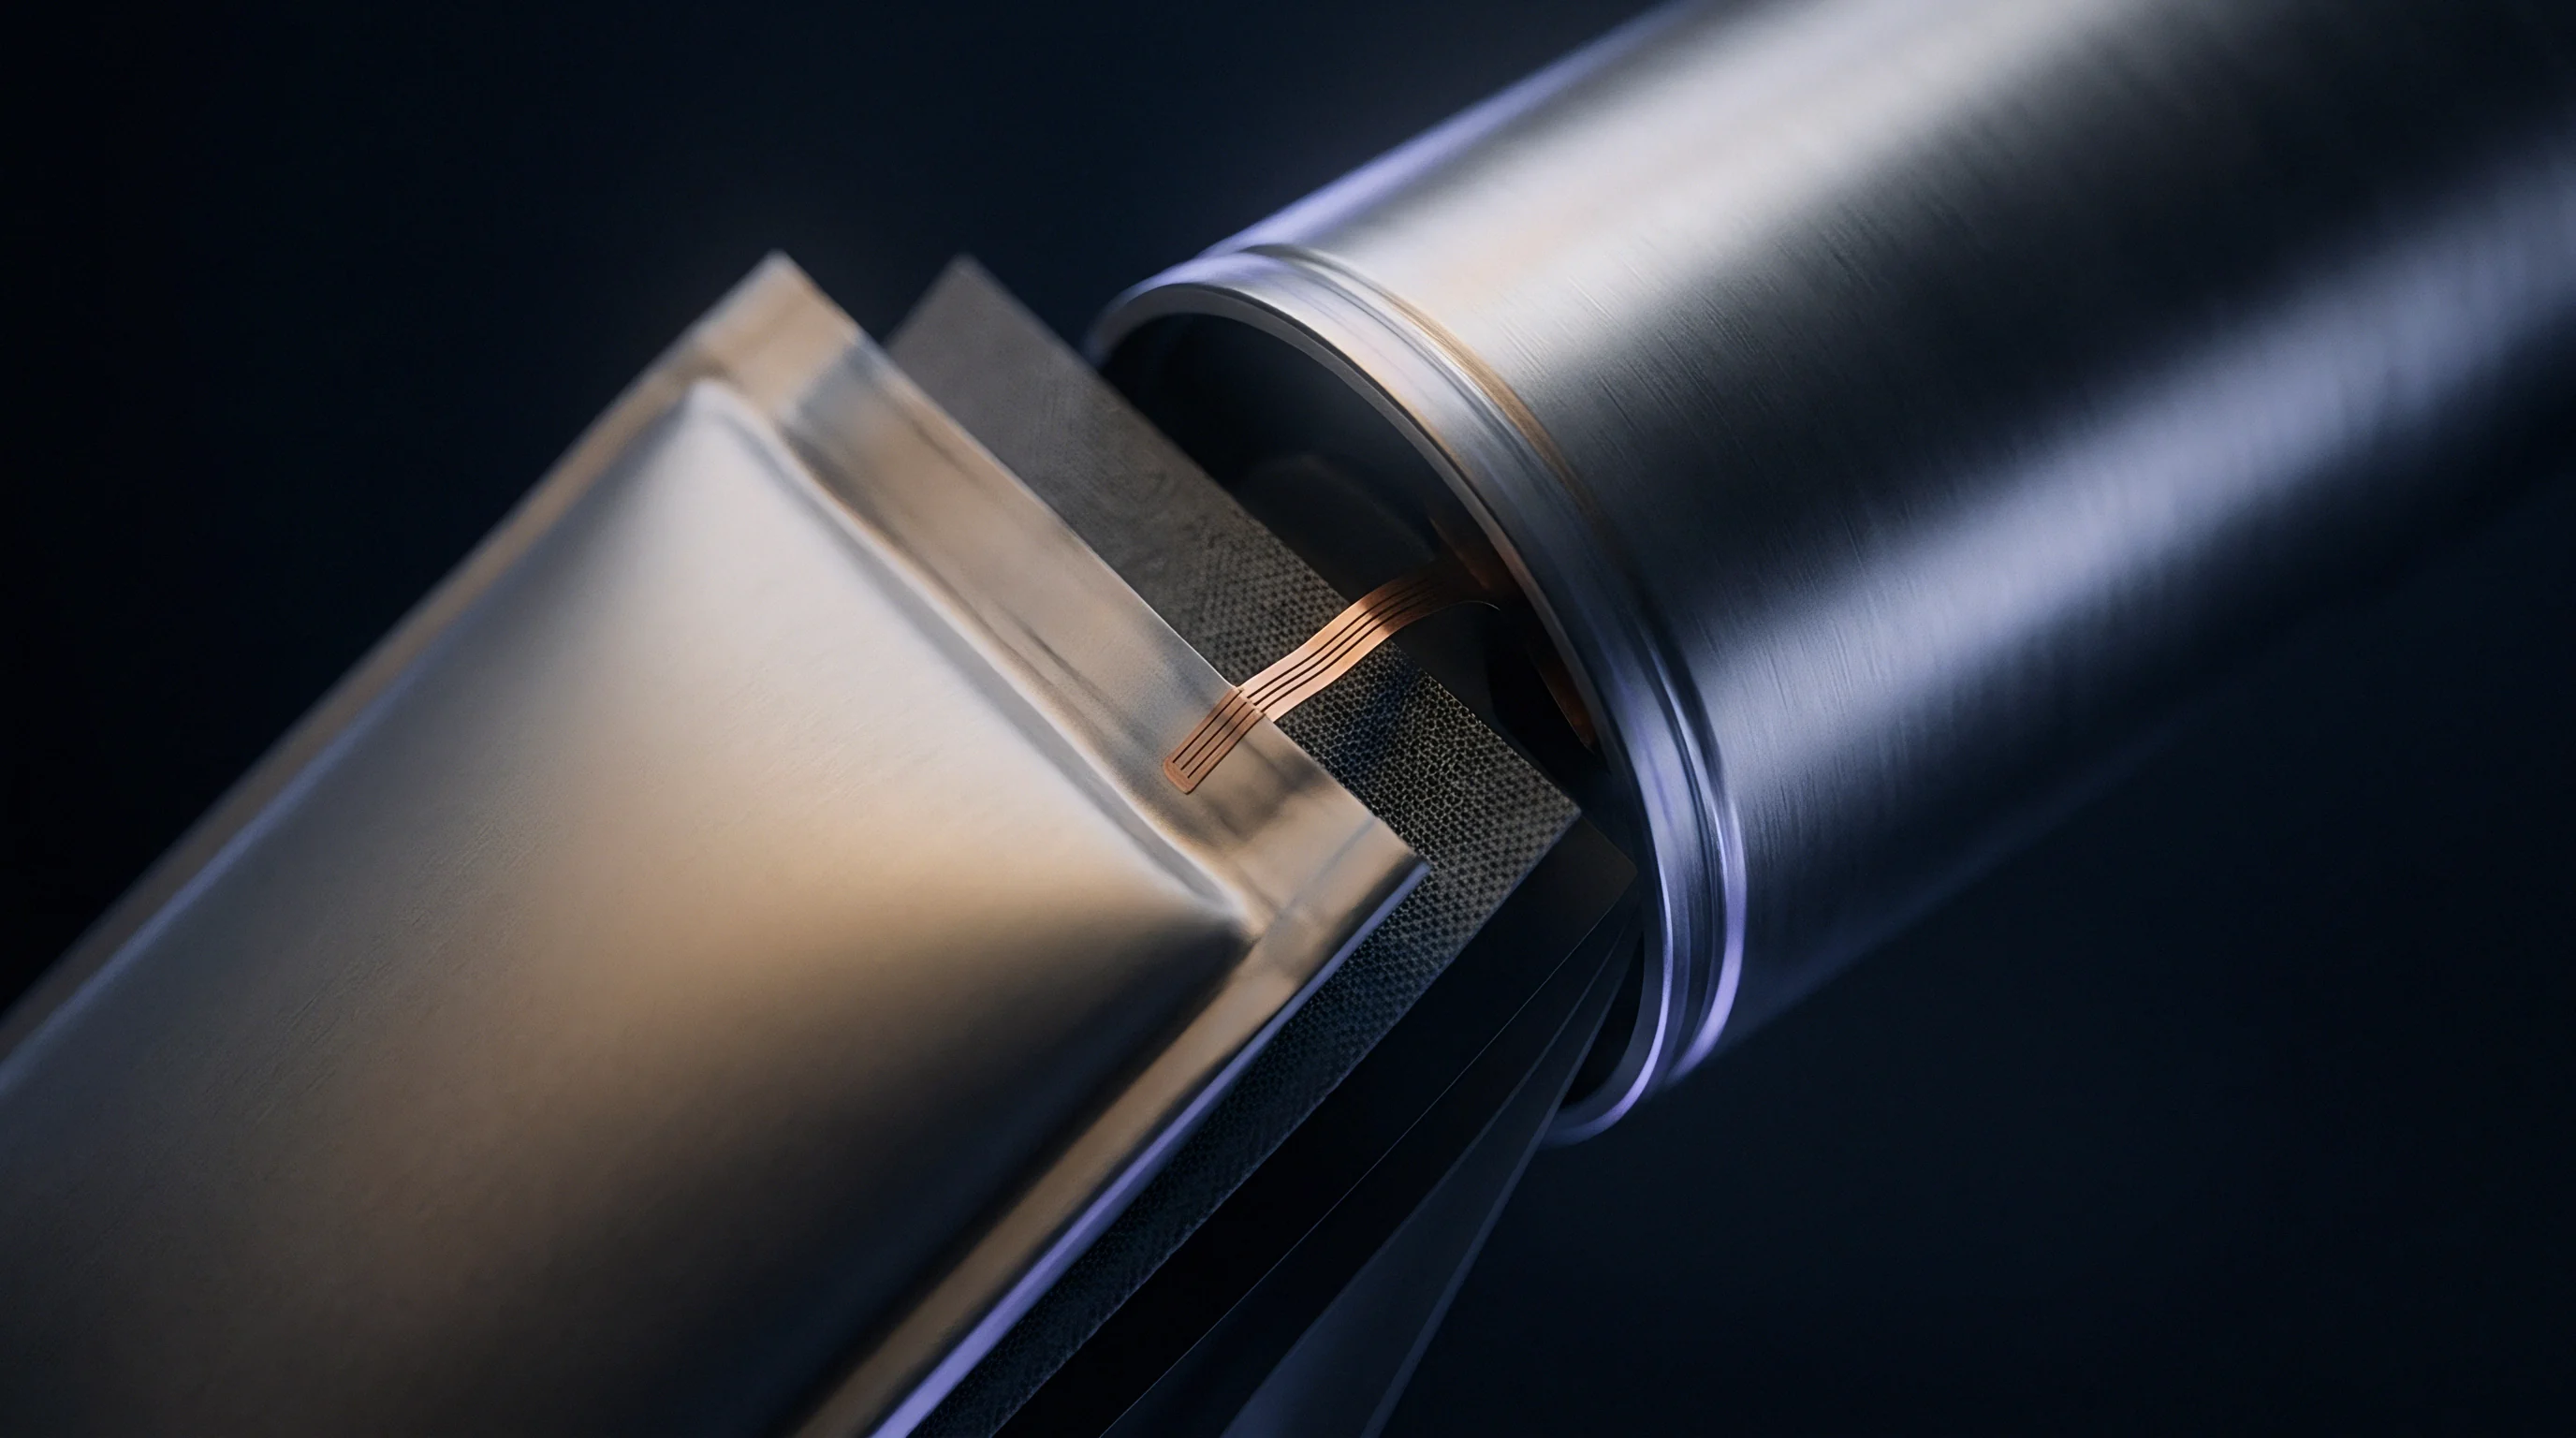
Matching probe tip geometry to the terminal comes down to material hardness and oxide structure. Native aluminum oxide (Al2O3) forms a hard, insulating ceramic layer 2 to 5 nanometers thick on raw aluminum posts within seconds of exposure to air. A flat or rounded probe tip spreads force across too much area, failing to create the compressive stress needed to crack that brittle skin.
Instead, the probe skitters over the oxide, producing noisy, unstable resistance readings.
Sharp, multi-point tips concentrate spring force onto microscopic edges. Four-point crowns, 90-degree spear points, and serrated blades focus 1.5 to 3.5 Newtons per pin onto tiny contact areas. Local pressure exceeds the terminal metal’s yield strength, driving the points through the insulating oxide layer into raw metal below.
That mechanical bite establishes clean micro-contacts and brings contact impedance down to a repeatable baseline.
| Tip Profile | Primary Target Surface | Oxide Piercing Capability | Terminal Surface Damage | Tip Wear Rate (Cycles) | Contact Repeatability |
|---|---|---|---|---|---|
| 4-Point Crown (Serrated) | Flat nickel steel, raw aluminium | Excellent | Moderate microscopic indentation | 150,000 | ± 1.5 microhms |
| 90° Single Spear Point | Recessed welds, heavy oxide tab | Superior | High localized puncture mark | 100,000 | ± 2.0 microhms |
| Coaxial Dual Pin (Inner/Outer) | Cylindrical caps, button tops | Good | Low uniform ring mark | 200,000 | ± 0.8 microhms |
| Flat Round Cup | Spherical weld nubs, clean copper | Poor | Minimal (zero mark) | 300,000 | ± 25.0 microhms |
| Multi-V-Groove Blade | Pouch cell foil tab stacks | High | Moderate blade depression | 120,000 | ± 1.2 microhms |
Testing cylindrical cells introduces another risk: cap deformation. Pressing hard with a sharp spear point on an 18650 or 21700 positive cap can dent the current interrupt device (CID) beneath, ruining a brand-new cell. Coaxial Kelvin probes solve this by placing an outer crown ring on the force path and a floating center pin on the sense path.
The outer ring distributes force around the cap perimeter to cut through surface oxide without collapsing the cap, while the light-touch center pin (0.8 Newtons) reads voltage drop accurately.
Thermoelectric Voltage Offsets and Material Interfaces
High excitation currents through tiny contact points generate localized heat. When dissimilar metals join across a temperature gradient, the Seebeck effect creates a small DC potential ~ thermoelectric EMF. In a test fixture, pairing beryllium copper pins with aluminum posts or nickel-plated caps creates bimetallic junctions.
A temperature difference of just 5°C across the contact point can introduce 10 to 50 microvolts of offset directly across the sense terminals.
In low-voltage DC-IR pulse tests where the total measured drop might be only 5 millivolts, a 50-microvolt offset adds a 1 percent error. Modern micro-ohm meters use offset voltage compensation (OVC) to strip out these Seebeck effects: the meter measures baseline thermal voltage right before firing the current pulse, then subtracts that offset from the loaded measurement. Keeping automated test stations in draft-free enclosures helps prevent sudden airflow changes from driving thermal gradients across the contact blocks.
Pouch cell tab testing is especially sensitive to blade alignment. If a blade clamp sits off by even 3 degrees, force concentrates along one edge, shearing thin internal foils while giving a misleadingly low resistance reading from the high local pressure.
Choosing smooth, flat probe tips to avoid marking cell terminals almost guarantees erratic oxide penetration, leading to false lot rejections and ruined test throughput.


Drift
Internal resistance changes noticeably with temperature, state of charge, and relaxation time. A micro-ohm meter calibrated to six decimal places is useless if cell temperature drifts unmonitored by 3°C during testing. Lithium-ion cells carry a strong negative temperature coefficient: as temperature drops, electrolyte viscosity rises and ionic mobility slows down, while charge-transfer resistance across the SEI grows exponentially following Arrhenius kinetics.
Near 25°C, internal AC resistance on commercial NMC or LFP cells jumps roughly 1.5 to 3.0 percent for every 1°C drop in core temperature.
A 280Ah LFP cell that reads 0.180 milliohms at 25.0°C will read roughly 0.207 milliohms if tested straight off a delivery truck at 20.0°C. If incoming quality limits cap acceptable resistance at 0.200 milliohms, good cells get rejected purely over temperature differences. Temperature control in testing bays is mandatory: incoming pallets need to soak in a controlled space for 12 to 24 hours so cell cores reach thermal equilibrium before four-wire screening starts.
State-of-Charge and Electrochemical Relaxation Effects
State of charge affects AC-IR and DC-IR differently. High-frequency 1 kHz AC-IR stays flat across the middle of the SOC curve (20 to 80 percent) for most chemistries. Only near the extremes ~ below 10 percent or above 90 percent ~ do phase shifts in cathode structures and rapid OCV changes cause minor variations in 1 kHz readings.
Manufacturers generally perform 1 kHz AC-IR screening at the factory shipping state of charge, standardized between 30 and 50 percent SOC under UN 38.3 transport regulations.
DC resistance is sensitive to state of charge across the entire range. Below 20 percent SOC, solid-state lithium diffusion in graphite or silicon-composite anodes slows dramatically, causing DC-IR readings to jump 50 to 200 percent above mid-range baselines. Using DC-IR for cell sorting or pack matching requires precise SOC matching, confirmed by open-circuit voltage checks within ±1 millivolt.
Standardizing incoming 1 kHz AC-IR cell screening to a reference temperature of 25.0°C with an enforced thermal normalization coefficient of -2.2% per °C prevents seasonal climate variations from corrupting multi-batch quality records.
Freshly cycled cells carry transient polarization gradients that decay over time. Right after formation cycling, heavy charging, or thermal exposure, concentration gradients persist in electrolyte pores and electrode particles. Testing cell resistance without adequate rest gives artificially low AC-IR and erratic DC-IR values.
A relaxation window of 2 to 4 hours after cycling settles these internal gradients and ensures reproducible readings.
- Verify calibration against a certified, low-inductance four-wire Kelvin resistance standard mounted inside the fixture frame.
- Record ambient test bay temperature using a calibrated Pt100 RTD sensor placed within 50 millimeters of the contact zone.
- Place a surface thermal probe at the center of the cell casing to confirm core equilibrium within ±0.5°C of target temperature.
- Run an auto-zero offset voltage compensation routine on the meter with probes lifted clear of any conductive surface.
- Apply Kelvin force and sense probes to terminals under pneumatically controlled force, holding contact for 300 milliseconds before current injection.
- Acquire 1 kHz AC-IR and open-circuit voltage simultaneously, logging raw impedance, phase angle, and ambient temperature into the traceability database.
- Apply temperature normalization formulas to convert raw readings to 25.0°C equivalents before running statistical pass/fail checks.
Maintaining steady measurements requires systematic tracking of drift across fixture cabling, instrumentation, and the test bay environment.

Mathematical Temperature Normalization Procedures
When schedules do not allow long thermal soak times, mathematical temperature compensation normalizes measured resistance back to a standard baseline (typically 25.0°C). The linear correction model is:
R25 = fracRT1 + α (T – 25.0)
where RT is measured resistance at cell temperature T (°C), R25 is normalized resistance at 25.0°C, and α is the thermal resistance coefficient for the chemistry (°C⁻¹). For high-precision applications across wider temperature ranges (-10°C to +45°C), Arrhenius modeling is more accurate:
R25 = RT · expleft
where Ea is the internal impedance activation energy (typically 20 to 35 kJ/mol for commercial cells), Rg is the universal gas constant (8.314 J/mol·K), and temperatures are in Kelvin. Using linear models across broad temperature swings introduces error because charge-transfer kinetics follow exponential rather than linear relationships.
Sales datasheets often present internal resistance as constant from 10°C to 40°C. In reality, ionic conductivity changes continuously with temperature, and no commercial liquid electrolyte escapes Arrhenius behavior.
Micro-ohm fluctuations across incoming shipments were attributed to humidity changes inside the freight container during sea transit.

Rejection
Setting strict internal resistance acceptance limits prevents battery pack builders from assembling modules with high-resistance cells. Excess resistance accelerates local heat generation under load, creating thermal imbalances across series-parallel arrays and accelerating capacity degradation or thermal runaway. Statistical process control (SPC) on incoming micro-ohm readings is the primary defense against substandard or off-spec cell lots.
High-volume factories sort Grade-A cells into tight 1 kHz AC-IR distribution bands. A typical 302Ah LFP production run follows a Gaussian distribution centered at 0.180 milliohms with a standard deviation (σ) of 0.003 milliohms. Quality contracts define upper and lower specification limits (USL and LSL) at ±3 standard deviations from the lot mean, or within fixed percentage bounds (usually ±5 percent of nominal datasheet value).
Process capability (Cpk) targets generally must exceed 1.33, proving the line operates well within design limits.
Statistical Lot Screening and Outlier Identification
Incoming inspection ~ whether 100 percent screening or AQL statistical sampling (per ISO 2859-1) ~ uses four-wire Kelvin stations to map resistance curves for every batch. Cells with AC-IR values sitting more than 3σ above the lot mean signal manufacturing anomalies, even if they stay under the supplier’s absolute datasheet limit. Foil burrs, separator pinholes, weak ultrasonic tab welds, or low electrolyte dosing all show up as positive resistance outliers.
Take an incoming inspection of 5,000 280Ah LFP prismatic cells intended for a grid storage deployment. The supplier datasheet lists a nominal 1 kHz AC-IR of 0.20 milliohms with a maximum limit of 0.25 milliohms. The quality team runs 100 percent automated four-wire Kelvin testing at 25.0°C ± 0.5°C.
| Statistical Metric | Batch AC-IR Value (mΩ) | Deviation from Mean | Cell Count in Range | Lot Percentage (%) | Quality Status & Disposition |
|---|---|---|---|---|---|
| Target Lot Mean (μ) | 0.182 mΩ | Baseline | 4,780 | 95.60% | Grade A Prime (Accepted) |
| Minor Deviation (+2σ) | 0.191 mΩ | +4.95% | 145 | 2.90% | Grade A Standard (Accepted) |
| Upper Control Limit (+3σ) | 0.197 mΩ | +8.24% | 42 | 0.84% | Quarantine for Re-Test |
| Datasheet Limit Outlier | 0.228 mΩ | +25.27% | 28 | 0.56% | Defective / Reject (Tab Weld / Dry) |
| Gross Outlier (Micro-short) | 0.315 mΩ | +73.08% | 5 | 0.10% | Critical Defect / Quarantine Lot |
Although 4,967 cells pass the broad 0.250 milliohm datasheet ceiling, statistical analysis shows 33 cells (0.66 percent of the lot) sitting outside the batch’s 3σ Gaussian curve. Putting those 33 outliers into high-voltage series strings compromises the module. Under a continuous 100-Ampere load, a cell reading 0.315 milliohms generates nearly twice the heat (P = I²R) of a nominal 0.182 milliohm cell, creating local hotspots that degrade neighboring cells and force premature BMS low-voltage cutoffs.
Commercial Qualification Protocol and Technical Specifications
Protecting procurement capital requires writing precise four-wire Kelvin test parameters directly into supply agreements and RFQ specifications. Datasheets stating “Internal Resistance < 0.5 mΩ" without defining test frequency, temperature, SOC, contact force, and statistical limits offer no real protection in commercial disputes.
- Test Frequency and Waveform Specification defines mandatory 1000 Hz ± 10 Hz sinusoidal AC excitation or explicit direct current pulse duration (100 ms, 1 s, 10 s) per IEC 61960-3 standards.
- Thermal Conditioning Protocol mandates cell soak periods to achieve 25.0°C ± 0.5°C core equilibrium prior to test execution, accompanied by thermal correction coefficient formulas.
- Mechanical Fixturing Parameters dictates four-point Kelvin contact isolation, pin tip geometry (4-point serrated crown), minimum contact force (2.5 N per pin), and rhodium/gold plating wear limits.
- Statistical Acceptance Thresholds establishes batch capability expectations requiring Cpk ge 1.33 with maximum allowable resistance range (Δ R) capped at 8 percent of batch mean.
- Traceability and Data Serialization binds individual cell barcode scans to micro-ohm values, open-circuit voltages, and ambient test temperatures logged in automated factory records.
- Dispute Arbitration Reference Standards designates an independent certified third-party testing laboratory operating calibrated high-precision impedance analyzers under ISO/IEC 17025 accreditation.
Continuous four-wire Kelvin screening turns internal resistance from a passive datasheet line item into a useful quality metric. By eliminating contact errors, accounting for thermal drift, and screening outliers statistically, test engineers ensure that cells entering module assembly match design assumptions.
Section 4.3 of the master procurement agreement dictates that any cell lot exhibiting a 1 kHz AC-IR standard deviation exceeding 4.5 percent of the batch mean shall be rejected in its entirety at the supplier’s expense.