What a Cell Datasheet Hides about Storage Shelf Life
Datasheet shelf life claims hide permanent capacity loss and resistance growth; real storage stability demands dock impedance screening and temperature tracking.

Fade
Storage shelf life on a lithium-ion cell datasheet routinely appears as a single optimistic line. Manufacturers print self-discharge rates under three percent per month, measured at twenty-five degrees Celsius and forty percent state of charge. That ideal metric assumes static ambient temperatures, controlled storage facilities, and brief retention windows before module integration.
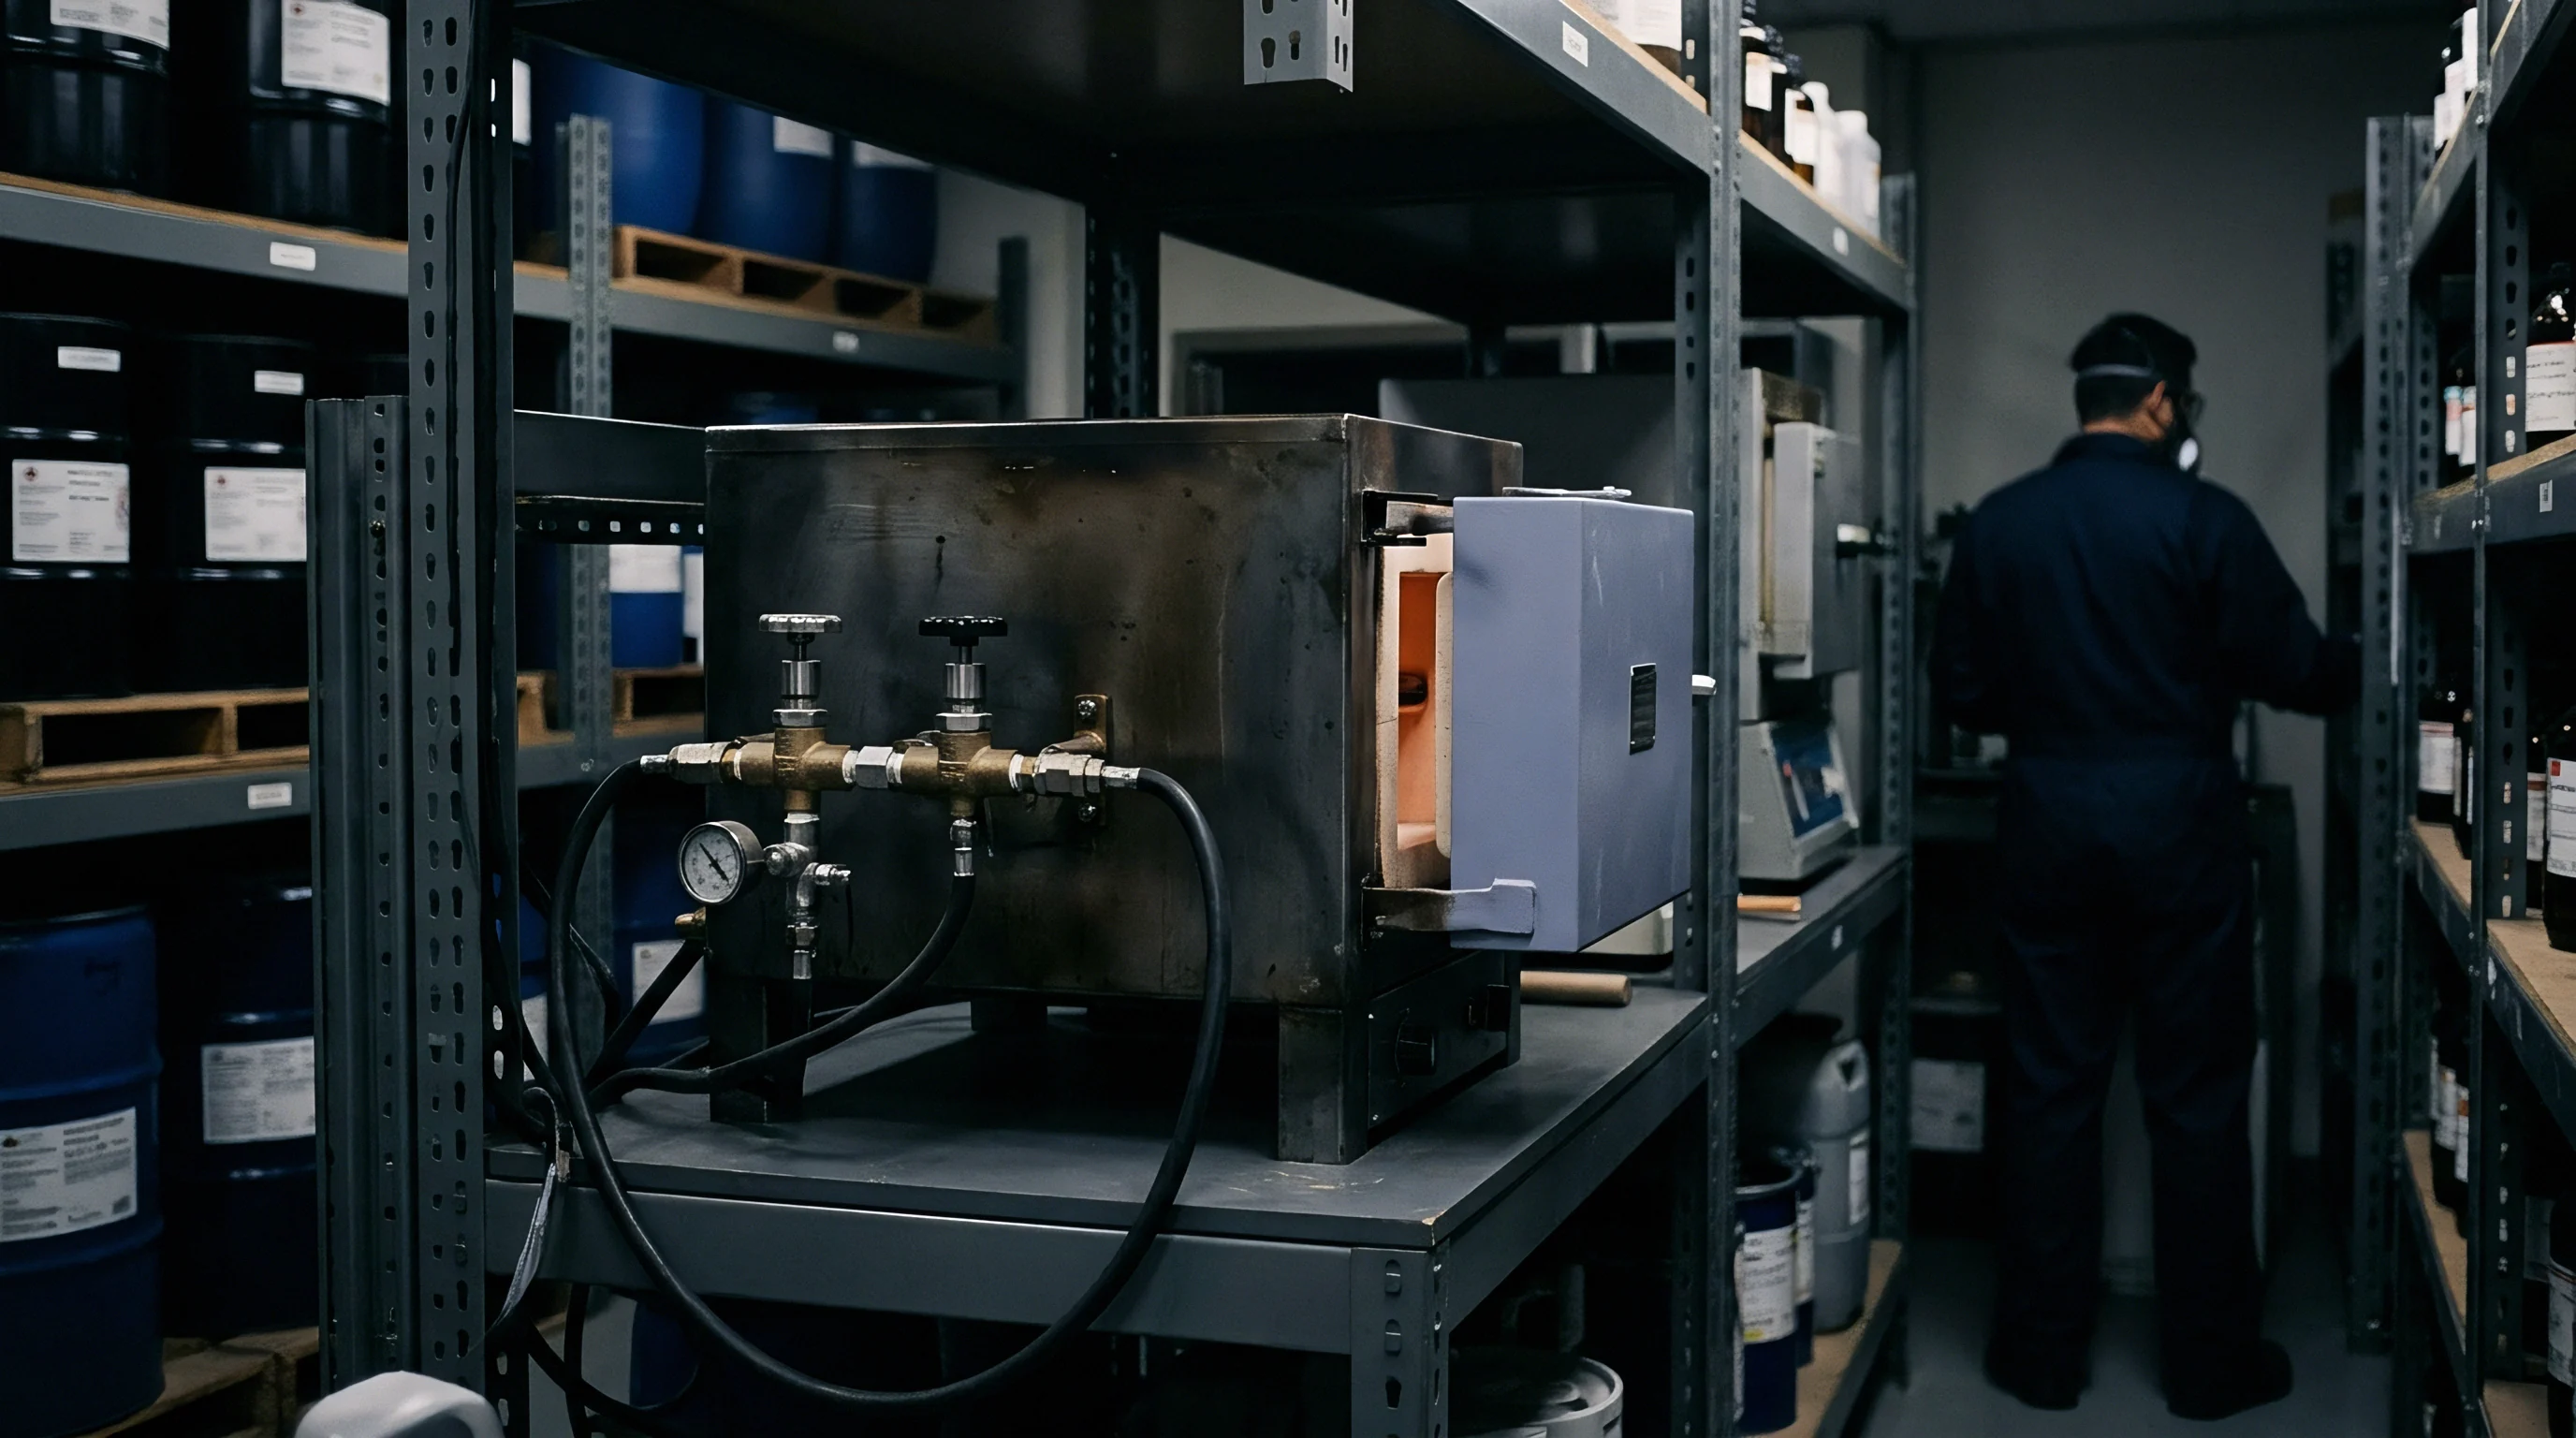
Real supply chains operate far outside those boundary conditions. Cells sit in ocean shipping containers for six weeks, clear customs over fourteen days in tropical ports, and wait on warehouse racks for six months before pack manufacturing begins. During this retention period, non-reversible chemical degradation proceeds continuously, altering the electrical and physical profile of the cell long before an external circuit completes a loop.
Datasheet self-discharge figures measure reversible capacity loss while completely ignoring permanent capacity fade and impedance growth. Reversible self-discharge occurs as side reactions temporarily deplete active lithium ions at the electrode interfaces, a deficit recovered during the next charge cycle. Permanent calendar aging arises from irreversible side reactions that permanently consume cyclable lithium and destroy active electrode material.
The rate of this permanent calendar aging is not constant; it follows non-linear pathways driven by storage temperature, state of charge, electrode surface area, and chemical formulation. A cell stored at fifty percent state of charge and twenty-five degrees Celsius exhibits modest capacity loss over twelve months. The same cell held at eighty percent state of charge and thirty-five degrees Celsius loses usable capacity at a rate nearly four times higher over the same duration.
The primary mechanism driving irreversible calendar fade during storage is the continuous growth of the solid electrolyte interphase layer on the graphite anode. During initial formation at the factory, electrolyte solvents decompose on the anode surface, creating a passivating solid layer that allows lithium ion diffusion while blocking electron transfer. This passivating layer is not completely static.
Microstructural stresses, solvent dissolution, and thermal diffusion continuously expose fresh graphite surfaces to the liquid electrolyte. Parasitic reduction reactions consume free lithium ions from the cathode matrix to rebuild this interface, permanently stripping cyclable lithium from the electrochemical system. High ambient storage temperatures elevate the diffusion coefficient of solvent molecules through the interphase layer, transforming a slow parabolic growth process into rapid linear degradation.
A 21700 NMC811 cell held at 100 percent state of charge and 35 degrees Celsius loses 8.4 percent of usable capacity to calendar aging within 180 days.
Storage at elevated states of charge amplifies chemical decomposition at both electrodes. High anode state of charge lowers the electrochemical potential of the graphite, creating a stronger thermodynamic driving force for electrolyte reduction and continuous interface thickening. Simultaneously, high cathode potential induces transition metal dissolution in nickel-manganese-cobalt formulations.
Oxidized solvent species migrate from the cathode to the anode, destabilizing the passivating interface and catalyzing secondary passivation growth. High state of charge accelerates structural disordering at the particle surfaces of high-nickel cathodes, forming a resistive rock-salt phase that permanently elevates direct current internal resistance. Datasheet tables present storage metrics at lower states of charge precisely because higher storage voltages accelerate these degradation pathways simultaneously.
Impedance growth during storage impacts high-power applications far more severely than bulk capacity loss. While a buyer tracks storage shelf life by measuring remaining discharge capacity in ampere-hours, internal resistance frequently doubles before bulk capacity drops by five percent. Solid electrolyte interphase thickening, micro-cracking of cathode particles, and chemical oxidation of conductive additives restrict charge transfer kinetics across the solid-liquid interfaces.
Elevated internal resistance reduces power delivery, causes premature voltage cut-offs under high discharge currents, and generates excessive internal heat during operation. A cell that retains ninety-five percent of nominal capacity after prolonged storage may fail operational criteria due to severe voltage sag under load.
To quantify the impact of calendar storage on cell health, continuous rate equations incorporate temperature and voltage acceleration factors. The reaction rate for solid interphase growth typically follows an Arrhenius relationship governed by activation energy values between 0.4 and 0.7 electron-volts, depending on solvent composition and additive packages. Storage at forty-five degrees Celsius doubles or triples passivation growth rates compared to baseline twenty-five degree metrics.
The functional relationship between capacity fade and storage duration scales with the square root of time under moderate conditions, reflecting diffusion-limited growth kinetics. When high temperature or elevated state of charge destabilizes the protective layer, kinetics transition to linear time dependence, causing rapid performance loss across extended storage periods.

Electrochemical Shifts across Prolonged Storage States
Changes in open-circuit voltage during storage reflect thermodynamic shifts within the full-cell system. As parasitic reactions consume cyclable lithium at the anode, the relative stoichiometric balance between cathode and anode shifts, a phenomenon termed lithium inventory loss. This stoichiometry shift alters the operational potential window of individual electrodes.
The cathode operates at higher states of charge relative to the anode for a given full-cell voltage, accelerating solvent oxidation and structural degradation. An open-circuit voltage drop during storage directly reveals ongoing chemical degradation that alters cell thermodynamics permanently, rather than simple temporary discharge.
Differences in chemical composition dictate unique storage sensitivity profiles across popular battery chemistries. Lithium iron phosphate cells demonstrate lower self-discharge rates and superior structural stability during high-potential storage due to the robust olivine crystal lattice and lower operational cathode potential. High-nickel layered oxide chemistries suffer from heightened reactivity, rapid phase transitions at the particle surface, and transition metal dissolution when stored above sixty percent state of charge.
Silicon-graphite composite anodes exhibit severe calendar aging during storage because volume contraction during partial discharge breaks the passivating interface, exposing fresh silicon to continuous liquid electrolyte degradation. Datasheets hide these microstructural discrepancies behind generalized storage shelf life statements.
In three ocean freight containers sitting in a transit hub during a summer heatwave, internal temperatures reached 42 degrees Celsius. The cell temperature profiles inside those ocean freight containers maintained elevated thermal levels for twenty-two consecutive days, altering the baseline aging trajectory before the shipment reached the port of entry. The cumulative thermal exposure consumed roughly fourteen months of equivalent room-temperature storage life before factory receiving inspection even began.
Standard factory warranty terms rarely account for thermal spikes experienced during transit, leaving the buyer to absorb performance deficits arising from intermediate supply chain delays.
Storage-induced gas generation poses an additional physical challenge that single-line datasheet shelf life claims omit. Solvent oxidation at high cathode potentials releases volatile organic compounds and carbon dioxide gas inside sealed pouch or prismatic cell hardware. In pouch formats, gas generation causes swelling, alters internal stack pressure, and disrupts mechanical contact between separator and electrode faces.
Reduced contact pressure creates non-uniform current density distribution during subsequent operation, producing localized hot spots and lithium plating during fast charging. Prismatic cell enclosures withstand internal pressure increases better, but gas accumulation can trigger pressure-relief vent rupture or internal jelly-roll deformation if storage temperatures exceed factory limits for extended periods.
Continuous chemical side reactions during storage alter electrolyte viscosity and ion conductivity. Electrolyte decomposition consumes volatile solvent species such as dimethyl carbonate, increasing the concentration of high-viscosity cyclic carbonates like ethylene carbonate within the remaining liquid phase. Higher liquid viscosity reduces lithium-ion transport kinetics through the porous separator and electrode pores, increasing concentration polarization during high-rate discharge.
Electrolyte drying occurs as liquid components convert into solid interface products. This solvent depletion leaves regions of the porous electrode matrix completely un-wetted, permanently deactivating active electrode mass and reducing overall energy density.
The table below details real-world capacity retentions and resistance increases for high-density nickel-manganese-cobalt cells subjected to matrix storage conditions over twelve calendar months. The data reflects baseline measurements taken immediately after factory formation against tests executed following controlled storage intervals.
| Storage Temperature (°C) | State of Charge (%) | Capacity Retention (%) | DCIR Increase (%) | Reversible Loss (%) | Irreversible Loss (%) |
|---|---|---|---|---|---|
| 15 | 30 | 98.2 | 4.1 | 0.6 | 1.2 |
| 15 | 50 | 97.1 | 5.8 | 0.9 | 2.0 |
| 15 | 100 | 93.4 | 12.4 | 1.8 | 4.8 |
| 25 | 30 | 96.8 | 7.2 | 1.1 | 2.1 |
| 25 | 50 | 94.5 | 11.3 | 1.6 | 3.9 |
| 25 | 100 | 88.1 | 24.6 | 2.9 | 9.0 |
| 35 | 30 | 93.1 | 14.8 | 1.8 | 5.1 |
| 35 | 50 | 89.6 | 22.5 | 2.5 | 7.9 |
| 35 | 100 | 79.3 | 51.2 | 4.1 | 16.6 |
| 45 | 30 | 87.4 | 29.3 | 2.8 | 9.8 |
| 45 | 50 | 81.2 | 46.8 | 3.7 | 15.1 |
| 45 | 100 | 68.5 | 108.4 | 5.9 | 25.6 |
The quantitative data demonstrates that storage temperature exerts a far greater impact on direct current internal resistance than on bulk capacity retention. While a cell stored at forty-five degrees Celsius and one hundred percent state of charge loses roughly thirty-one percent of initial capacity over one year, its internal resistance grows by more than one hundred percent. This resistance doubling severely degrades high-rate performance, rendering the cell unsuitable for peak-power automotive or industrial duties despite maintaining sixty-eight percent of its nameplate energy density.
Standard datasheets hide this resistance trajectory by publishing storage figures based solely on slow-rate capacity tests conducted under optimal ambient temperatures.
Long-term calendar aging affects the safety profile of stored cells in subtle ways. Thickened passivating layers and altered electrode surface states change the thermal stability parameters of the cell. Mechanically, non-uniform growth of interface layers produces localized mechanical stresses within the jelly-roll, increasing susceptibility to micro-shorts during physical shock or vibration.
Chemically, the accumulation of volatile decomposition products lowers the onset temperature for thermal runaway during physical abuse tests. Differential scanning calorimetry confirms that aged cathode materials stored at high potentials exhibit lower thermal decomposition onset temperatures and higher total heat release than pristine cells tested directly after factory formation.
Data sheet capacity loss curves routinely mask the presence of inflection points in calendar degradation rates. Under severe storage conditions, capacity loss kinetics can transition abruptly from square-root time dependence to linear or exponential decay regimes. This acceleration occurs when the passivating layer reaches a critical thickness, causing mechanical cracking under thermal expansion or complete local consumption of film-forming electrolyte additives.
Once these protective additives are exhausted, liquid electrolyte solvent directly oxidizes against bare electrode particles without hindrance, producing rapid capacity degradation and high internal resistance spikes within short operational periods.
Cell manufacturers systematically frame these degradation metrics within tight operational windows to protect product ratings. Published storage shelf life values represent ideal baseline potential under laboratory conditions; retention outside specified ambient temperature ranges invalidates standard datasheet lifecycle commitments.
Foil
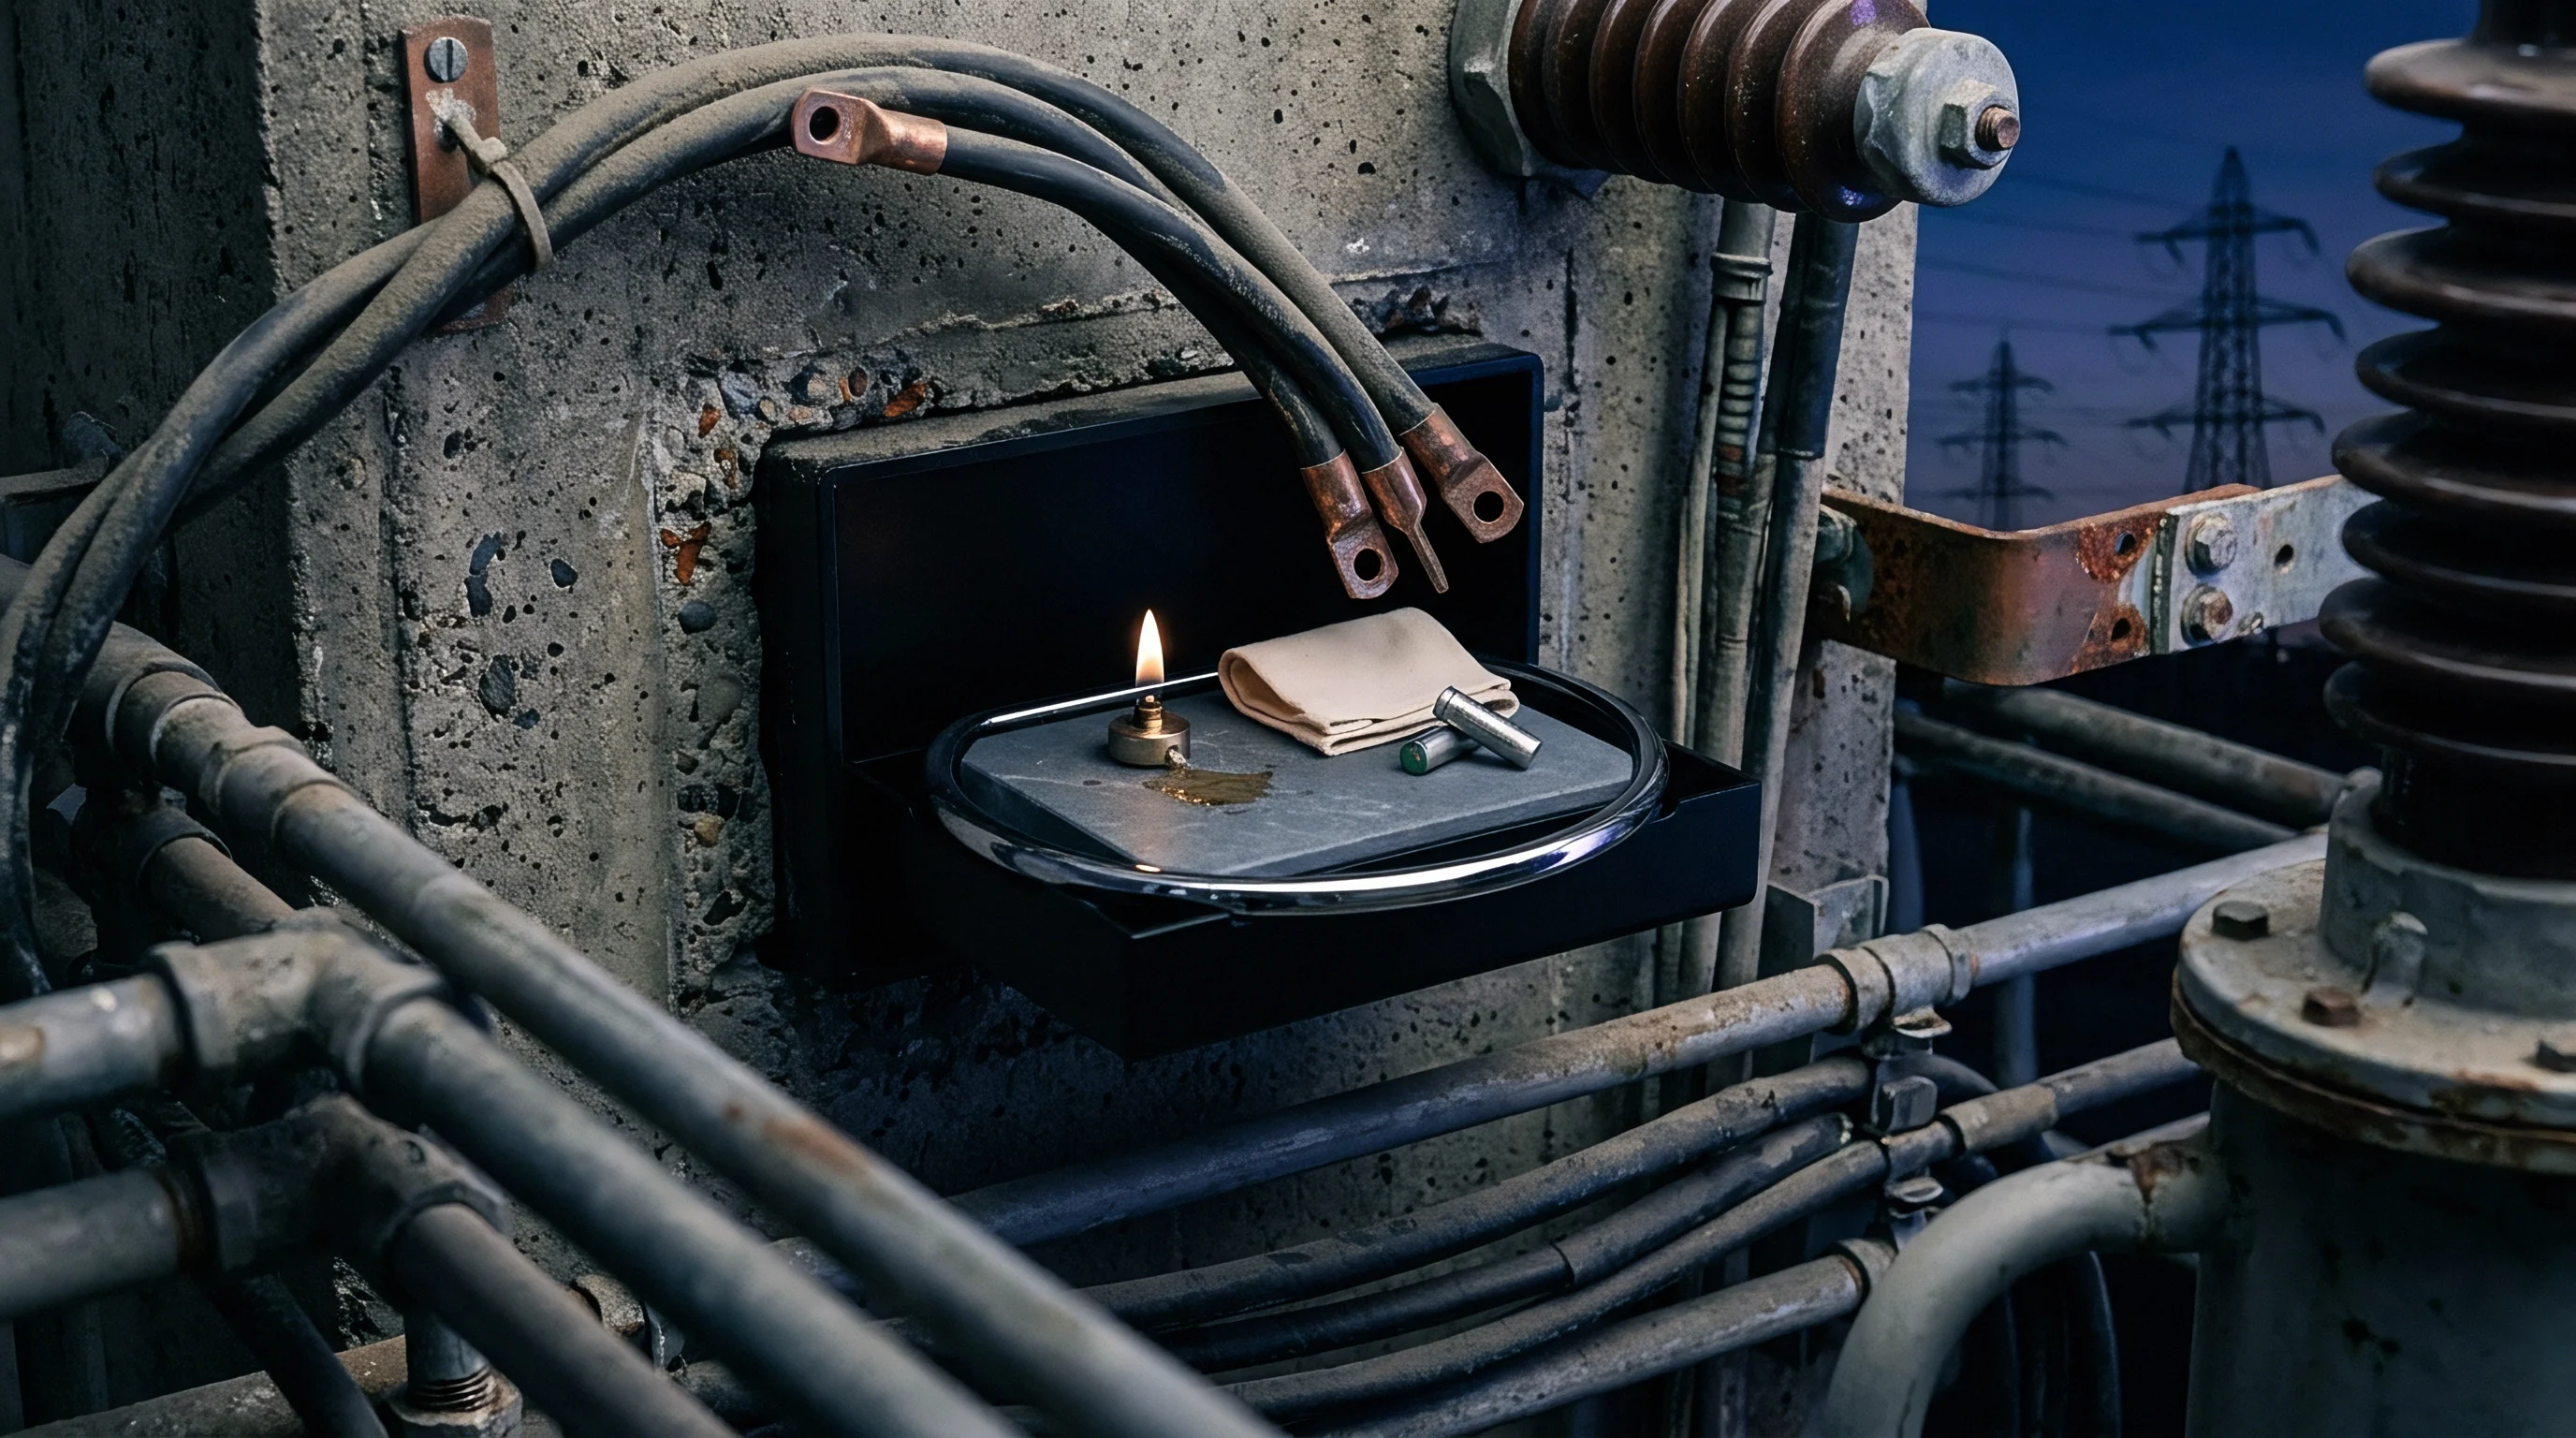
Deep within the internal structure of a stored cell, current collectors serve as the primary electronic conduit between active material layers and external terminals. Aluminum foil supports the cathode coating, while copper foil holds the graphite or silicon anode active material. During normal charge and discharge cycles, these metallic foils maintain chemical stability within specified voltage operating windows.
Under prolonged storage conditions, particularly when self-discharge drives cell potential below safety thresholds, metallic current collectors enter thermodynamic instability regimes that trigger irreversible physical and electrical damage.
When self-discharge drives a cell voltage below 2.0 volts, anode potential rises significantly relative to the lithium reference. Standard graphite anodes operate near 0.1 volts against lithium under normal conditions, preserving copper foil stability. As lithium ions leave the anode during deep self-discharge, anode potential approaches 3.5 volts against lithium.
At this elevated potential, metallic copper oxidizes into soluble copper ions. The solid copper foil dissolves directly into the liquid electrolyte, thinning the current collector substrate, increasing localized electrical resistance, and releasing copper ions into liquid solution.
Subsequent charging of a cell damaged by copper dissolution induces catastrophic failure pathways. As charging voltage forces anode potential back down below 0.1 volts, dissolved copper ions in the electrolyte reduce back into solid metallic copper. This electrodeposition process does not form a smooth, uniform foil layer.
Copper deposits as sharp, high-aspect-ratio metallic dendrites across the anode surface and inside porous separator channels. These metallic copper dendrites grow through the separator matrix during charge-discharge cycling, creating low-resistance electrical shorts directly between cathode and anode layers. Copper dendrite formation leads directly to localized thermal runaway events during subsequent charge operations.
Section 6.2 of IEC 62133 dictates that secondary lithium cells stored beyond six months require mandatory electrical reconditioning before deployment under factory warranty.
Moisture ingress during storage triggers severe chemical attack on both metallic current collectors and inorganic binder matrix networks. Although cell enclosures undergo rigorous sealing protocols, trace ambient moisture permeates polymeric pouch seals or seals around terminal bushings over extended warehousing periods. Water molecules react with lithium hexafluorophosphate salt in the electrolyte, producing hydrofluoric acid.
Hydrofluoric acid attacks the aluminum oxide passivating layer on cathode aluminum current collectors, inducing localized pitting corrosion. Corrosion at the aluminum foil interface degrades mechanical adhesion between active cathode particles and the current collector, causing delamination of active material and sharp spikes in high-frequency internal resistance.
Chemical degradation of polymeric binders during shelf storage undermines mechanical structural integrity across electrode stacks. Polyvinylidene fluoride, the standard binder for cathode formulations, undergoes dehydrofluorination when exposed to elevated storage temperatures and alkaline trace products. This reaction breaks polymer chains, reduces binder elasticity, and compromises the physical network holding cathode particles together.
Electrode delamination occurs as active material disconnects from aluminum current collectors during thermal expansion cycles in storage. Active material delamination permanently removes active cathode mass from the electrical circuit, manifesting as non-recoverable capacity loss during initial cell commissioning.
Key failure modes within electrode assemblies, liquid electrolytes, and mechanical enclosures during extended warehousing under sub-optimal ambient conditions include:
- Copper foil dissolution occurs when deep self-discharge drives anode potential above 3.5 volts, converting solid current collector substrate into soluble copper ions that migrate into liquid electrolyte.
- Metallic dendrite growth occurs upon re-charging copper-damaged cells, forming conductive metallic structures through the separator that induce internal short circuits.
- Binder cross-linking loss weakens particle-to-collector mechanical adhesion under elevated storage temperatures, causing physical active mass delamination and impedance spikes.
- Hydrofluoric acid pitting corrodes aluminum cathode current collectors when ambient moisture permeates cell seals and reacts with fluorinated electrolyte salts during prolonged storage.
- Separator shrinkage reduces mechanical puncture resistance and dimensional stability under elevated storage heat, exposing electrode edges to direct shorting risks.
- Electrolyte phase separation occurs during long static storage, causing density stratification that produces uneven local current density and accelerated localized aging during subsequent cycling.
Separator breakdown represents another hidden physical degradation mode accelerated by storage conditions. Polyolefin separators made from polyethylene or polypropylene rely on micro-porous structures to permit lithium-ion transfer while isolating cathode and anode physically. Extended exposure to liquid electrolyte solvents at thirty-five degrees Celsius or higher induces structural relaxation, pore closure, and physical shrinkage of the polymeric separator membrane.
Pore closure reduces localized ionic conductivity, increasing high-frequency AC impedance. Separator shrinkage around jelly-roll edges exposes bare copper and aluminum foil edges, creating severe short-circuit hazards during module assembly or physical handling.
Data sheets obscure physical foil and binder damage by reporting storage limits through superficial electrical metrics. A datasheet specifies maximum storage time without clarifying the underlying chemical damage occurring near lower voltage limits. When a cell self-discharges past its minimum safe storage threshold, non-recoverable physical changes commence immediately, even if the external open-circuit voltage appears marginally acceptable on a basic digital multimeter at incoming inspection.
In high-nickel chemistries, residual lithium compounds on the cathode particle surfaces react with carbon dioxide and moisture that permeate cell packaging during prolonged storage. Lithium carbonate and lithium hydroxide layers build up on cathode surfaces, forming an insulating barrier that blocks lithium-ion insertion pathways. This surface contamination increases charge-transfer resistance, elevates baseline operational cell temperature, and triggers gas evolution when the cell undergoes its first recharge after extended warehousing.
To demonstrate the impact of low-voltage storage on current collector degradation and microstructural integrity, the table below outlines specific degradation thresholds, physical mechanisms, and operational consequences across cell voltage regimes.
| Voltage Window (V) | Microstructural Mechanism | Physical Condition | Impact on DCIR | Safety Consequences |
|---|---|---|---|---|
| 3.0 to 4.2 | Normal passivation stability | Stable foil and interface layers | Baseline increase | Negligible safety risk |
| 2.5 to 3.0 | Mild transition metal leaching | Trace loss of cyclable lithium | 5% to 15% growth | Minor capacity loss |
| 2.0 to 2.5 | Accelerated solid interphase collapse | Active material delamination | 20% to 40% growth | Elevated heat evolution |
| 1.5 to 2.0 | Anode potential exceeds 3.5V vs Li | Onset of copper foil dissolution | 50% to 100% growth | High risk of copper dendrites |
| 0.0 to 1.5 | Severe copper oxidation and gas release | Perforated copper substrate, structural collapse | > 200% growth | Immediate internal shorting on recharge |
Quantitative analysis shows that dropping cell voltage below 2.0 volts during storage alters failure modes fundamentally. Above 2.5 volts, degradation primarily consumes cyclable lithium and thickens surface layers, increasing internal resistance moderately. Once voltage drops below 2.0 volts, the destruction of the copper current collector substrate introduces permanent structural defects and severe safety hazards that cannot be remediated through standard electrical conditioning cycles.
Electrolyte drying caused by parasitic chemical reactions during extended storage alters liquid transport properties within the porous electrode matrix. Electrolyte solvent molecules react with reactive surface sites, producing solid precipitation products within pore networks. Reduced electrolyte volume creates dry spots where ionic transfer ceases entirely.
These dry zones force operating current into remaining wetted electrode regions, increasing localized current density, accelerating hot-spot formation, and inducing localized lithium plating during high-rate charging cycles.
Standard quality control audits routinely uncover discrepancies between datasheet physical tolerances and real-world cell degradation after six months of warehousing. Cell manufacturers account for these physical degradation pathways by incorporating specific exclusion clauses within their technical delivery conditions. Master procurement agreements specify that storing cells below two point five volts for longer than thirty days completely voids manufacturer liability for internal short-circuit failures, swelling, or thermal runaway events during pack assembly.
Dock
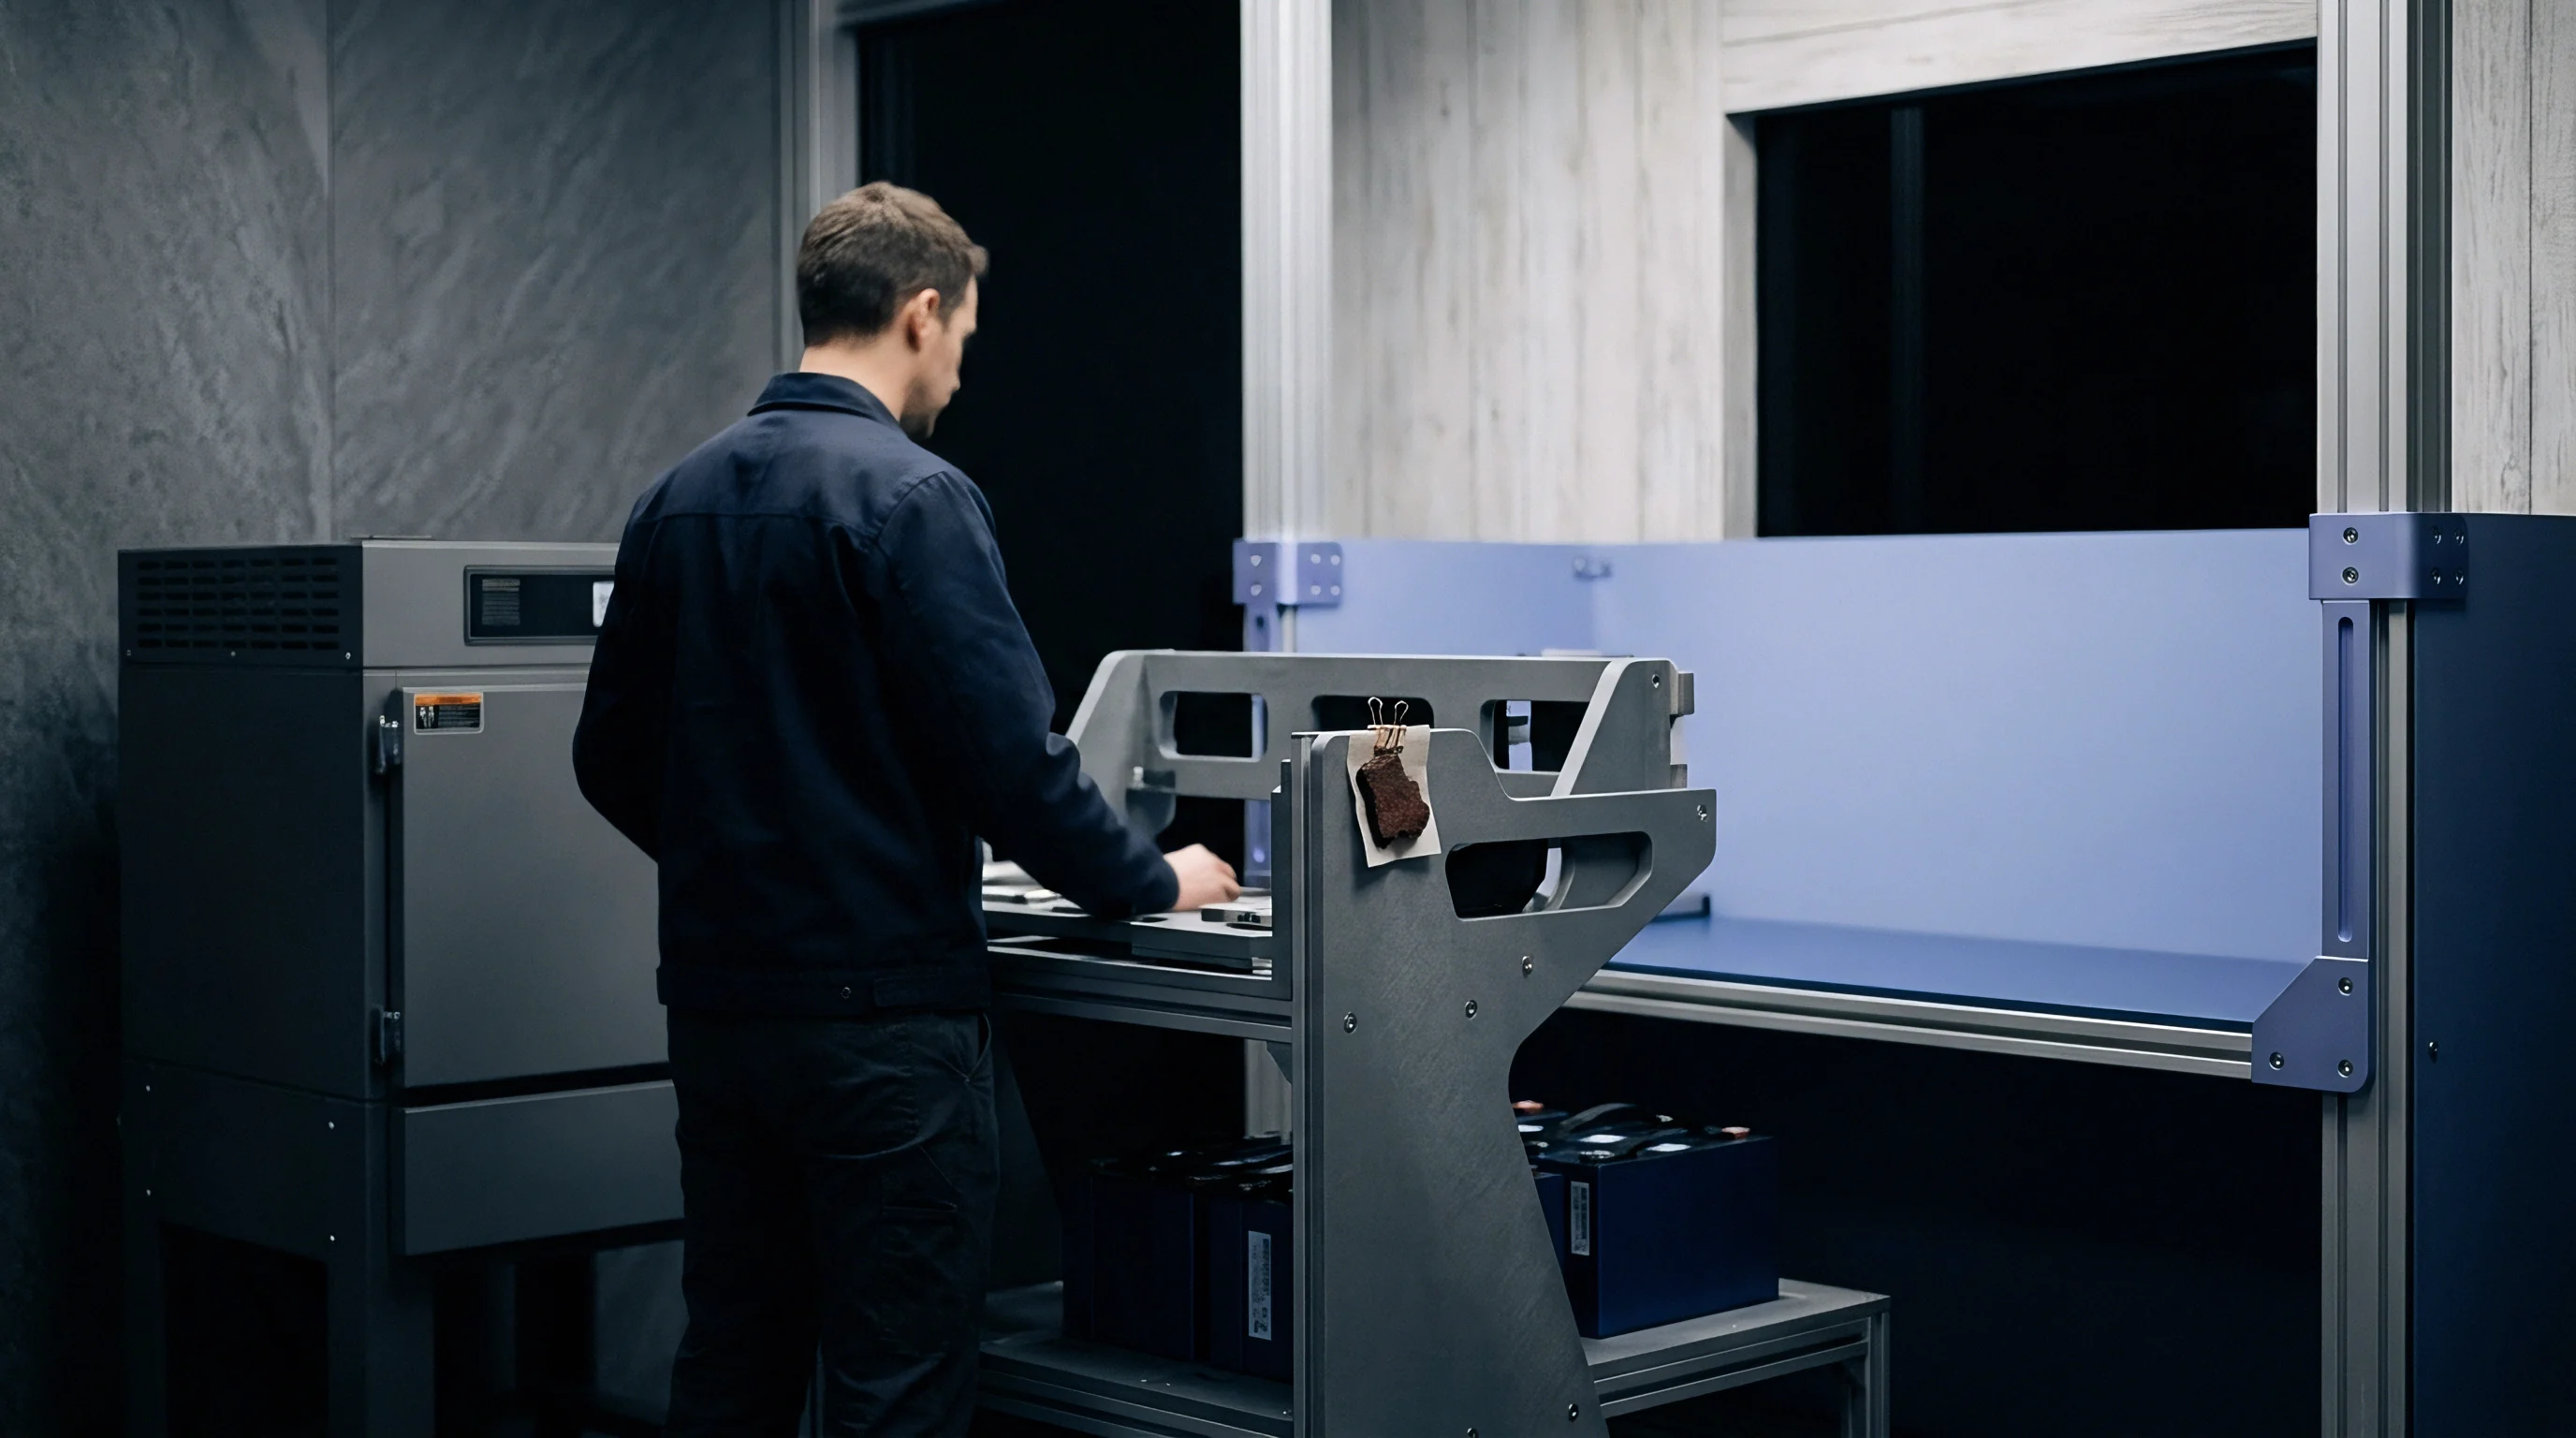
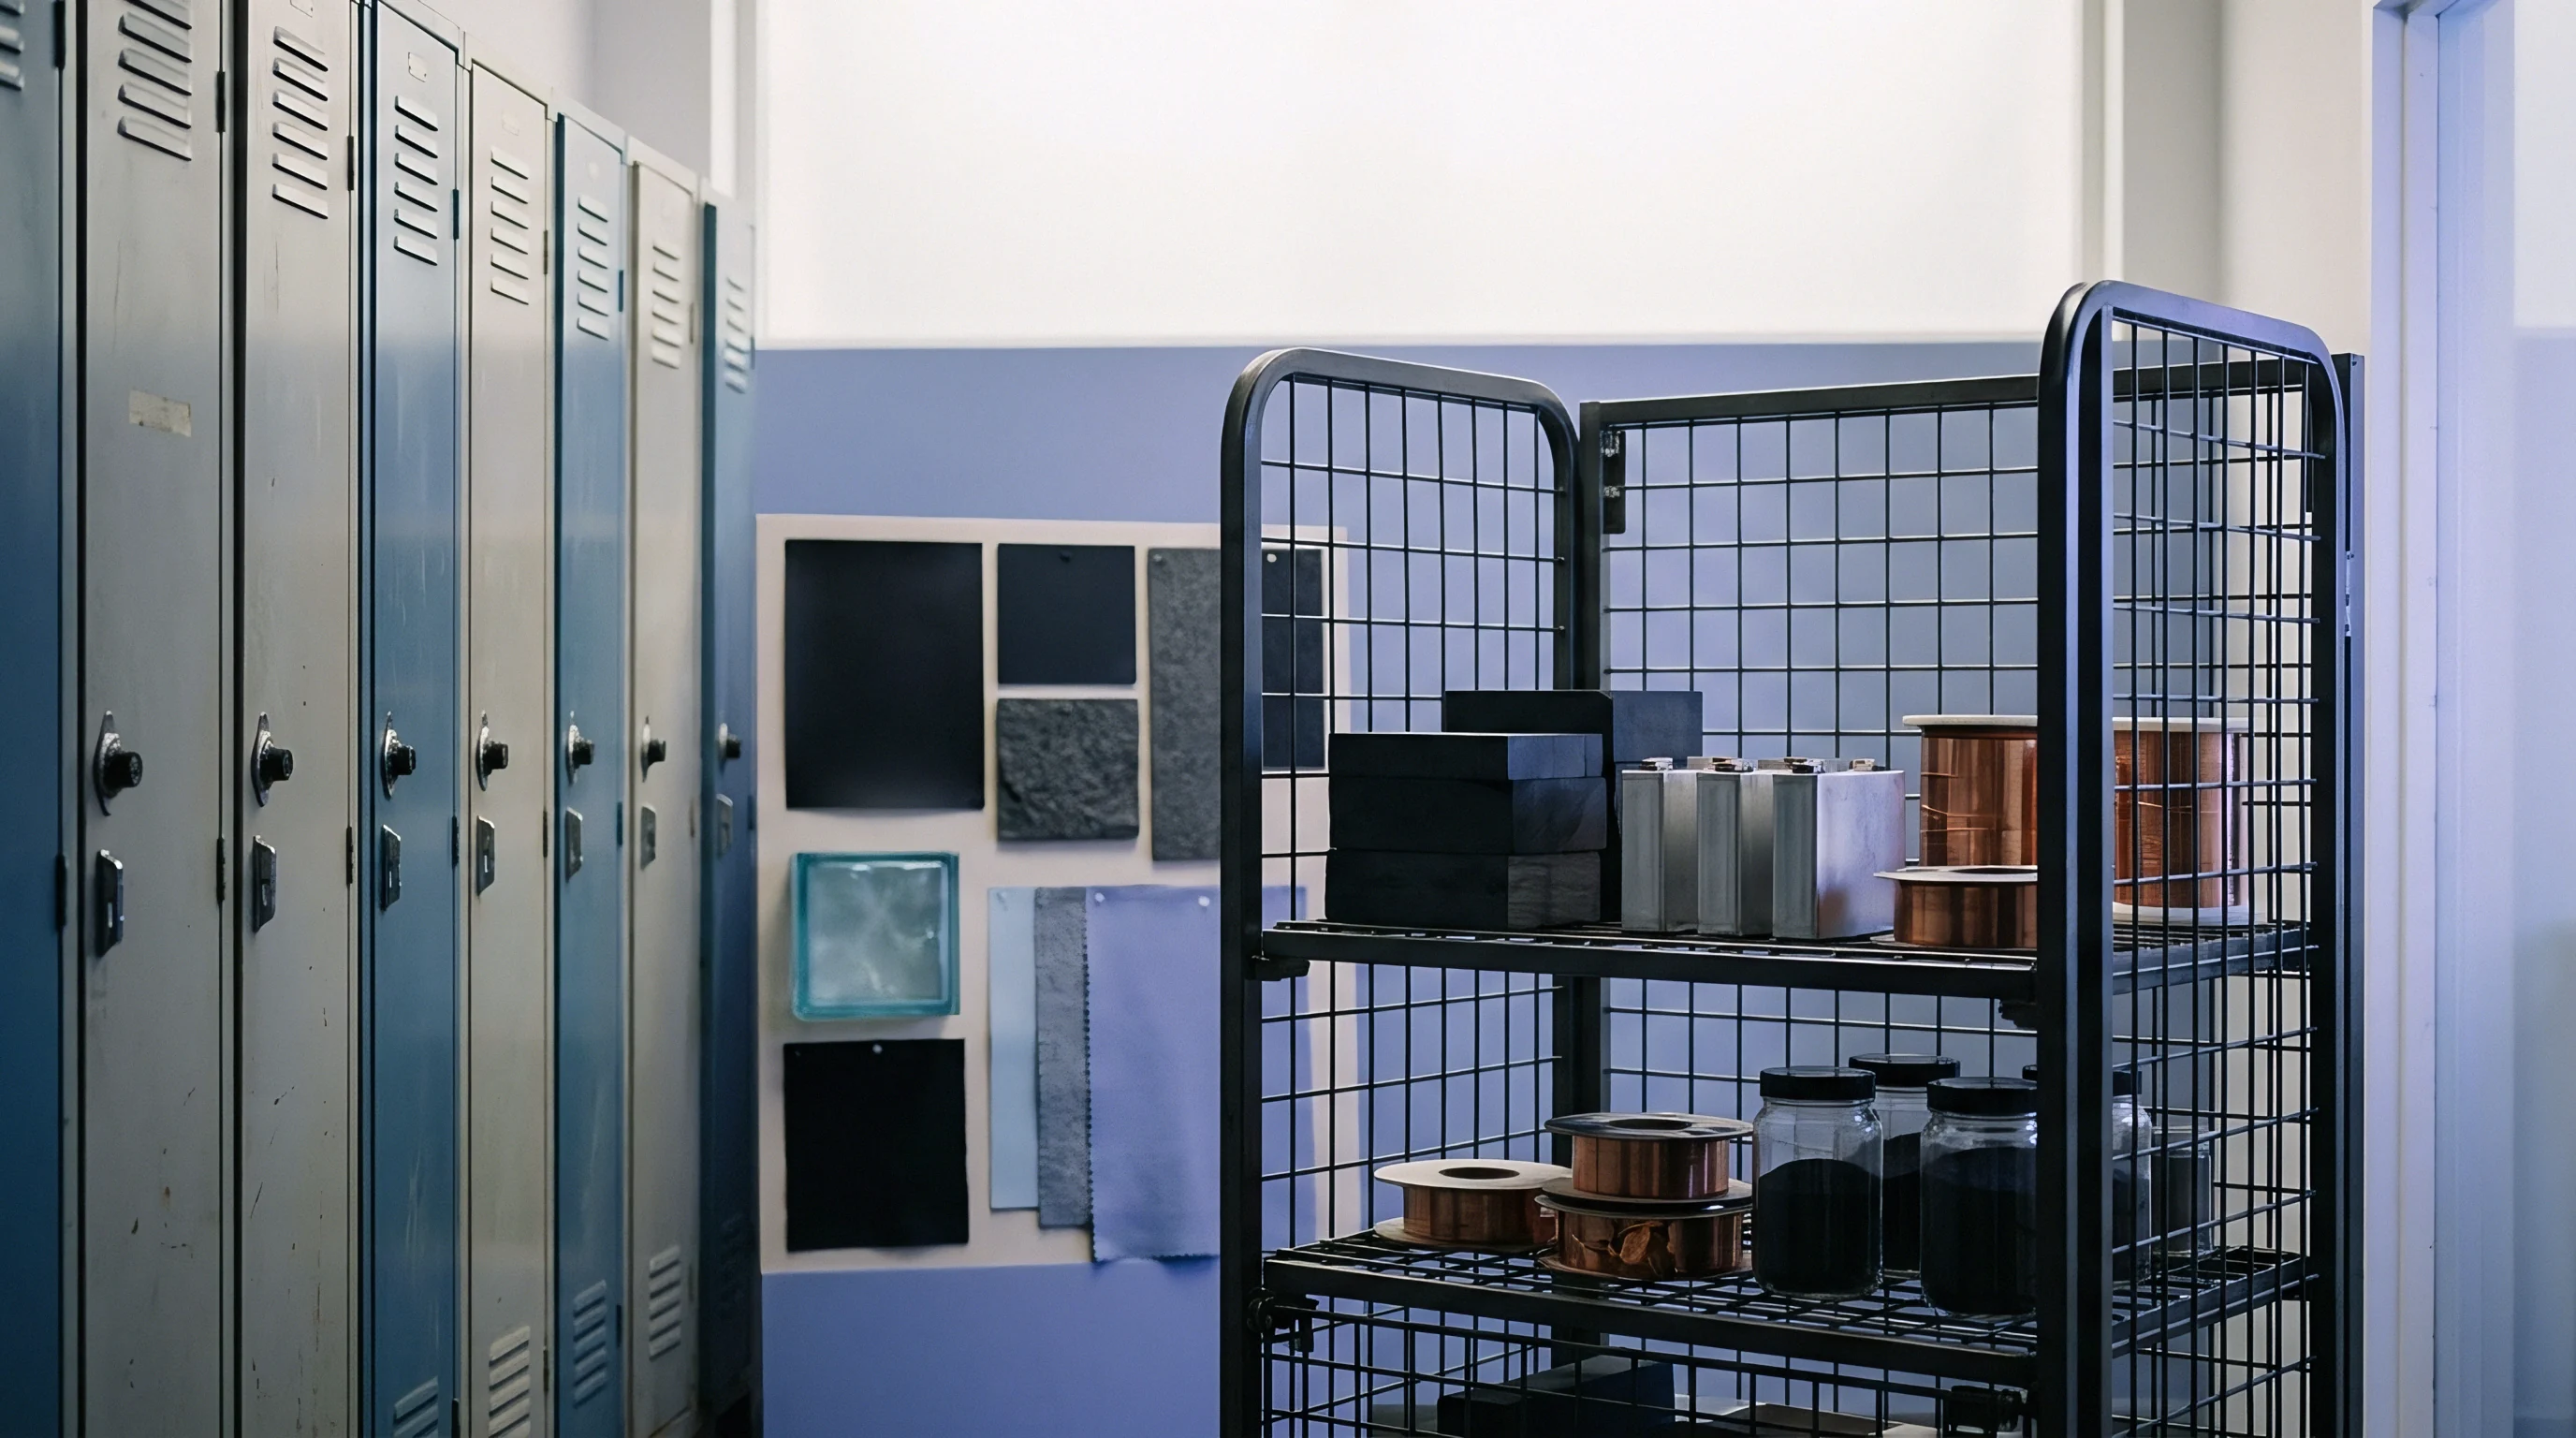
Incoming cell batches arrive at factory receiving docks inside heavy cardboard crates or wooden master cartons lined with vacuum-sealed anti-static packaging. Receiving inspection protocols must evaluate whether a shipment retained its physical and chemical integrity throughout marine and terrestrial logistics routes. Simple voltage spot-checks fail to reveal hidden internal damage, calendar aging degradation, or accelerated self-discharge trends induced by ambient thermal stress during transit.
A standardized receiving protocol begins with physical packaging evaluation, date code auditing, and statistical sampling designed under international acceptance criteria. Engineers calculate required sample sizes based on shipment volume to detect statistical distribution shifts across production lots. Sampling strategies must balance testing costs against the financial risk of introducing compromised cells into automated pack assembly lines.
Inspecting twelve cells from a shipment of fifty thousand yields useless statistical data; rigorous sampling requires structured lot selection across multiple master pallets.
Date code verification provides immediate baseline context for incoming quality screening. Manufacturers print alphanumeric date codes on individual cell sleeves or etch matrix codes directly onto aluminum casings. Decoding these production markers establishes true cell age before testing begins.
Datasheets imply that shelf life starts upon receipt, yet cells frequently spend three to five months moving through factory storage, domestic transfer, export consolidation, and maritime transport before arriving at the buyer facility. A cell received today may already have consumed forty percent of its allowable calendar shelf life sitting in origin supply chain nodes.
Open-circuit voltage screening at the dock isolates cells exhibiting abnormal self-discharge profiles. While all secondary cells undergo slow self-discharge during storage, uniform batches demonstrate minimal voltage dispersion across individual units. Calculating the rate of open-circuit voltage decay over time, known as the K-value expressed in millivolts per day, identifies units with internal micro-shorts or localized passivation layer collapse.
Screening for K-value variation requires measuring open-circuit voltage at receiving, holding cells in a climate-controlled room for fourteen days, and measuring voltage again on identical precision digital meters.

Does Storage Temperature Overrule State of Charge?
Storage temperature exerts a significantly larger influence on long-term capacity retention and internal resistance growth than state of charge across typical storage windows. High ambient temperatures accelerate chemical degradation kinetics exponentially following the Arrhenius law, whereas state of charge variations alter thermodynamic reaction potentials linearly. Storing a cell at thirty-five degrees Celsius and thirty percent state of charge causes more severe permanent capacity loss and resistance growth over six months than storing the same cell at fifteen degrees Celsius and eighty percent state of charge.
Thermal management during warehousing serves as the primary defense against accelerated calendar aging.
Impedance screening provides immediate insight into internal chemical degradation that open-circuit voltage measurements completely miss. Dock inspection protocols must include both high-frequency alternating current impedance at one kilohertz and direct current internal resistance measurements. Alternating current impedance measures ohmic resistance across electrolyte, current collectors, and separator interfaces.
Direct current internal resistance measures charge-transfer kinetics and mass transport limitations at electrode surfaces. An incoming cell lot exhibiting normal open-circuit voltage combined with elevated direct current resistance indicates significant solid electrolyte interphase thickening and calendar aging during transit.
The dock inspection process follows this standard receiving sequence to catch aged cell lots before inventory enters the manufacturing warehouse:
- Verify master packaging seal integrity, internal humidity indicator cards, date codes, and shipping temperature loggers across all master pallets.
- Extract statistical sample quantities dictated by ANSI/ASQ Z1.4 Inspection Level II normal single sampling plans across diverse pallet locations.
- Stabilize sample cells in a temperature-controlled environment at twenty-three degrees Celsius for twenty-four hours before testing.
- Measure and record initial open-circuit voltage to five decimal places using a calibrated digital multimeter.
- Measure alternating current impedance at one kilohertz using a precision meter to evaluate electronic conductivity.
- Execute a single pulsed direct current discharge test on a sample channel to calculate internal resistance at ten seconds.
- Place sample cells into a controlled storage chamber at twenty-three degrees Celsius for fourteen days without electrical load.
- Re-measure open-circuit voltage, calculate lot K-value dispersion, and reject shipments exceeding statistical control thresholds.
Open-circuit voltage drops that exceed baseline statistical variation within two weeks of receipt signal separator contamination or active parasitic leakage paths.
Data loggers placed inside ocean containers provide unimpeachable evidence during supply chain liability disputes. Thermal records prove whether transit conditions remained within contracted limits. Ocean containers sitting on dock aprons under direct summer sunlight reach internal temperatures exceeding sixty degrees Celsius.
Exposure to sixty-degree thermal conditions for even forty-eight hours causes rapid electrolyte breakdown, separator deformation, and severe passivating layer degradation that permanently compromises cell reliability. When transit logs reveal thermal excursions above contract thresholds, incoming quality control holds the entire shipment for exhaustive laboratory qualification.
A batch of 40,000 prismatic cells was rejected after test channels revealed an average K-value exceeding 1.8 millivolts per day across forty-eight hours. The factory date code confirmed the cells were manufactured eleven months prior to delivery, having spent eight months stored in an unconditioned regional distributor warehouse. The excessive self-discharge rate indicated internal separator damage caused by prolonged storage at elevated states of charge, forcing a full lot rejection before the cells reached the module welding line.
Capacity verification testing requires subjecting a statistically representative sample to automated charge and discharge cycling under strict thermal conditions. Dock protocols execute a standard three-cycle test: a baseline charge, a standard C-rate discharge to measure present usable capacity, and a final storage-level charge before returning units to inventory. Comparing measured discharge capacity against datasheet nameplate capacity exposes the exact percentage of non-recoverable calendar loss incurred during transit and storage.
Lots failing to meet ninety-seven percent of initial rated capacity at receiving require commercial escalation.
Advanced diagnostic techniques, such as differential voltage analysis, allow receiving laboratories to identify specific degradation mechanisms without destroying incoming sample cells. By plotting the derivative of voltage with respect to capacity against total cell potential during low-rate charging, diagnostic software extracts distinct chemical peaks corresponding to specific electrode phase transitions. A reduction in peak height pinpoints active cathode or anode mass loss, while a shift in peak location quantifies cyclable lithium loss.
Differential voltage analysis transforms basic charge-discharge data into a clear diagnostic picture of internal calendar degradation.
The incoming quality screening table below summarizes acceptance criteria, testing metrics, and threshold boundaries used to grade cell shipments at factory receiving docks.
| Inspection Metric | Measurement Tool | Acceptable Limit | Warning Boundary | Rejection Threshold |
|---|---|---|---|---|
| Open-Circuit Voltage | Precision DMM (5.5 digit) | 3.60V to 3.65V | 3.50V to 3.59V | < 3.50V or > 3.70V |
| K-Value Decay Rate | Delta OCV over 14 days | < 0.3 mV/day | 0.3 to 0.8 mV/day | > 0.8 mV/day |
| AC Impedance (1 kHz) | AC Milliohm Meter | < 12.0 mΩ | 12.0 to 14.5 mΩ | > 14.5 mΩ |
| 10-Second DCIR | Automated Battery Cycler | < 25.0 mΩ | 25.0 to 30.0 mΩ | > 30.0 mΩ |
| Usable Capacity | 0.5C Standard Discharge | > 98.0% rated | 95.0% to 97.9% rated | < 95.0% rated |
| Mechanical Swelling | Laser Micrometer | < 1.5% thickness | 1.5% to 3.0% thickness | > 3.0% thickness |
Applying rigorous dock screening prevents sub-standard or aged cells from entering production lines. Sourcing practices must enforce quantitative thresholds to protect pack manufacturing quality, ensuring every cell entering module assembly matches electrical baseline specifications. When dock testing flags elevated impedance or high K-value metrics, commercial teams use those findings to demand immediate financial compensation, re-grading discounts, or lot replacements from cell suppliers.
Unpack incoming shipments immediately if transit logs indicate moisture exposure or physical container damage during ocean transport. Water ingress accelerates outer casing corrosion, damages safety vent membranes, and compromises terminal weld surfaces. Physical inspection must confirm that terminal contacts remain pristine, showing zero signs of surface oxidation, pitting, or chemical discoloration before cells move into production inventory.
When dock screening isolates a shipment with borderline performance metrics, a buyer can choose to recondition the lot through controlled electrical conditioning cycles. Reconditioning involves discharging cells at slow rates down to low-voltage thresholds, executing controlled slow recharges, and holding cells at thirty percent state of charge in climate-controlled storage for seven days. While reconditioning restores a portion of reversible self-discharge loss, it cannot reverse structural binder damage, current collector pitting, or permanent lithium inventory depletion.
Warehouse staging practices dictate that incoming cell inventory must follow strict first-in, first-out allocation rules to prevent inventory aging disparities. Storing incoming pallets without date code tracking causes older cell lots to remain on warehouse racks while newer shipments move directly into production. Mixed-age inventory inside automated pack assembly leads to severe module balancing problems, premature pack capacity degradation, and elevated warranty claims in the field.
When receiving inspection isolates a lot with elevated K-value dispersion across sample groups, temporary voltage instability can reflect benign electrode relaxation following transportation vibration rather than structural breakdown, though clearing such lots without verification introduces significant risk.

Ledger
The financial impact of cell storage shelf life extends far beyond bulk capacity degradation metrics printed on technical specification sheets. Cell purchasing represents the largest single cost component in battery pack manufacturing, accounting for fifty to seventy percent of total bill-of-materials expenditure. When cells sit in transit hubs, regional distribution centers, or production line warehouses for extended durations, calendar aging continuously erodes the net present value of those capital assets, alters warranty timelines, and inflates landed energy costs per delivered kilowatt-hour over project lifespans.
Inventory carrying costs for lithium-ion cells include direct financial interest, climate-controlled warehousing overhead, insurance premiums, specialized hazardous materials storage compliance, and direct asset depreciation. Maintaining climate-controlled warehouse spaces at optimal temperatures between fifteen and twenty degrees Celsius increases operational facility expenses significantly compared to standard dry storage. Storing cells without climate control reduces facility costs while accelerating calendar degradation, converting saved warehouse overhead into massive product warranty liabilities when finished packs degrade prematurely in field applications.
Cell age reduces usable project life before the end product leaves the factory floor. Energy storage system procurement contracts specify performance guarantees, demanding that battery packs maintain eighty percent of initial nameplate capacity after ten years or four thousand operational cycles. If cells spend nine months in intermediate storage prior to module assembly, that calendar aging consumes nearly eight percent of total project operational lifecycle.
To meet contractual field longevity guarantees using aged cells, system integrators must over-provision initial battery pack capacity, adding extra parallel cell strings to compensate for storage-induced capacity loss. Over-provisioning directly inflates upfront hardware costs and increases pack weight and volume.
Stored cell inventory loses market value faster through warranty period contraction than through physical capacity loss.
Warranty terms written by cell manufacturers strictly tie coverage duration to production date codes rather than cell commissioning dates. Standard cell purchase agreements dictate that eighteen-month warranty coverage commences immediately upon factory release. If maritime logistics, customs clearance, and warehouse staging consume six months, the effective usable warranty coverage available to the pack builder contracts to twelve months.
Shrinking warranty windows force pack integrators to absorb long-term field failure risks or purchase costly extended warranty coverage from third-party underwriters.
Structuring supply contracts with explicit shelf-life decay allowances protects against landed cost inflation. Contracts specify that cell shipments arriving more than ninety days past factory formation incur mandatory price discounts calculated per day of delay. This financial mechanism forces suppliers to optimize their logistics chains, clear distribution bottlenecks, and deliver fresh inventory that preserves maximum calendar life for end-user applications.
Landed cost calculations must factor in the total cost of delivered energy over project lifespans rather than simple upfront cost per kilowatt-hour at the factory gate. Aged cells exhibit elevated direct current internal resistance, which increases thermal energy losses during charge and discharge operations. Over a ten-year operational lifespan, higher internal resistance reduces round-trip energy efficiency by two to four percent across an industrial energy storage installation.
That efficiency drop translates into hundreds of thousands of dollars in lost operational revenue, drastically changing project economics calculated during initial capital expenditure planning.
The financial matrix below outlines how prolonged warehousing duration impacts inventory asset value, warranty coverage, required pack capacity over-provisioning, and effective levelized cost of energy storage.
| Storage Duration (Months) | Capacity Retention (%) | Usable Warranty (Months) | Asset Value Discount (%) | Required Over-Provision (%) | LCOS Increase (%) |
|---|---|---|---|---|---|
| 1 | 99.5 | 17 | 0.0 | 0.0 | 0.0 |
| 3 | 98.5 | 15 | 2.5 | 1.5 | 1.2 |
| 6 | 96.8 | 12 | 7.0 | 3.8 | 3.5 |
| 9 | 94.5 | 9 | 14.0 | 6.5 | 6.8 |
| 12 | 91.8 | 6 | 22.0 | 10.2 | 11.4 |
| 18 | 85.0 | 0 | 45.0 | 18.5 | 22.1 |
The economic data demonstrates that holding cell inventory for twelve months reduces physical capacity by roughly eight percent while reducing economic value by twenty-two percent. This value collapse reflects shortened warranty periods, elevated internal resistance losses, and the extra capital expenditure required to over-provision battery packs to meet long-term field performance guarantees. Sourcing teams that evaluate cell orders purely on initial purchase price ignore these substantial downstream financial liabilities.
To mitigate the financial impact of storage-induced cell degradation, procurement teams must implement dynamic pricing agreements linked directly to incoming receiving quality audits. Contracts should define clear price adjustment tiers based on tested capacity, internal resistance metrics, and cell age upon arrival at the manufacturing dock. When dock testing reveals capacity retention below ninety-eight percent, automated contract clauses trigger unit price write-downs or lot returns at supplier expense.
Re-grading aged inventory provides a path to recover capital value from cell lots that fail top-tier application specifications. Cells stored beyond optimal shelf life can be re-classified from primary automotive EV grade to secondary stationary storage or backup power grades. Re-grading requires complete electrical testing, capacity binning, internal resistance sorting, and updating system management parameters to match altered cell characteristics.
While re-grading incurs testing labor costs, it prevents complete inventory write-offs and aligns cell performance profiles with less demanding operational duty cycles.
When evaluating aged cell inventory, operations teams use this decision checklist to decide whether batches clear for primary production, shift to secondary uses, or go back to suppliers:
- Date code validation establishes true calendar age, confirming total months elapsed since factory formation against master purchase agreement limits.
- Capacity decay calculation compares measured single-cell discharge capacity against baseline nameplate figures to establish permanent non-recoverable loss percentages.
- Direct current resistance delta measures the percentage increase in internal resistance against baseline formation values to evaluate power delivery limits.
- K-value statistical dispersion screens incoming lots for self-discharge rate outliers that indicate internal structural micro-defects or safety risks.
- Remaining warranty calculation evaluates residual manufacturer warranty coverage duration to assess field liability exposure for finished products.
- Secondary market valuation determines net salvage value achievable through re-grading aged cells into low-rate stationary storage products.
Accounting practices must reflect physical calendar aging directly on company balance sheets through inventory depreciation reserves. Standard financial accounting treats stored battery cells as static assets until physical assembly or sale occurs. Treating aged cell inventory as static assets overstates company balance sheet value, creating abrupt write-downs when production teams reject aged cell batches during pack manufacturing.
Establishing calendar-based depreciation schedules aligns inventory asset valuation with underlying physical degradation kinetics.
Landed-cost models must include salvage costs associated with recycling severely aged or defective cells that cannot be re-conditioned or re-graded. Transporting lithium-ion cells for recycling requires hazardous waste shipping documentation, specialized packaging, and compliance with local environmental disposal regulations. Recycling fees charge per kilogram of cell mass, adding direct expense to inventory disposal operations.
Sourcing practice financial risk models must incorporate potential disposal costs when evaluating bulk spot-market cell purchases offered at steep distributor discounts.
The total cost of ownership for a battery asset depends on rigorous alignment between electrochemistry selection, logistics control, dock verification, and commercial contract drafting. Sourcing teams that look past basic single-line datasheet claims build robust procurement workflows capable of managing calendar degradation, protecting product margins, and delivering reliable field performance across full operational lifespans.
A supplier contract clause covering extended warehousing must state: If delivered cell lots exhibit age exceeding ninety calendar days from factory formation date, or if direct current internal resistance exceeds baseline specifications by more than fifteen percent at receiving dock inspection, the buyer retains the absolute right to reject the shipment in full, with all return freight costs, customs duties, and re-testing expenses charged directly to the seller account.