Dynamic Module Pressure Retention Limits under Lithium Metal Anode Cyclic Volumetric Strain
Dynamic module pressure retention requires continuous dynamic strain compensation to prevent lithium metal anode degradation and structural pack housing fatigue.


Swell
Solid lithium metal anodes undergo absolute volume change during electrochemical stripping and plating cycles. Unlike host-intercalation materials such as graphite or silicon-graphite blends, elemental lithium deposits directly on the current collector surface during charge. Pure lithium possesses a molar volume of 13.0 cm³/mol, producing a thickness growth of 4.85 µm for every 1.0 mAh/cm² of electrodeposited capacity.
A cell rated for 3.5 mAh/cm² areal capacity experiences 17.0 µm of single-sided anode expansion per cycle. In a stacked pouch cell containing 40 double-sided anode plates, total active stack thickness changes by 1.36 mm between full discharge and full charge states.
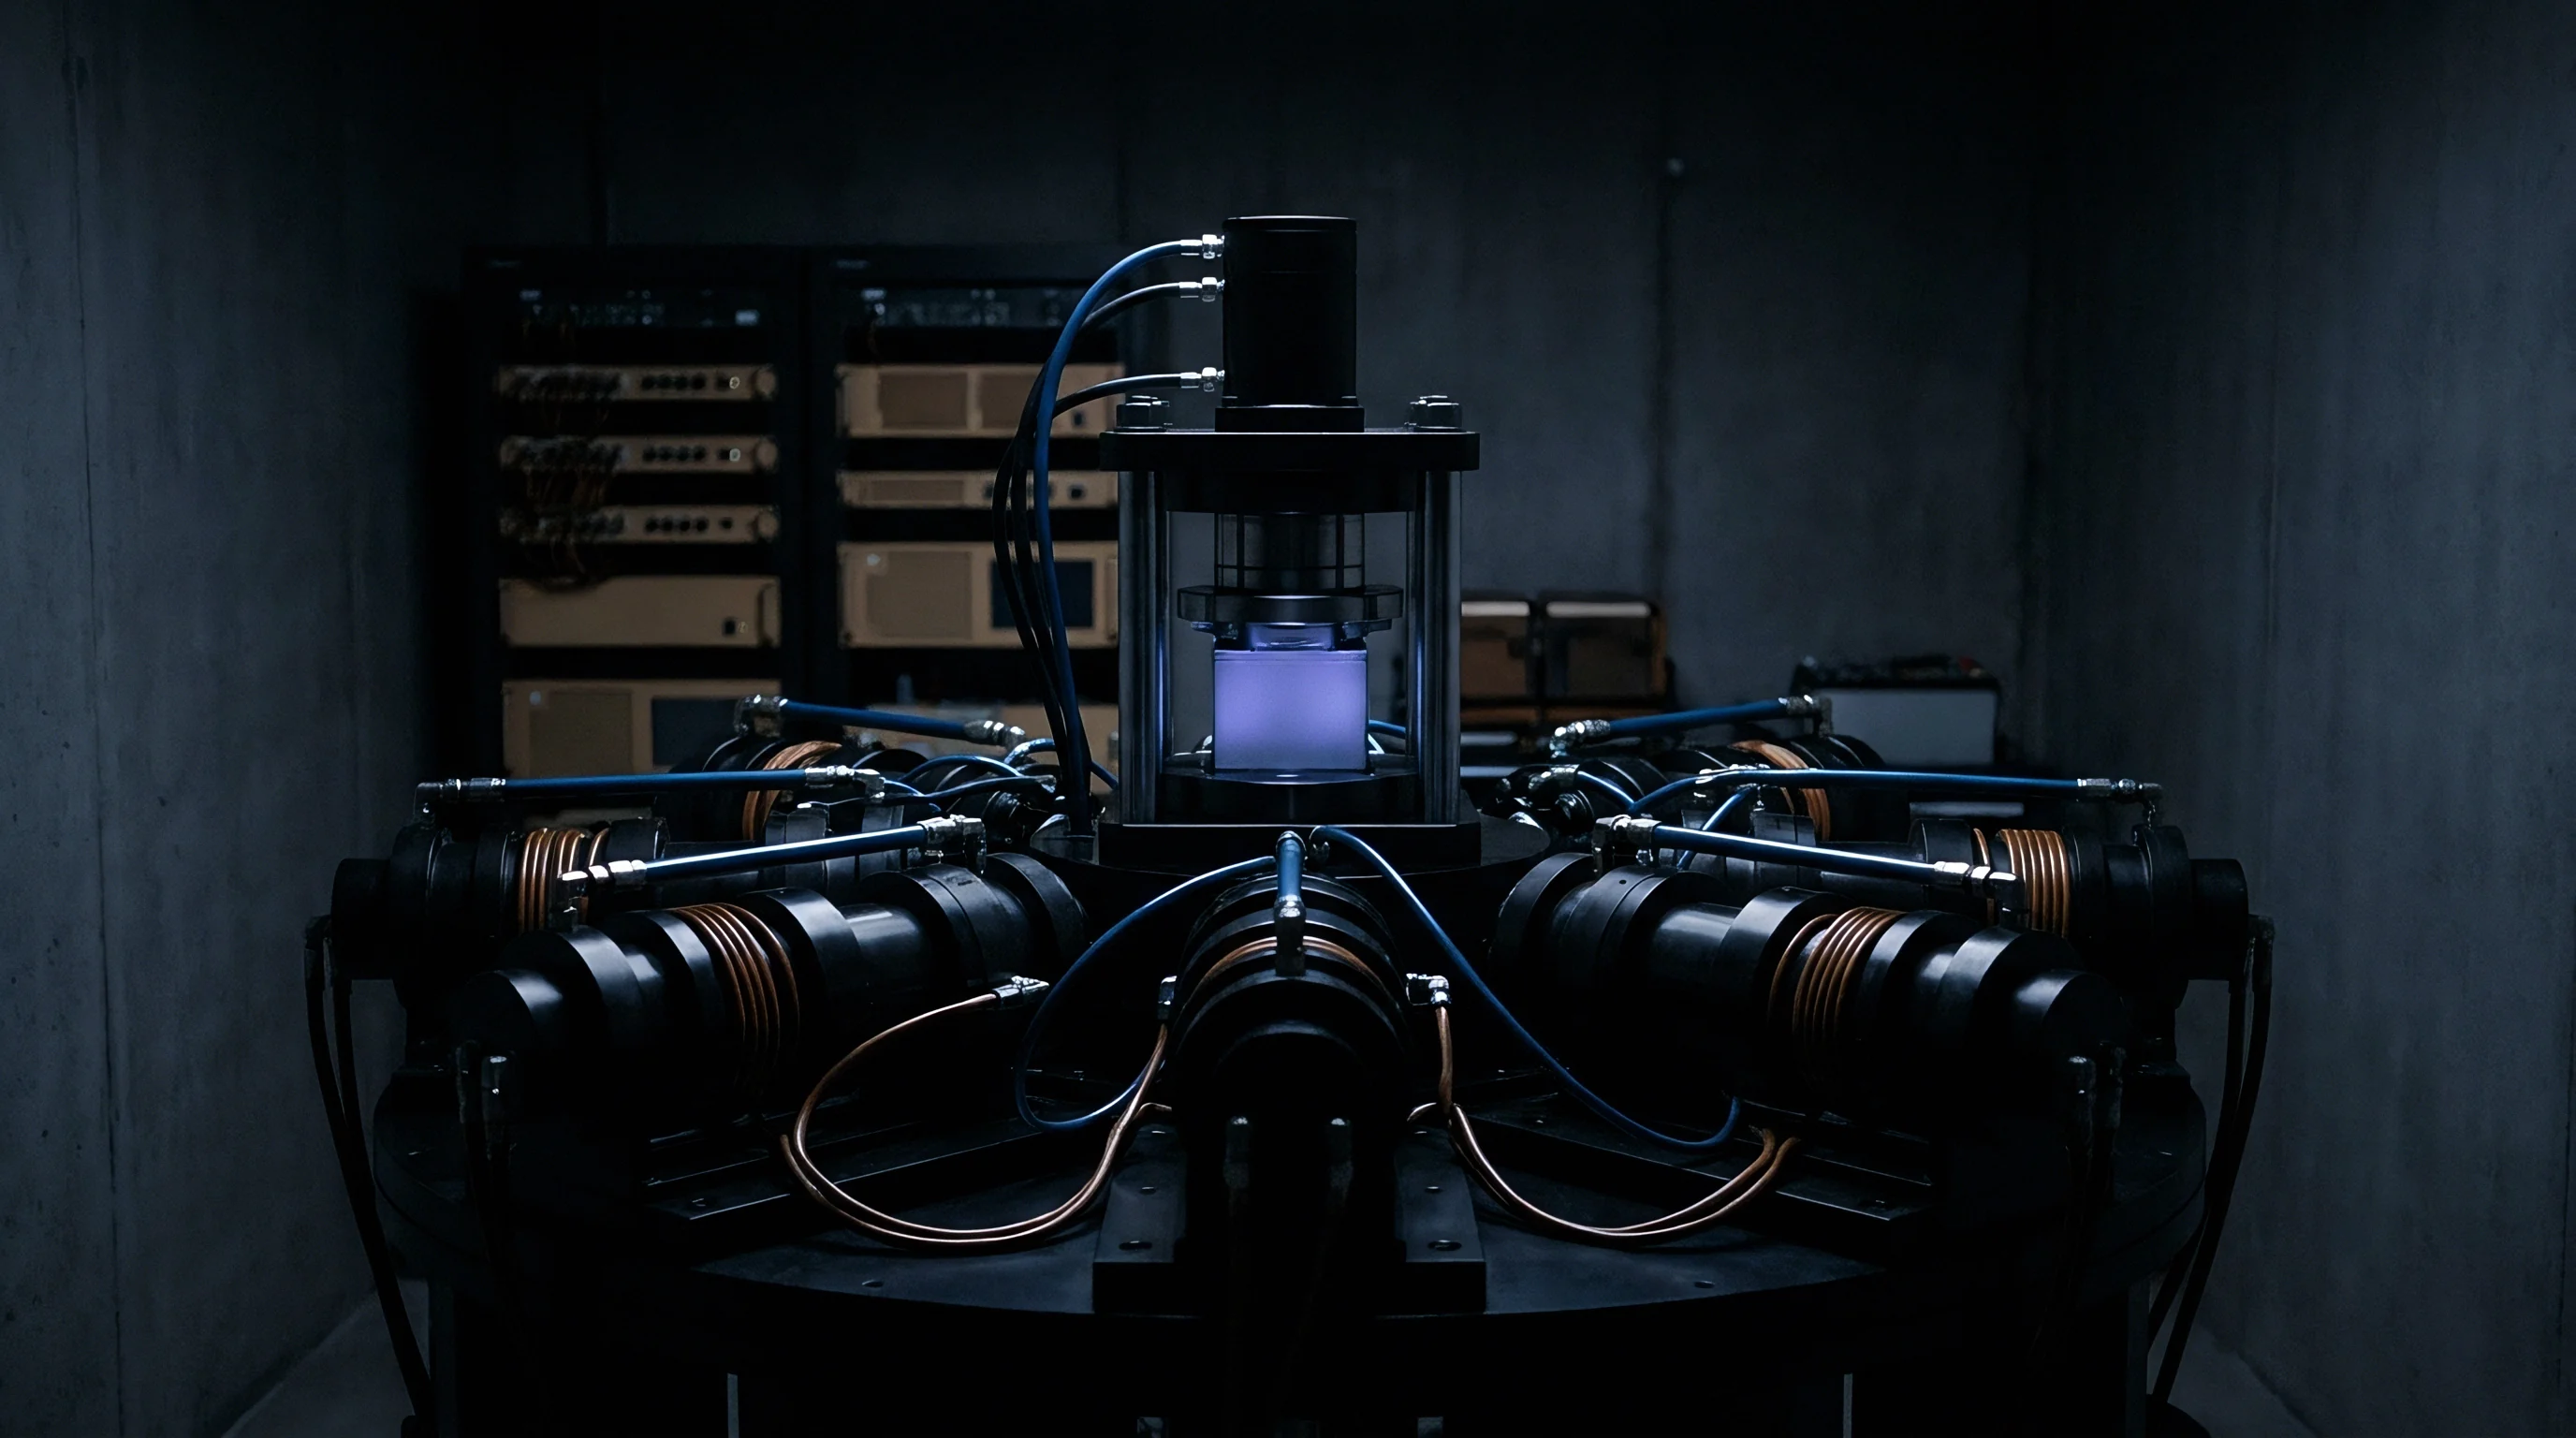
Unconstrained expansion forms porous, high-surface-area lithium structures known as mossy or dendritic lithium. These high-aspect structures react continuously with liquid organic carbonate electrolytes, consuming active lithium ions and solvent molecules while building a resistive solid electrolyte interphase layer. Applying continuous external compression forces microscopic lithium deposits to coalesce into high-density planar sheets during deposition cycles.
Electrochemical Pressure Windows
Maintaining structural surface contact demands precise boundary controls. Operational stack pressure ranges between a lower threshold of 0.3 MPa and an upper limit of 2.5 MPa. Below 0.3 MPa, interfacial contact between the plated lithium layer and the solid or liquid separator breaks down.
Microscopic voids coalesce at the interface, forcing localized current density to spike at remaining contact points. Elevated local current densities trigger localized dendrite growth that penetrates porous polymer separators.
Exceeding 2.5 MPa forces metallic lithium to creep plastically into separator pores. Plastic flow induces localized soft shorts through thin ceramic-coated polyolefin membranes. High pressure also accelerates structural degradation of solid-state ceramic separators, initiating intergranular cracking along grain boundaries.
Optimal dynamic pressure control targets a narrow operating band centered at 0.75 MPa throughout the charge-discharge cycle.
Applying continuous mechanical pre-charge of 0.75 MPa at 25 degrees Celsius retains 88 percent capacity over 600 cycles in 3.5 mAh/cm² pouch configurations.
The relationship between applied pressure, interfacial impedance, and lithium deposition morphology governs cell cycle life across standard operating temperatures.
| Applied Stack Pressure (MPa) | Anode Morphological State | Coulombic Efficiency (%) | Interfacial Resistance (Ω·cm²) | Cycle Life to 80% Retention |
|---|---|---|---|---|
| 0.10 | High-porosity mossy dendrites | 96.2 | 42.5 | 120 |
| 0.35 | Mixed planar and columnar lithium | 98.5 | 18.3 | 380 |
| 0.75 | Dense planar electrodeposition | 99.4 | 6.1 | 650 |
| 1.50 | Fully dense planar layer | 99.1 | 8.4 | 520 |
| 3.00 | Separator pore intrusion and creep | 94.8 | 24.6 | 95 |
Operating at constant mechanical volume rather than constant mechanical force creates self-defeating dynamics inside rigid module frames. Fixed-volume housings force internal stack pressure to escalate exponentially as the cell charges. A pouch cell expanding against an infinitely rigid boundary generates internal compressive stresses exceeding 8.0 MPa at 100 percent state of charge.
High internal force crushes internal current collectors, pinches edge fold margins, and accelerates electrolyte extrusion from porous separator structures.
Ignoring minimum load boundaries leads to uncontrolled dendrite propagation, internal electrical shorting, and premature thermal runaway during fast-charge cycling.


Cushion
Integrating elastic compliance layers within the module envelope compensates for dynamic thickness changes. Module designs place compressible foam pads or Belleville spring arrays adjacent to cell pouch surfaces. Elastic elements absorb cell expansion during charging, compressing to accommodate added stack width.
During discharge, stored strain energy pushes against cell faces, maintaining load above the minimum 0.3 MPa boundary.
Selection of dynamic cushioning material governs stress evolution across extended cycling sequences. Microcellular polyurethane foams, silicone sponges, and closed-cell fluoroelastomers exhibit varied compression deflection behaviors. The tangent modulus of microcellular polyurethane increases dramatically beyond 40 percent compressive strain, causing rapid pressure spikes near top-of-charge states.
Viscoelastic Relaxation Kinetics
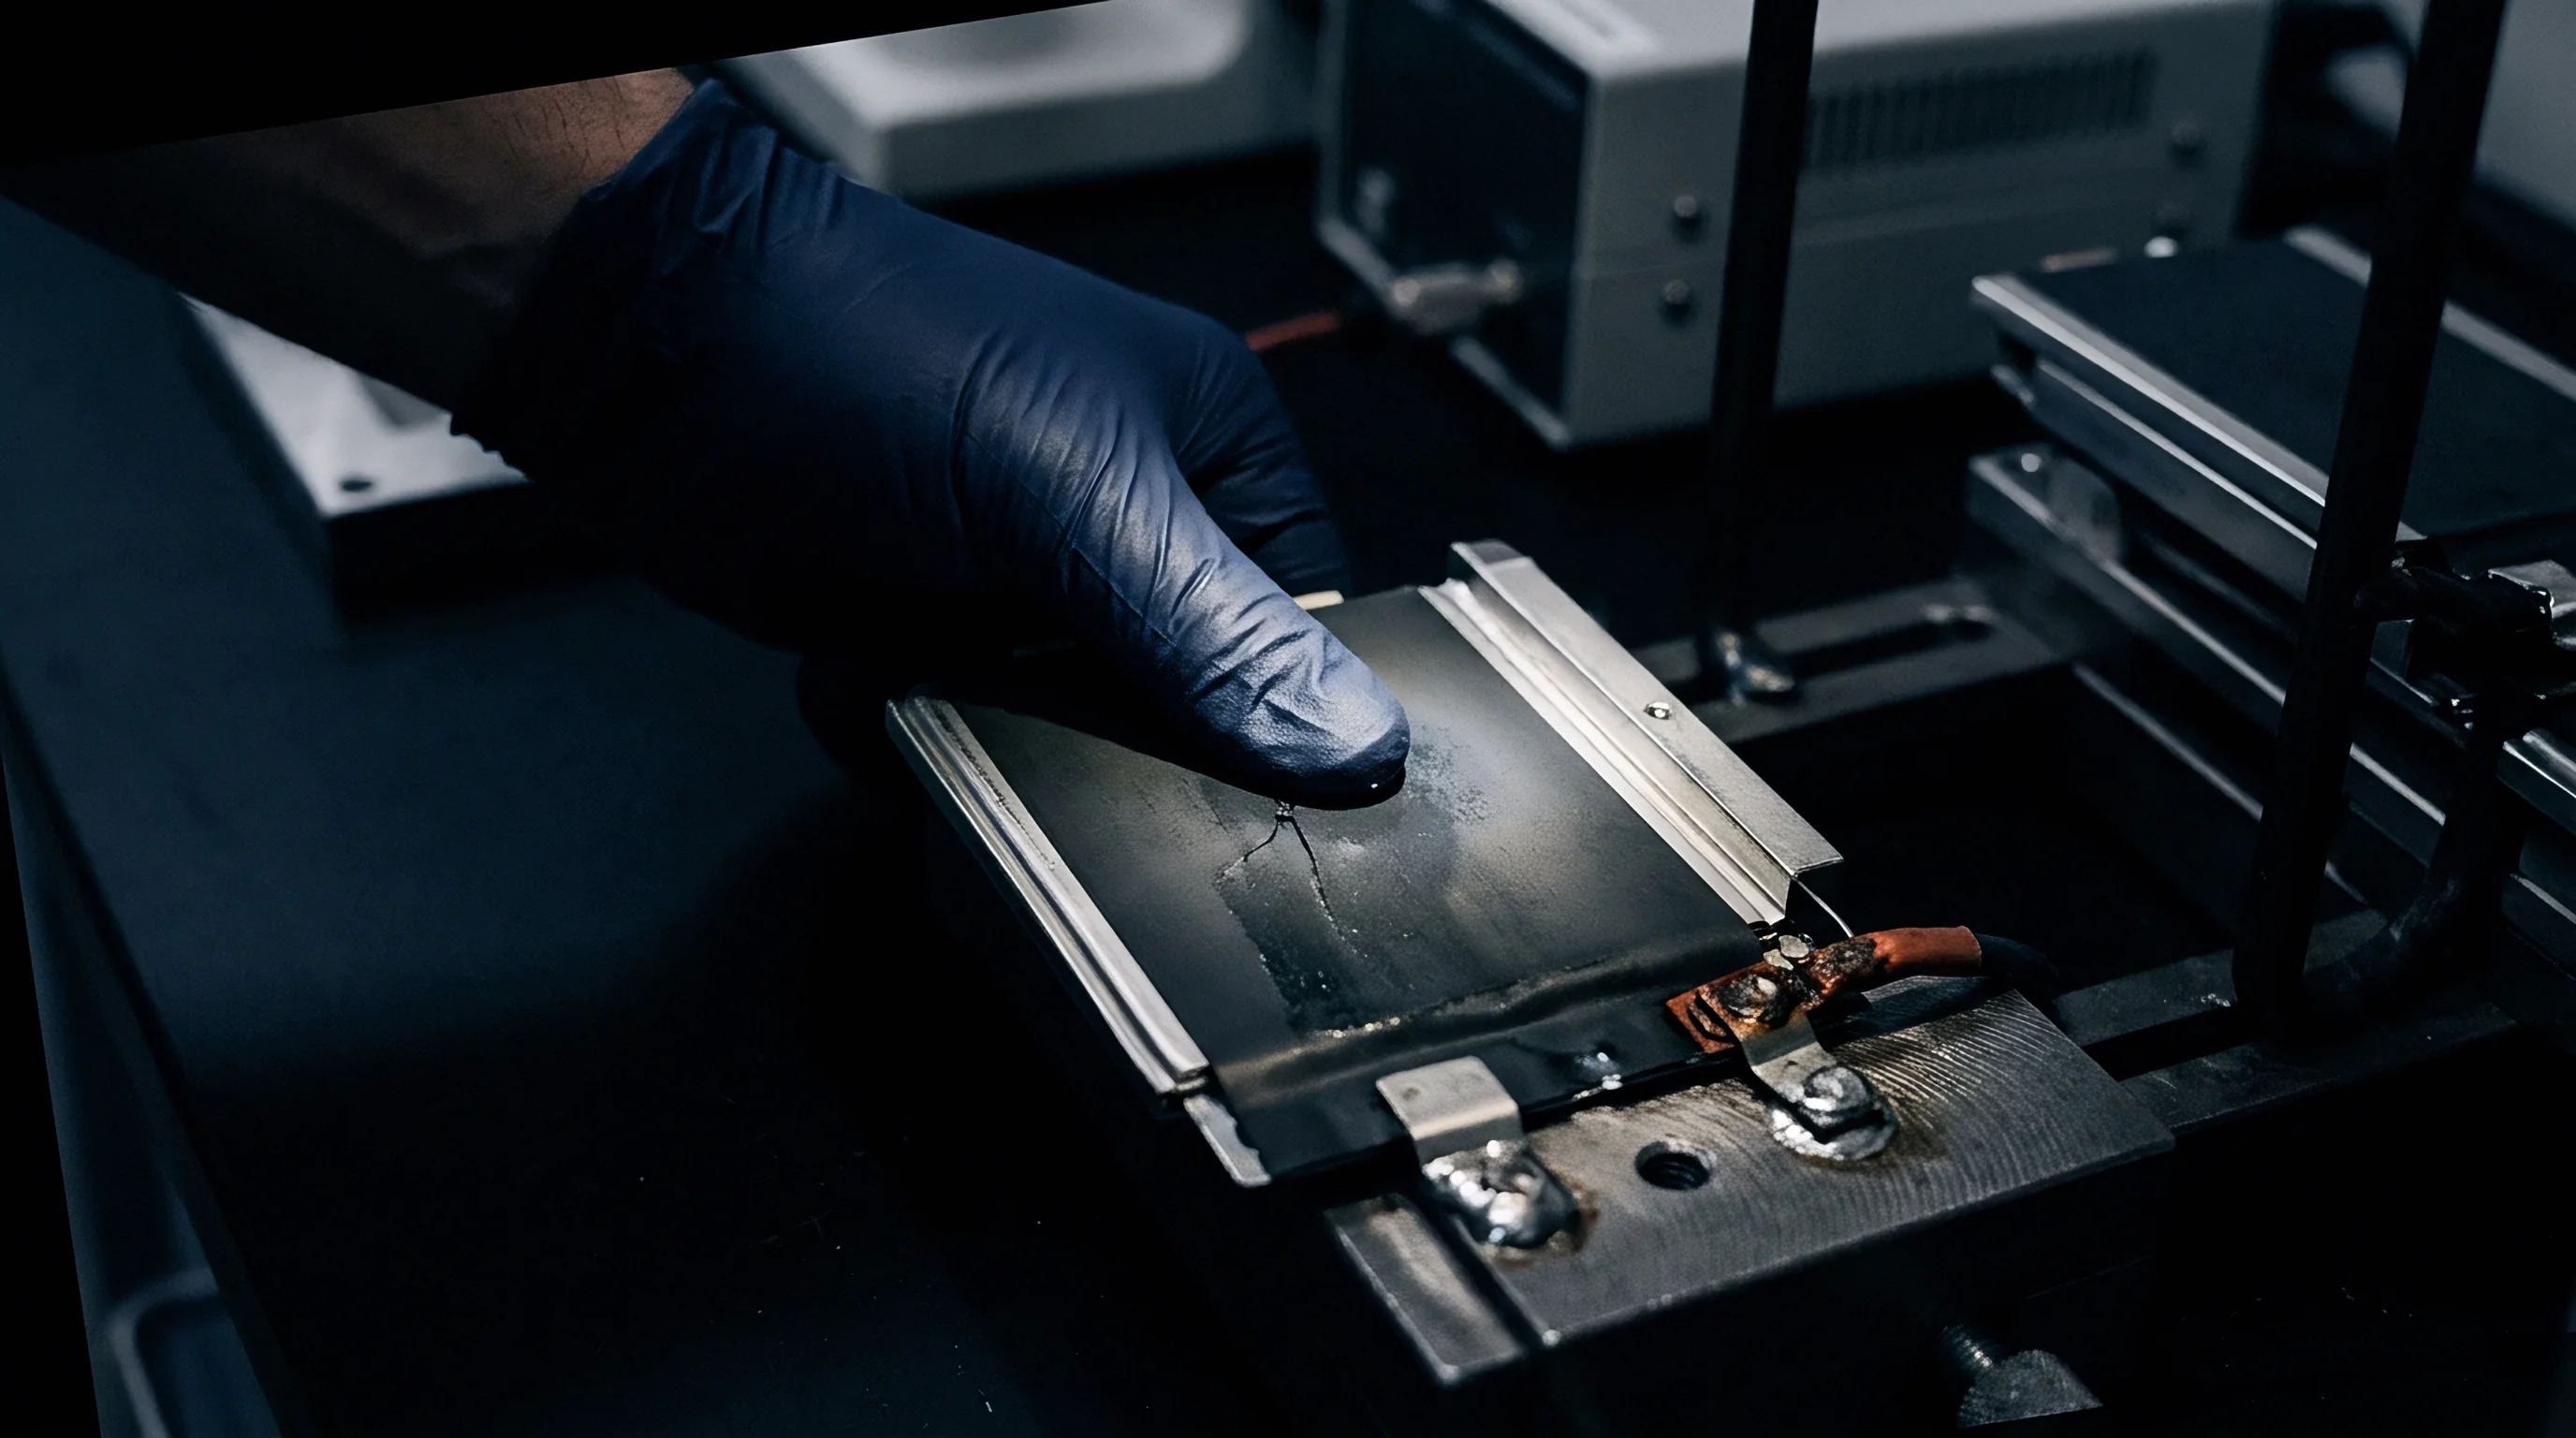
Polymeric compliance materials suffer from stress relaxation and permanent compression set under continuous cyclic loading. Exposure to operating temperatures reaching 45 degrees Celsius accelerates polymer chain rearrangement. Over 1,000 charge-discharge cycles, a standard polyurethane pad loses 25 to 40 percent of its initial restoring force at minimum thickness.
Restoring force loss allows stack pressure at zero state of charge to fall below 0.3 MPa, initiating void formation at the anode interface.
| Material Class | Initial Modulus at 10% Strain (KPa) | Compression Set after 1000h at 50°C (%) | Stress Relaxation Rate (%/log decade) | Thermal Conductivity (W/m·K) |
|---|---|---|---|---|
| Microcellular Polyurethane | 180 | 14.2 | 8.5 | 0.06 |
| Cross-linked Silicone Sponge | 240 | 4.8 | 3.2 | 0.12 |
| Fluoroelastomer Webbing | 520 | 2.1 | 1.8 | 0.22 |
| Expanded Polyolefin Sheet | 310 | 22.5 | 12.1 | 0.04 |
Spring rates demand explicit tuning to balance dynamic growth. Designing a compliance pad involves mapping the material stress-strain curve directly against cell thickness expansion limits. Mechanical pads must maintain sufficient pre-charge thickness at 0 percent state of charge while staying below maximum allowable load limits at 100 percent state of charge.

Mechanical Compliance Failure Dynamics
Evaluating long-term pad performance requires isolating specific physical degradation modes within the module assembly.
- Compression Set Accumulation reduces baseline pre-charge force across extended cycling, allowing interfacial separation during deep discharge cycles.
- Localized Stress Concentration emerges when pad thickness tolerances vary, focusing stack load onto narrow cell surface zones and driving localized separator breakdown.
- Thermal Insulation Trapping occurs when low-conductivity polyurethane pads impede lateral heat removal, creating elevated internal cell temperature gradients.
- Dynamic Hysteresis Lag delays restoring force delivery during high-rate discharge cycles, leaving anode layers uncompressed during rapid stripping events.
Field degradation frequently stems from structural interface voids rather than inadequate module foam stiffness.

Rig
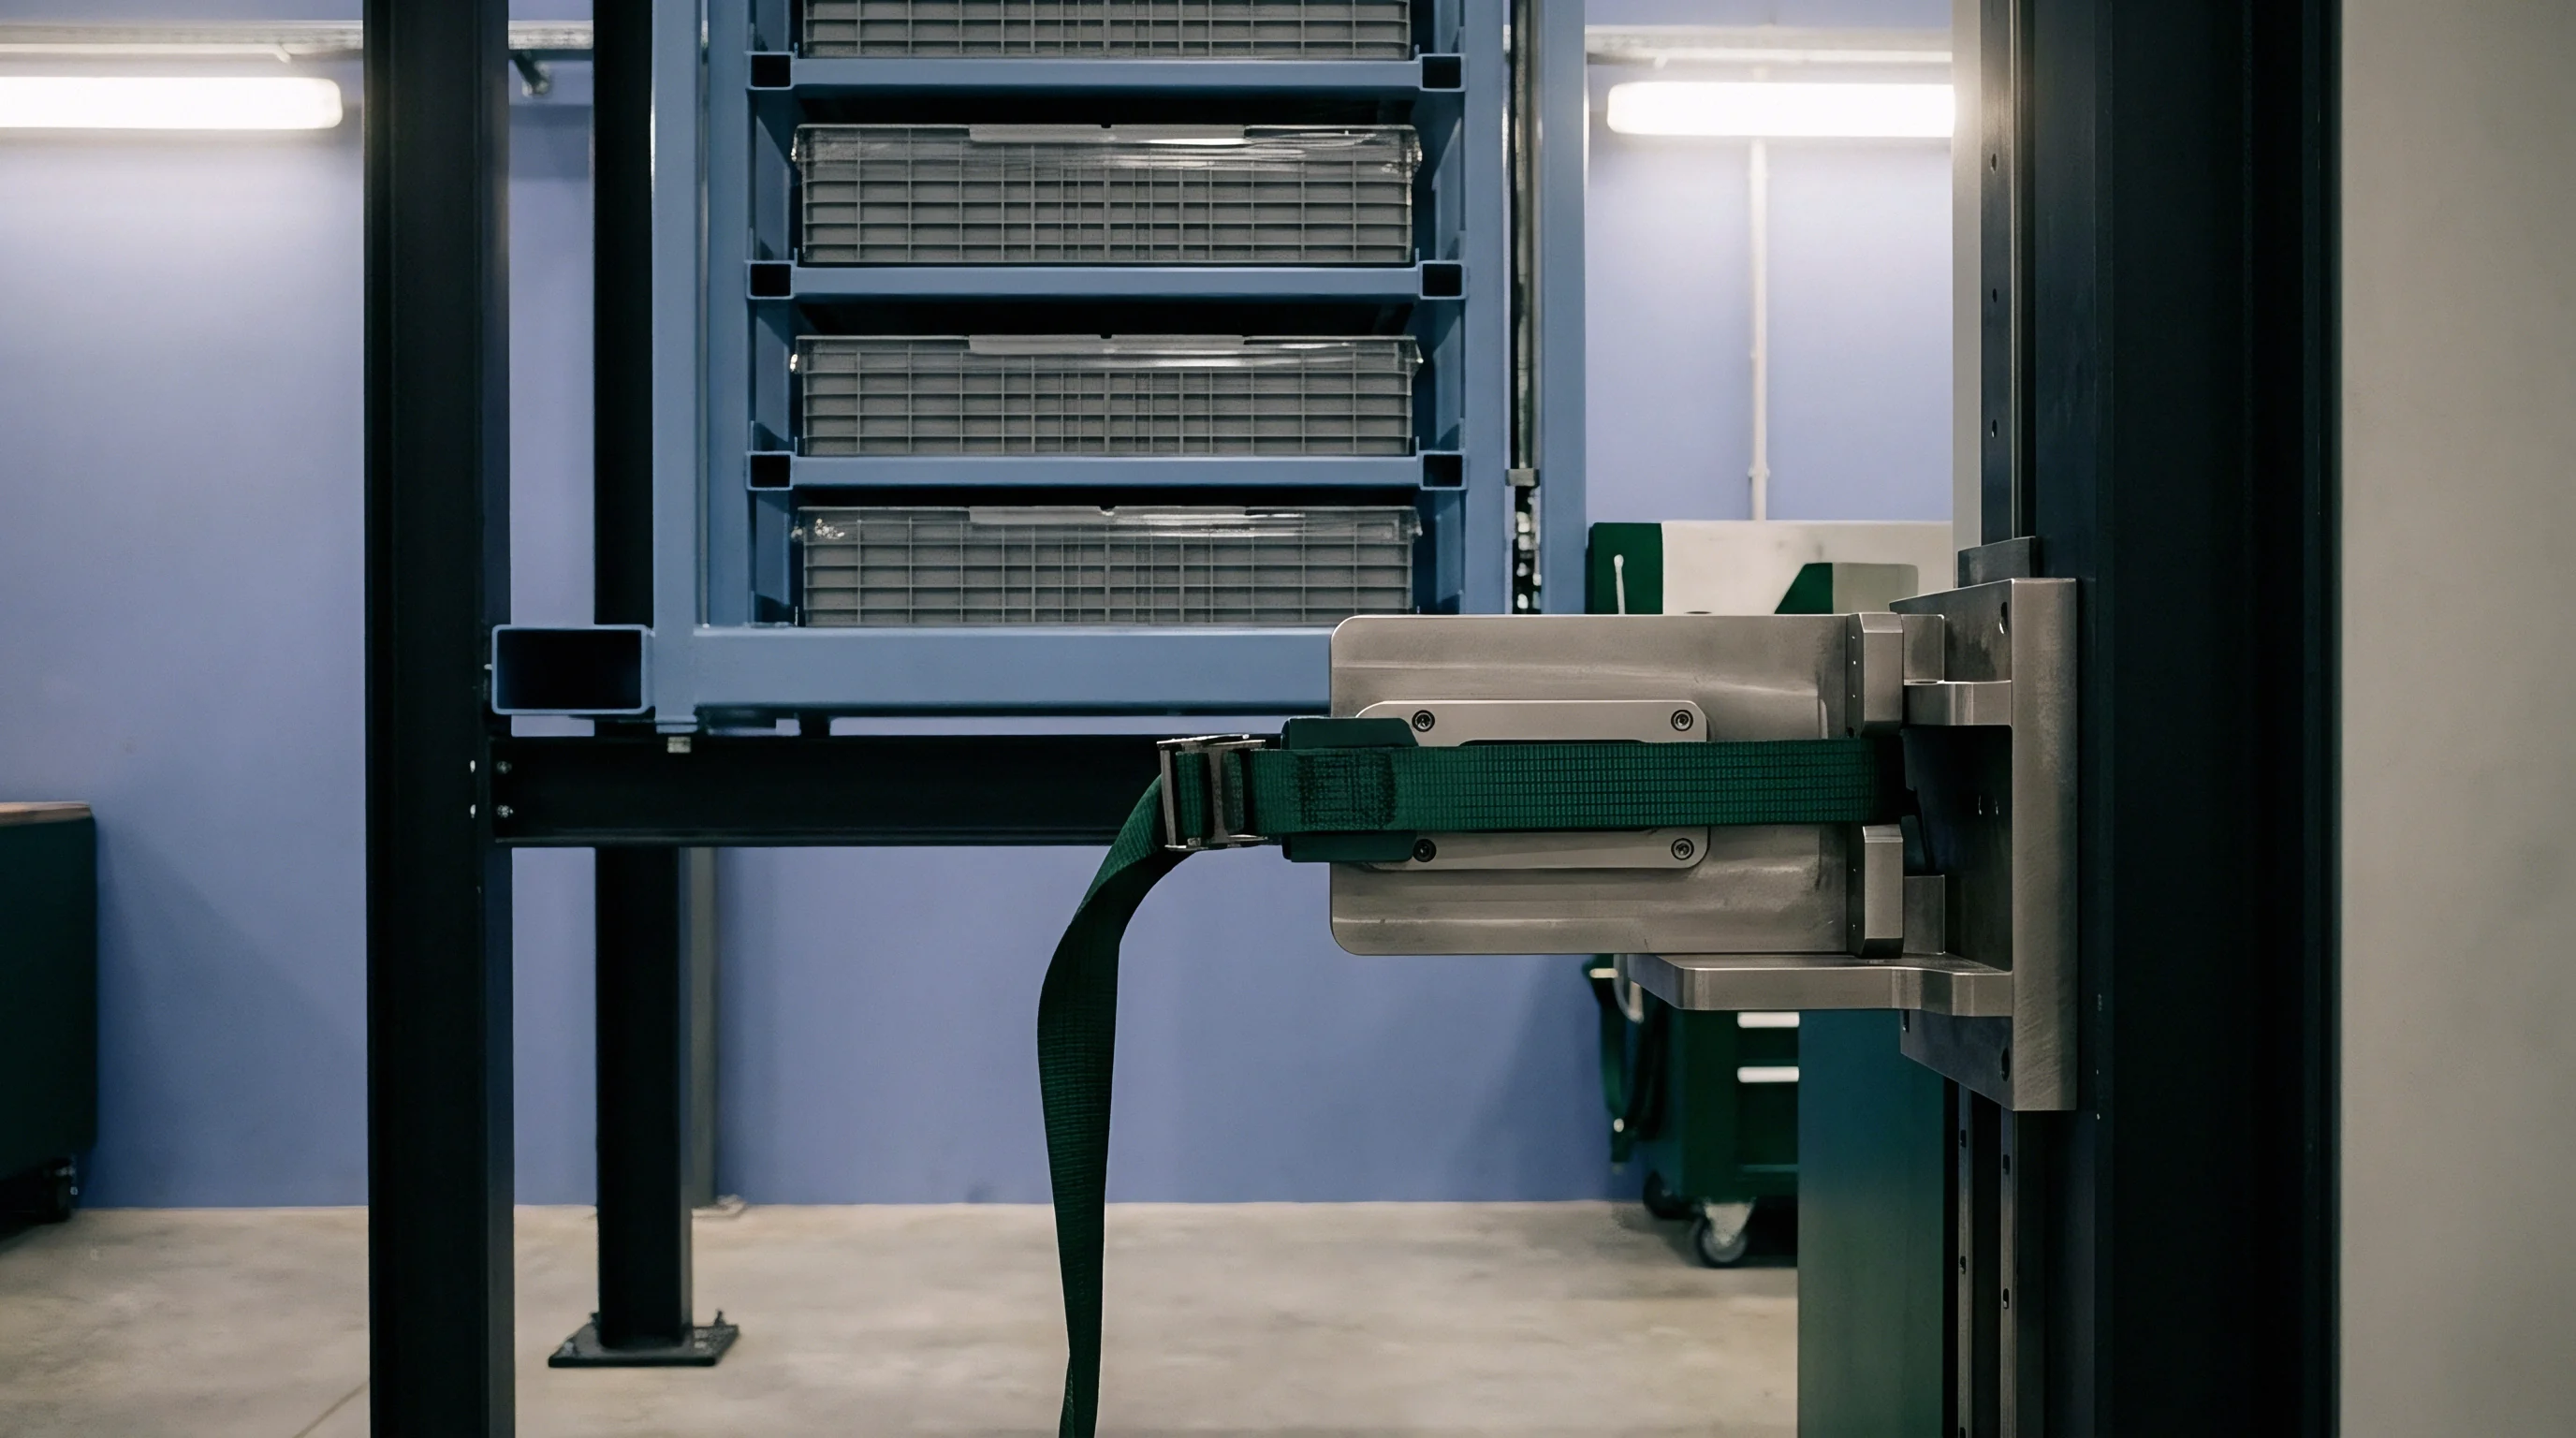
Structural module frames contain mechanical forces generated by internal cell stacks. Structural designs utilize extruded aluminum alloy end-plates bound by high-tensile steel straps or longitudinal tie-rods. End-plate assemblies absorb total stack force, converting internal hydrostatic swelling into bending moments and tensile loads across structural fasteners.
Structural rigidity dictates pressure distribution uniformity across cell surface areas.
End-plate deflection produces non-uniform pressure profiles across cell faces. Under peak expansion loads of 30 kN per module, an insufficiently stiff 6 mm end-plate deflects by 0.8 mm at its geometric center. Central deflection relieves local stack pressure, while rigid corner constraints retain high force.
Stack pressure at the cell center drops below 0.2 MPa, inducing localized mossy lithium accumulation. Meanwhile, edge pressure reaches 3.5 MPa, causing edge pinch failure and separator tearing.

Structural Calculation of End-Plate Deflection
Thick plate bending theory governs end-plate structural sizing. Approximating the end-plate as a simply supported rectangular beam under uniform pressure load yields peak deflection at the span center:
delta = (5 w L^4) / (384 E I)
where delta represents center deflection, w is distributed load per unit length, L is unsupported span length between tie-rods, E is Young’s modulus of the end-plate material (70 GPa for 6061-T6 aluminum), and I is area moment of inertia. Achieving center deflection below 0.1 mm under a 30 kN load requires an aluminum plate thickness of at least 18.5 mm, adding 2.4 kg of passive mass per module.
Topology optimization reduces structural weight by placing external stiffening ribs along primary stress trajectories. Cast magnesium end-plates with integrated cross-ribbing achieve identical bending stiffness at 35 percent lower structural mass compared to flat aluminum plates.
Will Dynamic Strain Relaxation Destabilize Module Bolt Torque Limits?
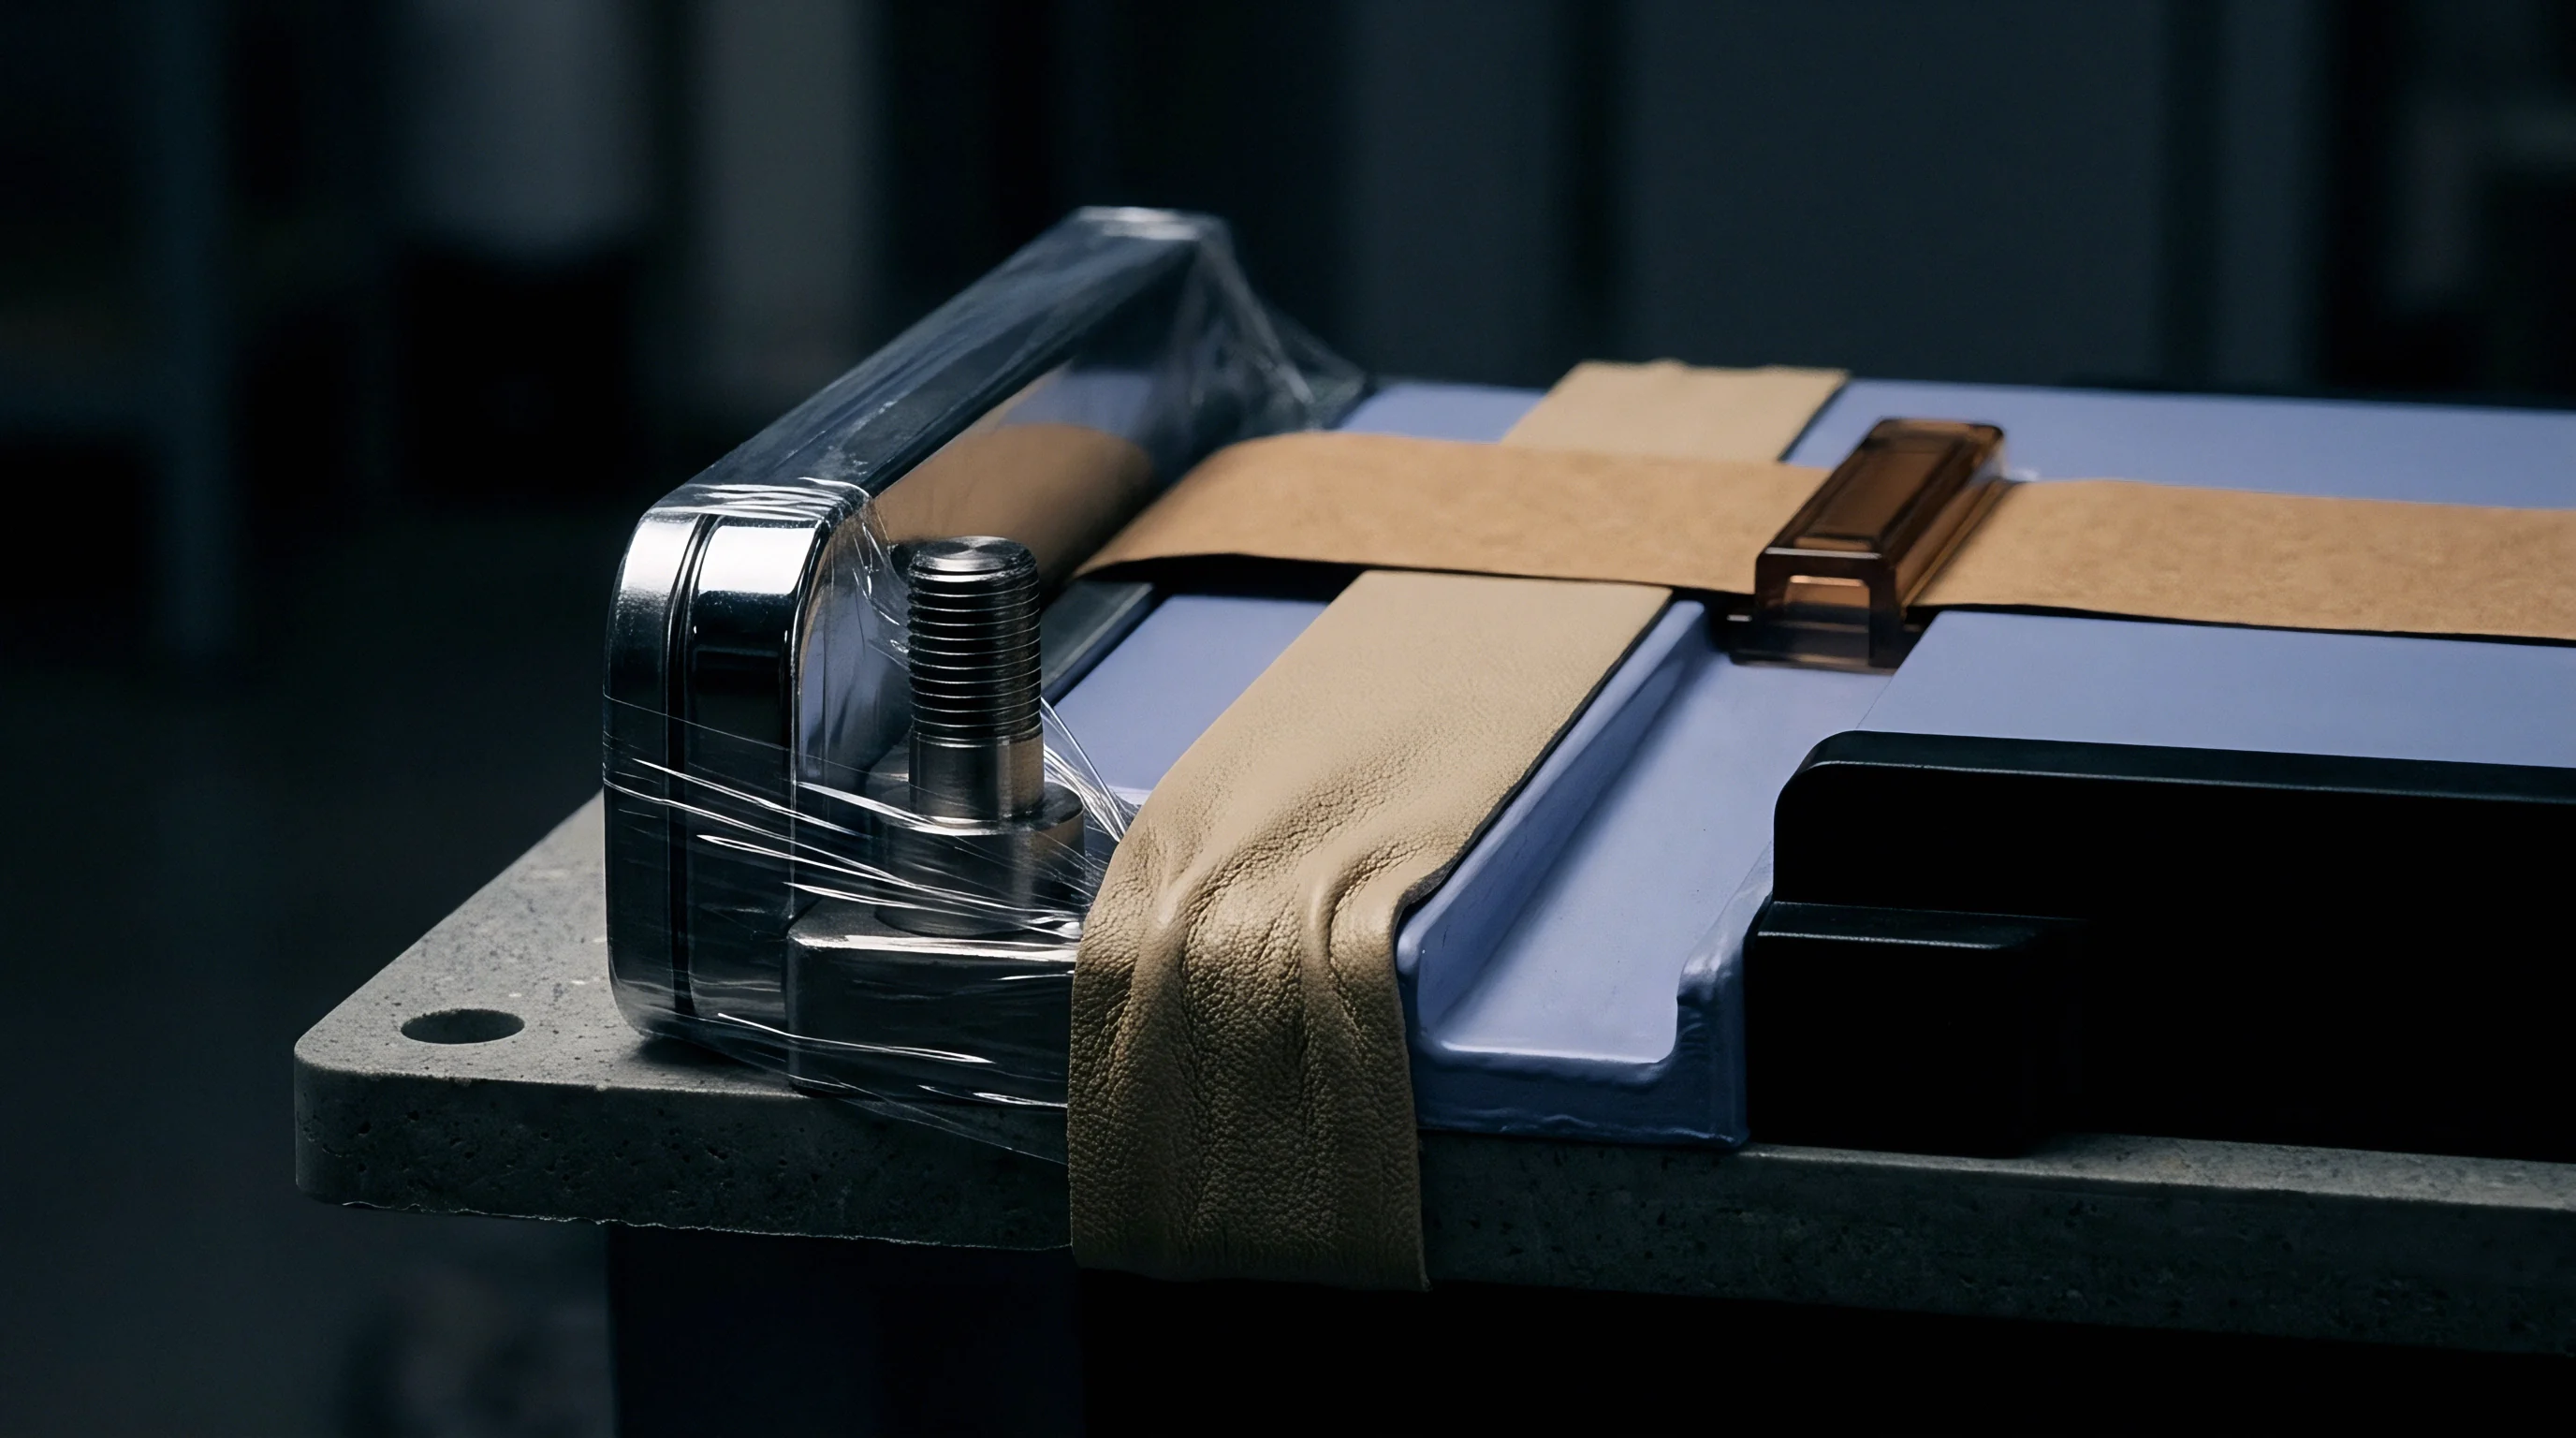
Tie-rods and perimeter bolts experience continuous cyclic tensile loads matching cell expansion frequency. A 24-cell module cycled twice daily undergoes 730 full stress cycles per year. Thermal expansion mismatch between steel tie-rods (thermal expansion coefficient 12 x 10^-6 /K) and aluminum module frames (23 x 10^-6 /K) superimposes additional thermal stress cycles during high-power operation.
Cyclic mechanical loading induces thread micro-slip, loosening fasteners over extended field operational lifespans. Steel straps secured by laser welding eliminate bolt loosening mechanisms but introduce permanent manufacturing assembly tolerances. Initial strap tension must account for room-temperature dimensional stack variances across batch cell deliveries.
UN 38.3 vibration test protocols mandate that structural housing bolt torque retention remains within 10 percent of initial specification after mechanical shock exposure.
Section 4.2 of the structural design specification transfers all containment housing fatigue failures to the pack integrator once bolt torque drops below 85 percent of initial pre-charge.


Telemetry
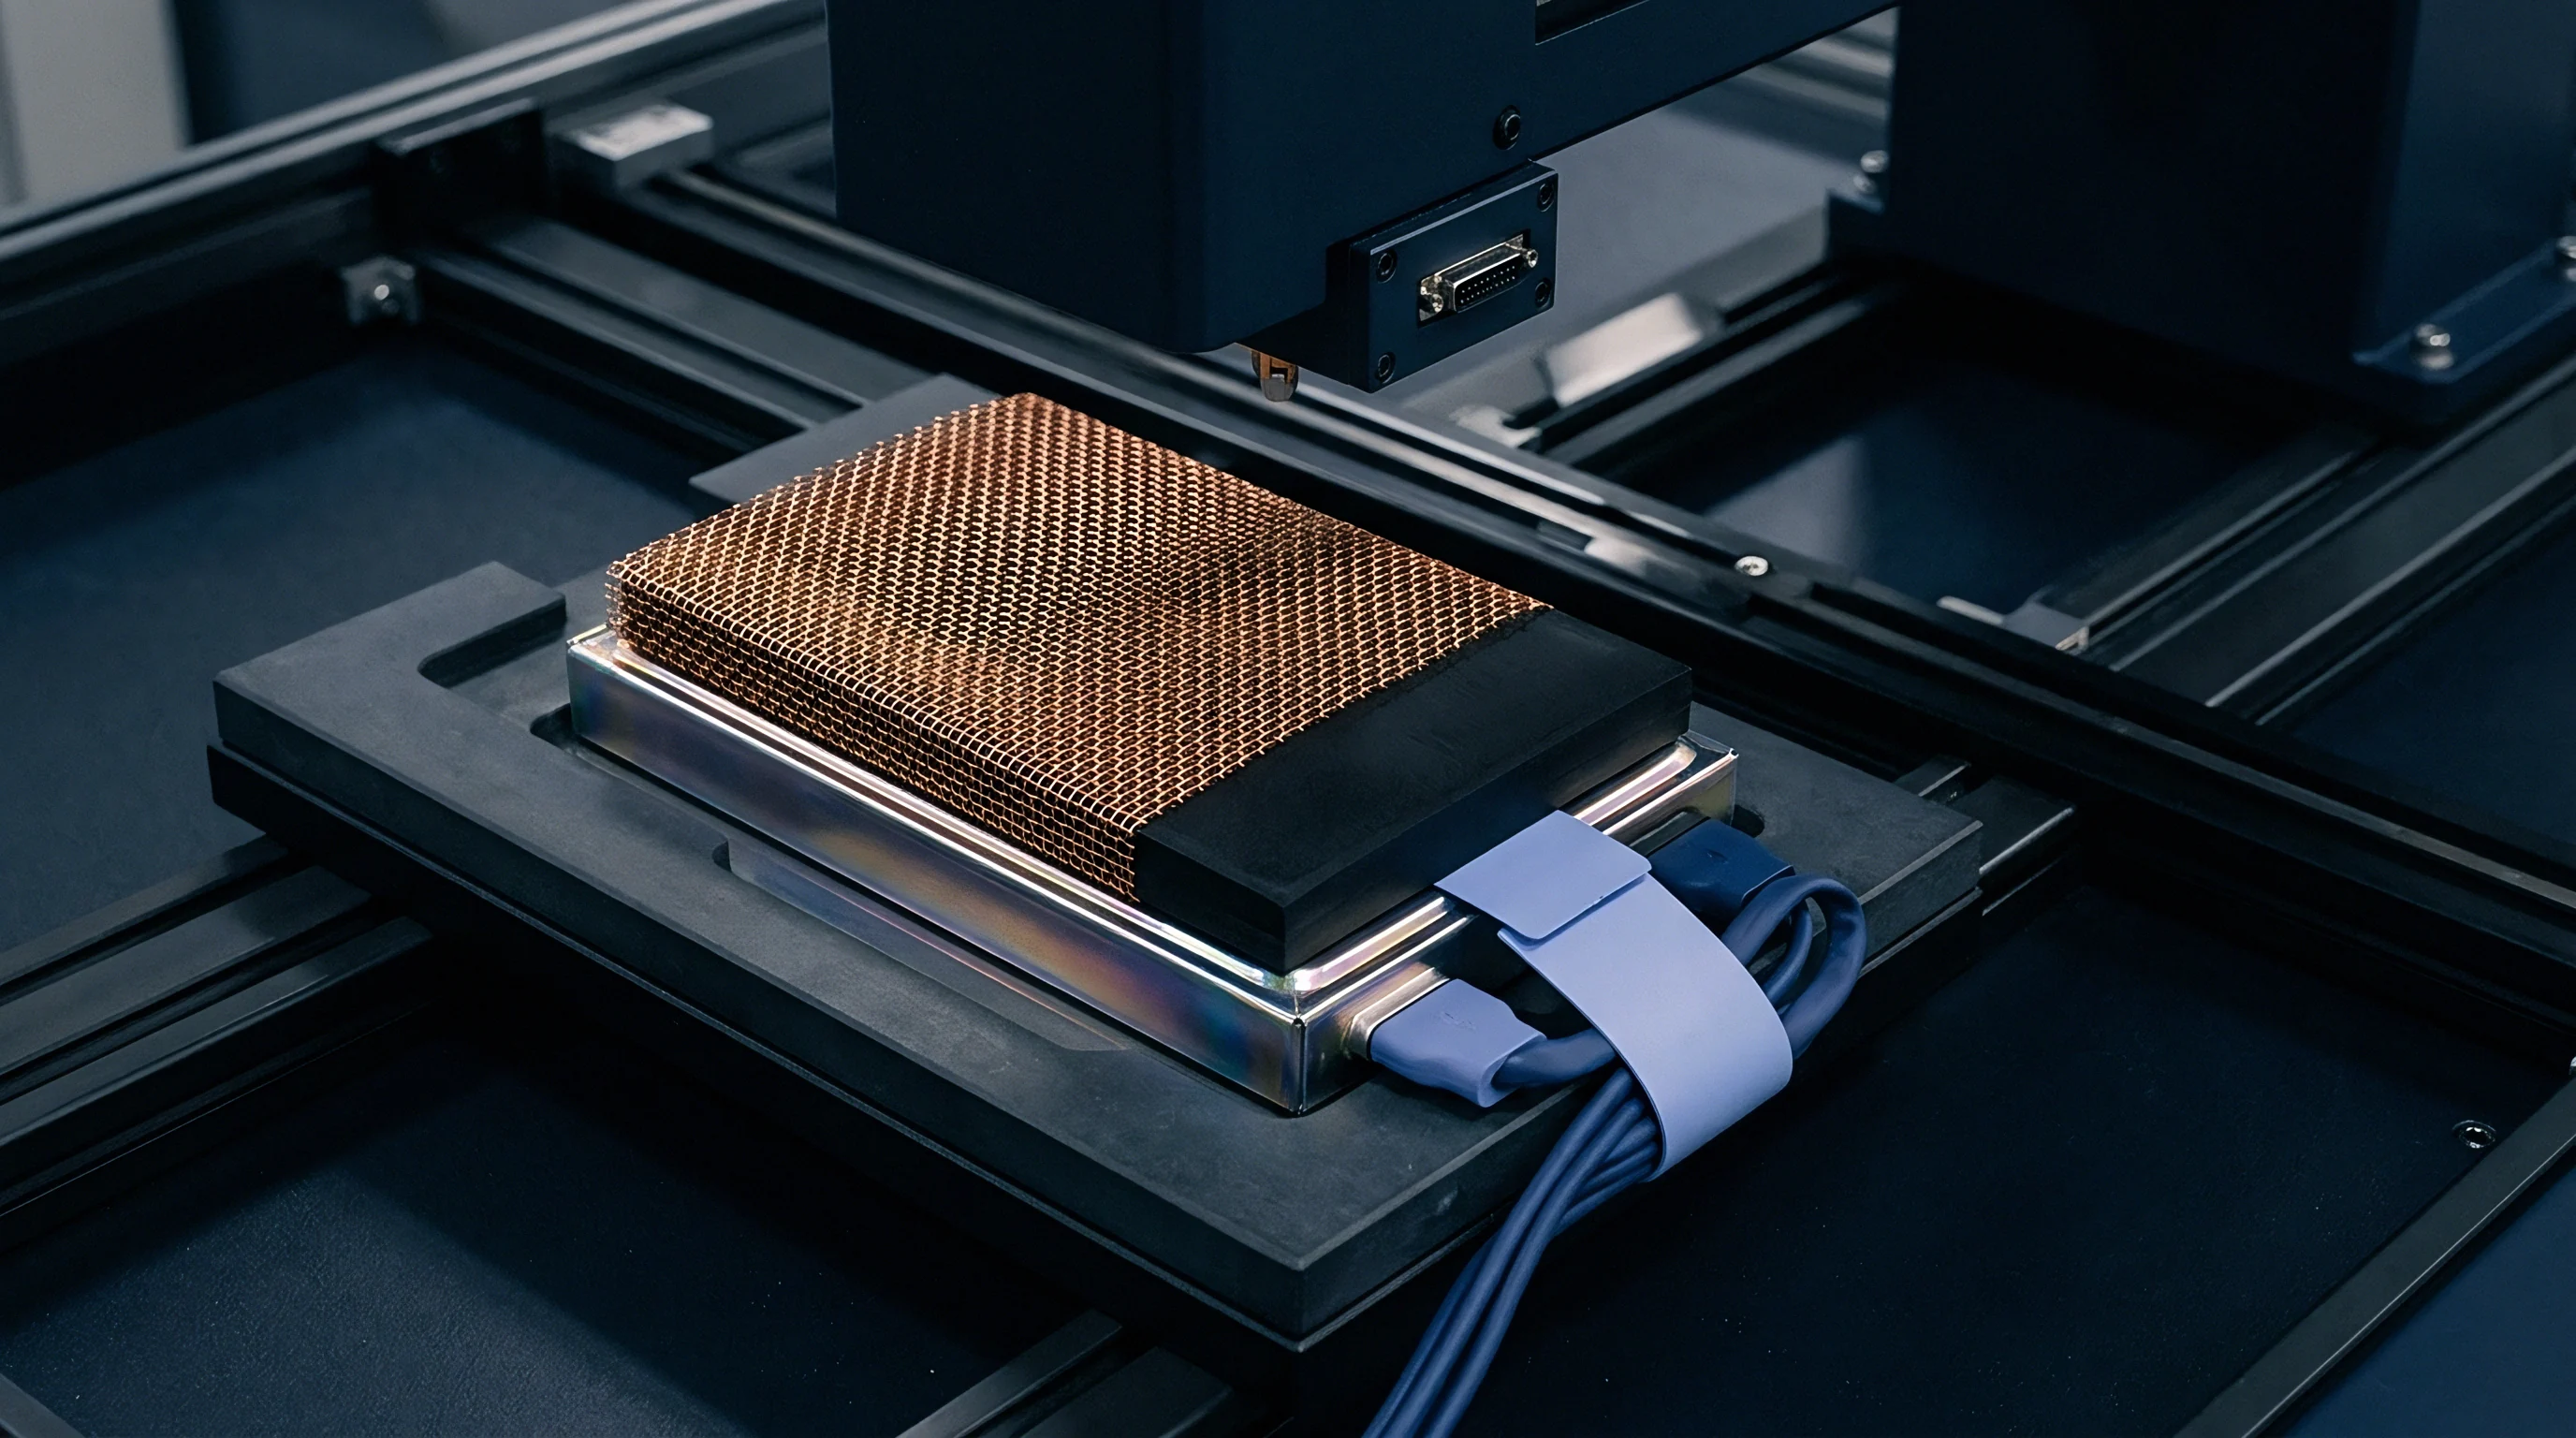
Capturing real-time load distribution requires specialized sensor arrays embedded inside module assemblies. Inline force measurement validates compliance pad design models and tracks long-term structural load degradation during product development qualification programs. Sensor integration must avoid introducing localized point loads into active cell faces.
Thin-film piezoresistive sensor arrays provide sub-millimeter spatial pressure resolution across full cell faces. Matrix arrays map pressure gradients, identifying end-plate deflection effects and pad non-uniformity. Piezoresistive inks suffer from temperature sensitivity, requiring continuous thermal compensation via adjacent thermocouple channels.
In-Situ Load Monitoring Instrumentation
Sensors must maintain calibration across multi-year testing windows. Strain measurement selection balances physical sensor thickness against signal fidelity and environmental stability.
| Sensor Technology | Thickness Penalty (mm) | Pressure Range (MPa) | Thermal Drift (%/°C) | Long-Term Drift (%/year) |
|---|---|---|---|---|
| Matrix Piezoresistive Film | 0.20 | 0.01 to 5.0 | 0.45 | 6.2 |
| Sub-miniature Load Cells | 3.50 | 0.00 to 50.0 | 0.02 | 0.3 |
| Fiber Bragg Grating (FBG) Optical | 0.125 | 0.05 to 20.0 | 0.01 | 0.1 |
| Capacitive Elastomeric Sheet | 0.50 | 0.02 to 2.0 | 0.15 | 2.8 |
Fiber Bragg Grating sensors embedded directly within elastomer compliance pads measure micro-strain optical wavelength shifts without adding thickness bulk. FBG arrays resist electromagnetic interference from fast-switching high-voltage inverter buses, delivering stable long-term force data during dynamic vehicle road trials.
Dynamic strain sensors integrated into module validation packs must possess calibrated drift rates below 0.5 percent per year to distinguish sensor attenuation from true mechanical preload loss.
Sensors placed near enclosure edges reflect end-plate stiffness rather than actual electrochemical layer expansion.

Dossier
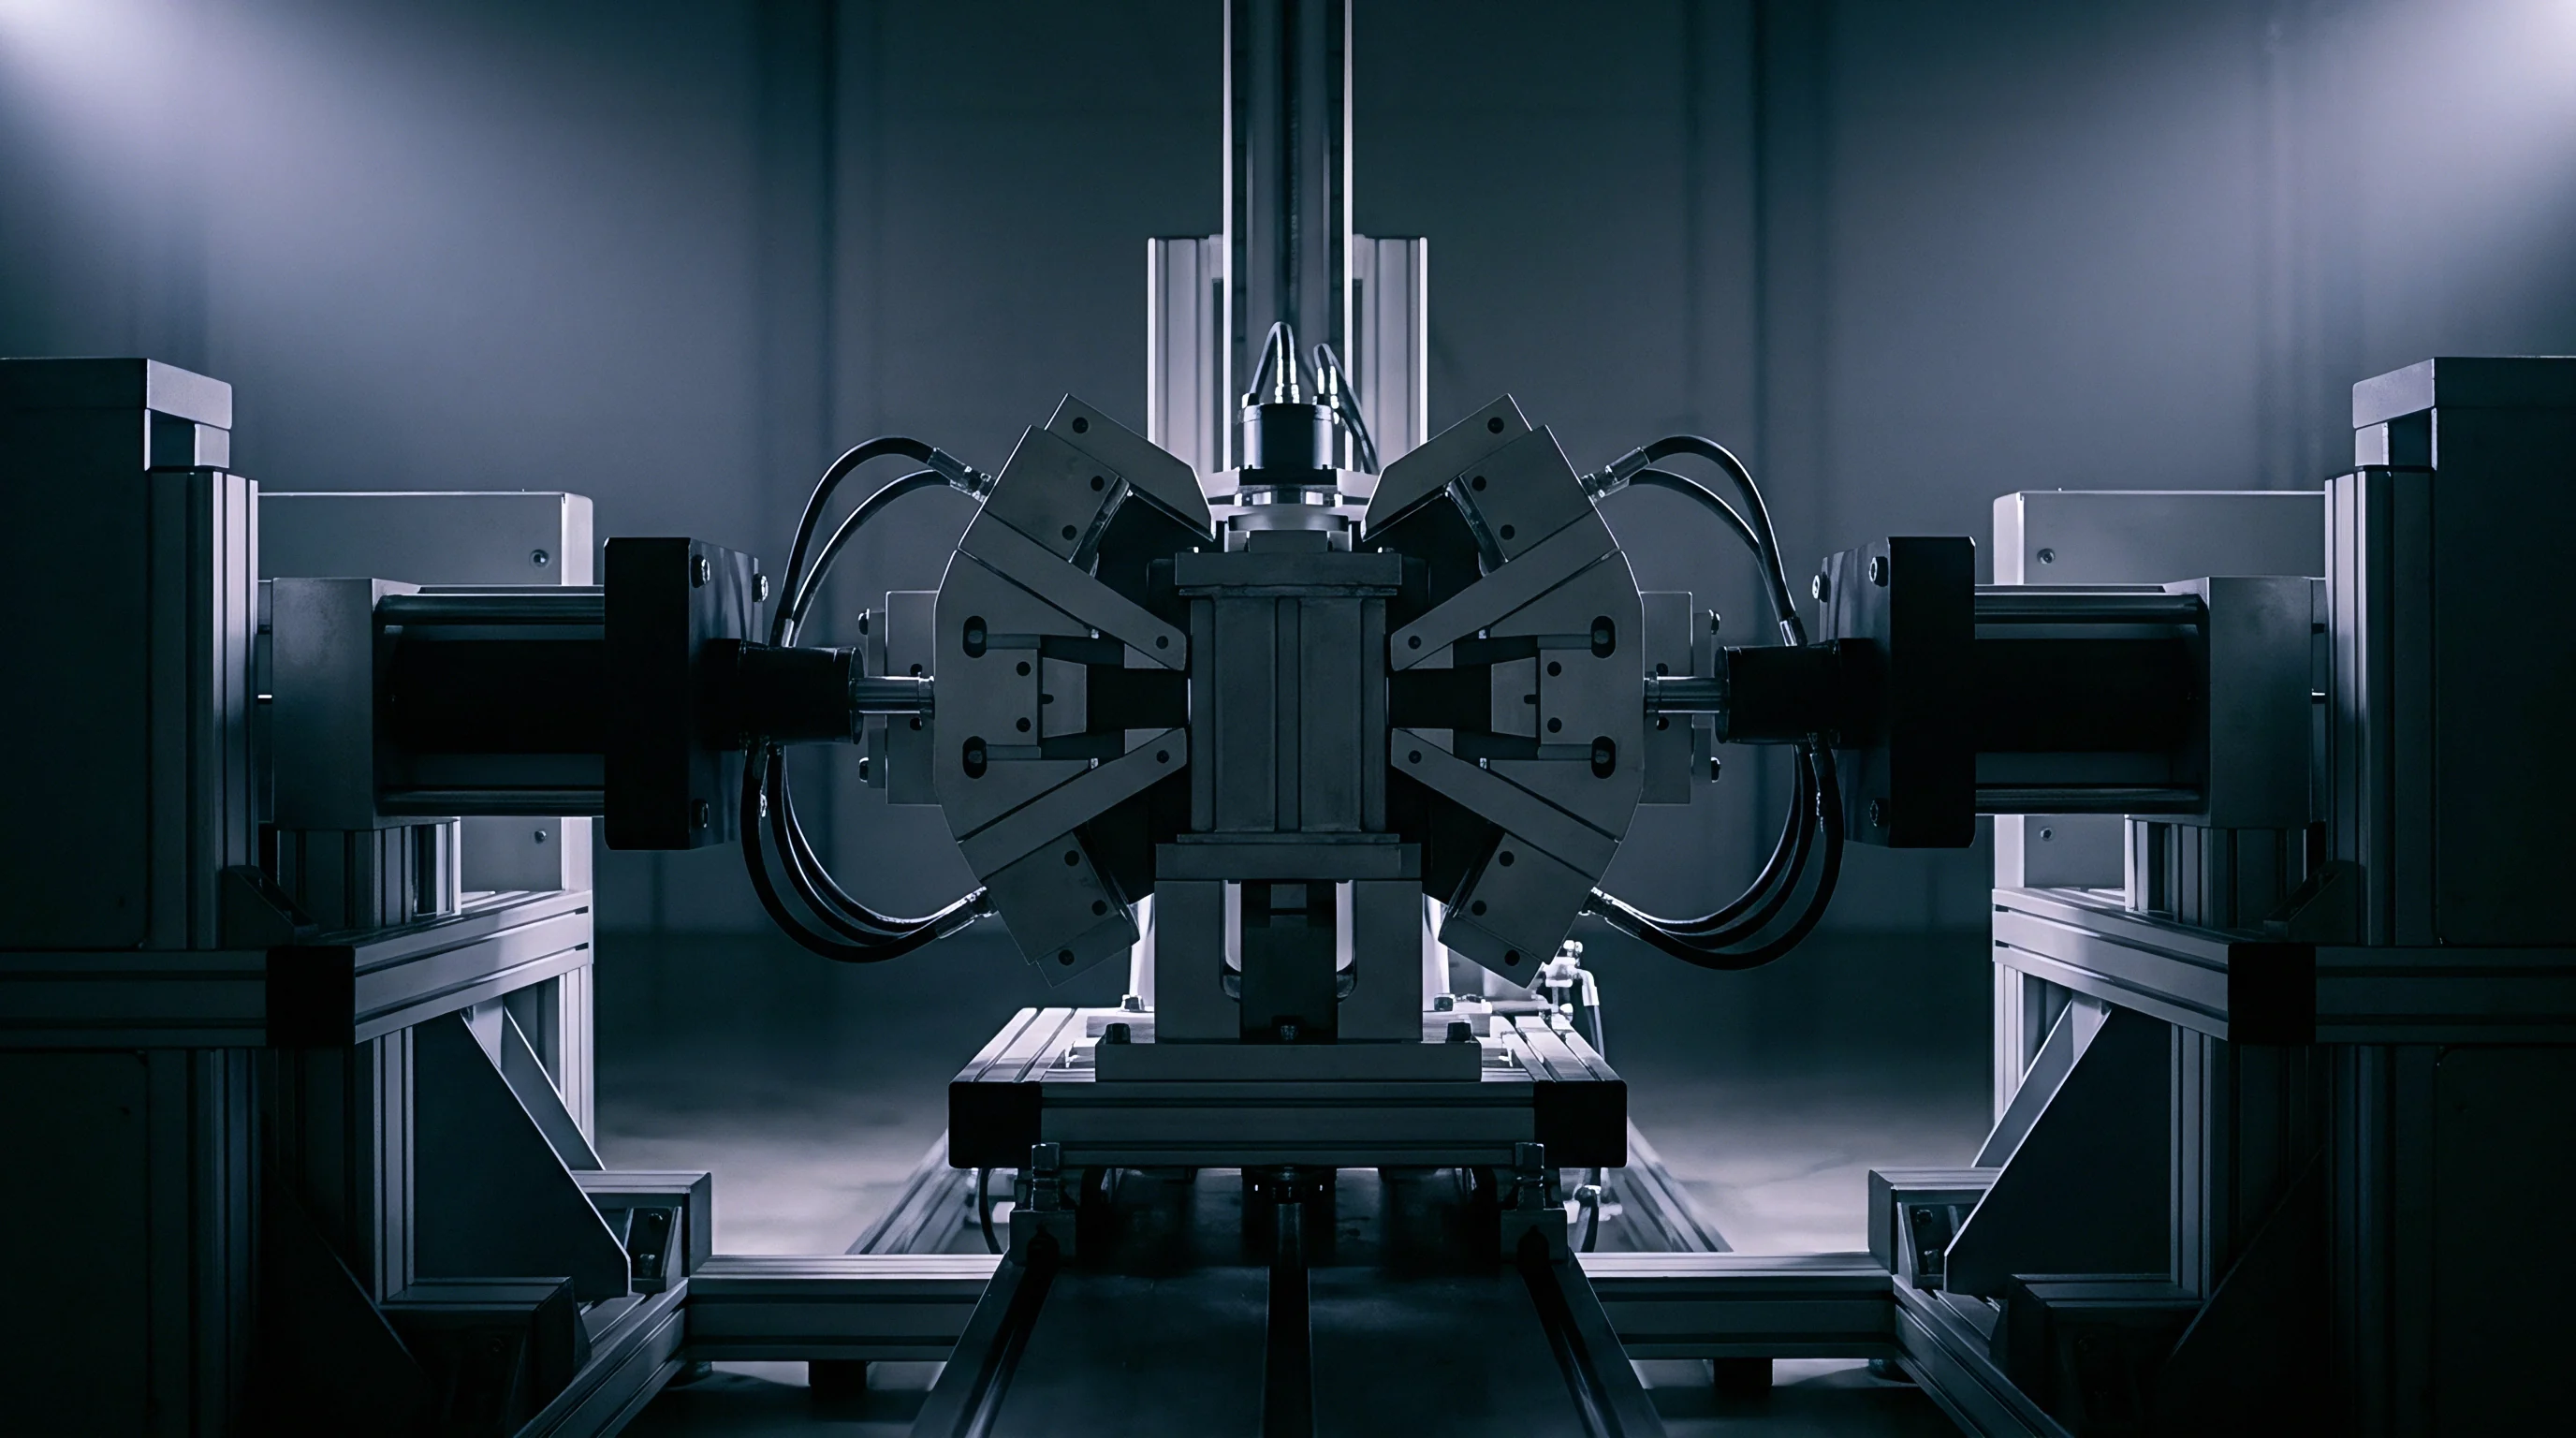
Verification protocols validate structural integrity and pressure retention compliance under simulated operating conditions. Factory acceptance testing confirms that every manufactured module meets baseline preload specifications before entering final vehicle pack integration lines. Automated test stations record pre-charge force levels under controlled SOC and temperature environments.
Manufacturing process control prevents field early-life failures. Pre-charge force verification requires structured step-by-step mechanical testing sequences during initial module assembly workflows.
- Position the uncompressed cell stack inside the assembly fixture while recording unconstrained stack height across four corner points.
- Compress the cell stack using a calibrated hydraulic press until force sensors register the target pre-charge load of 0.75 MPa (+/- 0.02 MPa).
- Install structural end-plates and torque longitudinal tie-rod fasteners to specified initial assembly tension values.
- Release hydraulic press load and record retained static stack pressure after a 15-minute viscoelastic relaxation dwell period.
Compliance documentation mandates recording initial load profile signatures for every serialized module built. Digital travel records link initial mechanical preload values to subsequent electrochemical end-of-line grading results.
Whether thermal test chambers accurately reproduce cyclic strain degradation under combined temperature and mechanical load variations remains an open technical dispute.

Ledger
Mechanical design choices drive non-recurring engineering costs and final pack landed costs. Tightening allowable end-plate deflection limits increases aluminum structural thickness, raising raw material cost per kWh. Incorporating silicone sponge cushions instead of polyurethane foams increases cell sandwich bill-of-materials costs while extending continuous cycle life targets.
Mechanical cell thickness tolerances create substantial commercial cost exposure. Pouch cell suppliers guarantee nominal cell thickness within standard manufacturing tolerances of +/- 0.15 mm. In a 24-cell series module stack, accumulated cell thickness tolerances reach +/- 3.6 mm.
Accommodating this dimensional variance without changing stack pressure limits requires custom selective shimming processes during factory assembly.

Tolerance Stack-Up Financial Impact Analysis
Assuming a 50,000-unit annual module production run, managing stack thickness variances introduces distinct manufacturing cost structures. Integrating active robotic laser measurement and automated shimming stations adds 420,000 USD in upfront capital expenditure. Amortizing this automation asset across a three-year production cycle adds 2.80 USD per module.
Manual shimming procedures avoid capital equipment expenditure but increase line takt time by 4.5 minutes per module. Manual labor rates of 65.00 USD per hour translate to a direct labor cost addition of 4.88 USD per module. Manual process variance also introduces risk of operator error, driving scrap rates upward by 0.6 percent.
Selecting wider-compliance silicone spring elements increases baseline pad unit cost from 1.20 USD to 4.50 USD per cell position, adding 79.20 USD per 24-cell module, but entirely eliminates the need for selective assembly shimming.
Purchasing contracts specifying cell thickness tolerances tighter than +/- 0.05 mm carry a 14 percent unit price premium from cell suppliers to cover factory capacity grading scrap losses.
Warranty terms define stack life. Commercial procurement agreements must explicitly partition failure responsibility between electrochemical capacity fade and mechanical frame degradation. Warranties covering lithium metal modules demand clear definitions of acceptable end-of-life stack pressure drop off.
If module bolt preload drops below 0.3 MPa due to structural creep, subsequent capacity loss stems from mechanical integration failure rather than inherent cell chemistry breakdown.
Amortizing housing modification costs across the initial production run establishes clear financial accountability before tooling steel gets cut.