Statistical Sampling and Defect Classification for Prismatic Battery Batches
Prismatic cell batch acceptance demands zero-acceptance attribute sampling for safety defects and ISO 3951-1 variables sampling for capacity and impedance distributions.
Severity
Factory release sheets accompany every cell batch arriving at receiving, but the numbers frequently obscure substantial variance within the lot itself. In aluminum-cased prismatic cells, from 50 Ah modules to 304 Ah grid-scale units, mechanical, chemical, and electrical failure modes are packed into a single rigid shell. Sorting through these shipments requires clean defect lines between genuine safety hazards and acceptable process variation.
Every statistical choice downstream rests on how defects are classified. When receiving teams break down a pallet, observed defects must map directly to set tiers based on failure consequence. Any ambiguity here undermines the contractual basis for rejecting a lot.
| Defect Tier | Failure Mode Description | Verification Boundary | Detection Tooling | Target Acceptance Level |
|---|---|---|---|---|
| Class A Safety | Internal metallic contamination, burrs piercing separator, cracked vent membrane | Zero tolerance across entire shipment volume | High-voltage hi-pot, CT inspection, visual optical gauging | 0.00 AQL |
| Class B Functional | Capacity below specification floor, high alternating-current impedance, terminal weld porosity | Discharge capacity under 1.00 C1/3, ACIR exceeding 0.50 milliohms | Automated cell cycler, 1 kHz AC milliohmmeter, laser profiler | 0.40 AQL |
| Class C Mechanical | Can wall bulging, terminal post thread damage, polarity mark misalignment | Envelope expansion exceeding 0.30 millimeters under 300 kgf clamp load | Coordinate measuring machine, height gauge, thread plug gauge | 1.50 AQL |
| Class D Cosmetic | Mylar wrap superficial scuffs, inkjet printing blur, residual exterior cleaning grease | Visual flaw not penetrating insulation layer dielectric barrier | High-resolution industrial camera, visual comparator | 4.00 AQL |
Class A failures cover anything that could spark thermal runaway, burst the case, or drop high-voltage isolation to the chassis. A loose sliver from ultrasonic terminal welding that works toward an electrode edge, for instance, turns into an active fire risk once pack vibration sets in. Class B issues hit electrical output, hastening capacity fade, driving localized heating, or burning through BMS balancing resistors early.
Class C and D defects handle mechanical fit in aluminum trays and the surface condition needed for robotic pick-and-place indexing.
Prismatic aluminum cans amplify internal cell swelling into mechanical module strain long before capacity fade registers on a standard cycler.
Assigning specific numerical limits to each tier determines whether a shipment clears incoming inspection. High-speed cell lines inevitably throw minor cosmetic flaws. Separating those superficial marks from true structural defects prevents pointless commercial disputes without letting latent field risks slip into pack assembly.
- Class A Non-Conformance triggers immediate lot rejection if a single defective unit appears, halting dock intake and moving the shipment into quarantine.
- Class B Non-Conformance allows lot acceptance under statistical sampling, provided secondary electrical checks confirm a normal distribution of cell impedance.
- Class C Non-Conformance permits sorting or rework agreements when mechanical deviations still fall within module tolerance stacks.
- Class D Non-Conformance logs a formal supplier notice without halting cell intake, monitoring finish quality across incoming ocean shipments.
Shell dimensions dictate how well cells fit into rigid pack structures. Aluminum walls run between 0.6 millimeters and 1.2 millimeters thick, meaning small inconsistencies in deep drawing or seam welding change how the can flexes under internal gas pressure.
Safety defects remain strictly non-negotiable regardless of shipment size, whereas arguments over cosmetic blemishes tend to soften when project schedules tighten.

Lot
Ocean containers arrive at destination warehouses with thousands of cells sharing the same slurry batch and formation cycles. ANSI/ASQ Z1.4 and ISO 2859-1 lay out standard attribute sampling based on Acceptable Quality Limit indices, but sampling tables meant for consumer goods break down in high-energy lithium storage. Incoming inspection requires the statistical defensibility of a zero-acceptance plan.
Under traditional attribute inspection, an Acceptable Quality Limit of 0.65 percent on 10,000 cells allows several defectives through before triggering lot rejection. In a 100 kWh commercial pack with hundreds of prismatic cells wired in series, one internal short can propagate through the entire system. That risk forces sampling away from multi-defect allowances toward Squeglia c=0 plans and Mil-Std-1916 protocols.
Adopting zero-acceptance sampling under Mil-Std-1916 forces immediate lot rejection upon discovery of a single critical dimensional defect.
An Operating Characteristic curve maps the probability of accepting a batch against incoming defect rates. Suppliers prefer standard ANSI Normal Level II plans to avoid having borderline lots turned away, but this pushes too much consumer risk onto the buyer at low defect levels. Adopting c=0 sampling steepens the curve, protecting pack integrators from latent flaws that slip past factory end-of-line testing.

What Triggers Tightened Inspection under Switching Rules?
Switching rules shift sampling between normal, tightened, and reduced cadences based on supplier history. Under ISO 2859-1, if two out of five consecutive lots fail incoming intake checks, the inspection protocol shifts to tightened sampling without delay. This expands the sample size and tightens acceptance limits, cutting the odds of accepting lots affected by marginal process drift.
| Sampling Standard | Inspection Level | Sample Size (n) | Acceptance Criteria (Ac) | Rejection Criteria (Re) | LTPD (Beta = 0.10) |
|---|---|---|---|---|---|
| ANSI/ASQ Z1.4 Normal | Level II (General) | 315 | 5 defects | 6 defects | 3.15% |
| ANSI/ASQ Z1.4 Tightened | Level II (General) | 315 | 3 defects | 4 defects | 2.10% |
| Squeglia c=0 Attribute | Index AQL 0.40% | 125 | 0 defects | 1 defect | 1.82% |
| Squeglia c=0 Attribute | Index AQL 0.10% | 315 | 0 defects | 1 defect | 0.73% |
| Mil-Std-1916 Verification | Level IV (Stringent) | 490 | 0 defects | 1 defect | 0.47% |
Tightened inspection doubles the required sample count. Carrying that extra inventory in quarantine creates financial pressure on the vendor to resolve underlying line issues quickly. Returning to normal inspection requires five consecutive lots clearing tightened checks with zero non-conformances.
Because each prismatic cell stores substantial energy, classical acceptance numbers above zero introduce unquantifiable field liability, leaving zero acceptance as the baseline. Finding even one defective laser weld or bulged can in a sample points to systematic lapses in upstream environmental controls.
Minor shifts in cell thickness are attributed either to humidity swings during maritime transit or to uncorrected electrode calender drift during manufacturing.
Vent
The rupture disc stamped into a prismatic cell’s top cover is the last barrier against explosive casing rupture. These laser-scored vents have to burst reliably within a tight window, usually 0.60 MPa to 0.90 MPa, once thermal runaway starts generating off-gas. Variations in foil thickness, score depth, or oxidation directly shift that burst point.
Helium mass spectrometry checks the seal along the lid-to-can laser weld. A leak rate above 1.00 x 10^-7 Pa·m³/s lets moisture seep into the cell over years in the field. That water reacts with lithium hexafluorophosphate in the electrolyte to form hydrofluoric acid, attacking separators and dissolving active cathode materials.
Laser power settings dictate weld penetration depth. Spatter thrown onto terminal collars or vent discs can burn pinhole perforations through thin metal, while mechanical shocks during transit tend to open micro-fissures along the weld’s heat-affected zone.
To prevent violent enclosure ruptures, inspection protocols isolate can defects using dimensional checks, visual inspection, and pressure-decay testing.
- Vent Membrane Scoring Inconsistency creates variations in residual foil thickness, leading to early opening under heavy charging or complete failure to vent during thermal runaway.
- Can-to-Lid Laser Porosity leaves structural weaknesses that crack as cells swell cyclically inside rigid module enclosures.
- Terminal Post Collar Creep stems from uneven torque or poor polyphenylene sulfide injection molding, breaking hermetic seals and opening leak paths.
- Case Planarity Deviation creates uneven contact across liquid-cooling plates, raising thermal interface resistance and causing localized hot spots.
- Anode Terminal Polarity Indentation introduces contact resistance during busbar welding, concentrating heat directly over internal electrode tabs.
Burst testing is destructive and requires sacrificed samples. Technicians clamp cell lids into pneumatic fixtures, stepping dry nitrogen pressure up by 0.05 MPa per second until the score line bursts. The vent petals must hinge open without shedding fragments; loose metal ejected during venting can sever wire harnesses or puncture adjacent cells.
Visual inspection under ultraviolet light excites fluorescent tracers to reveal electrolyte residue, triggering immediate quarantine for weeping micro-cracks before cells reach the pack line.
Skipping burst pressure verification leaves field packs exposed to violent ruptures and cascading thermal runaway if off-gas cannot escape the header.

Overhang
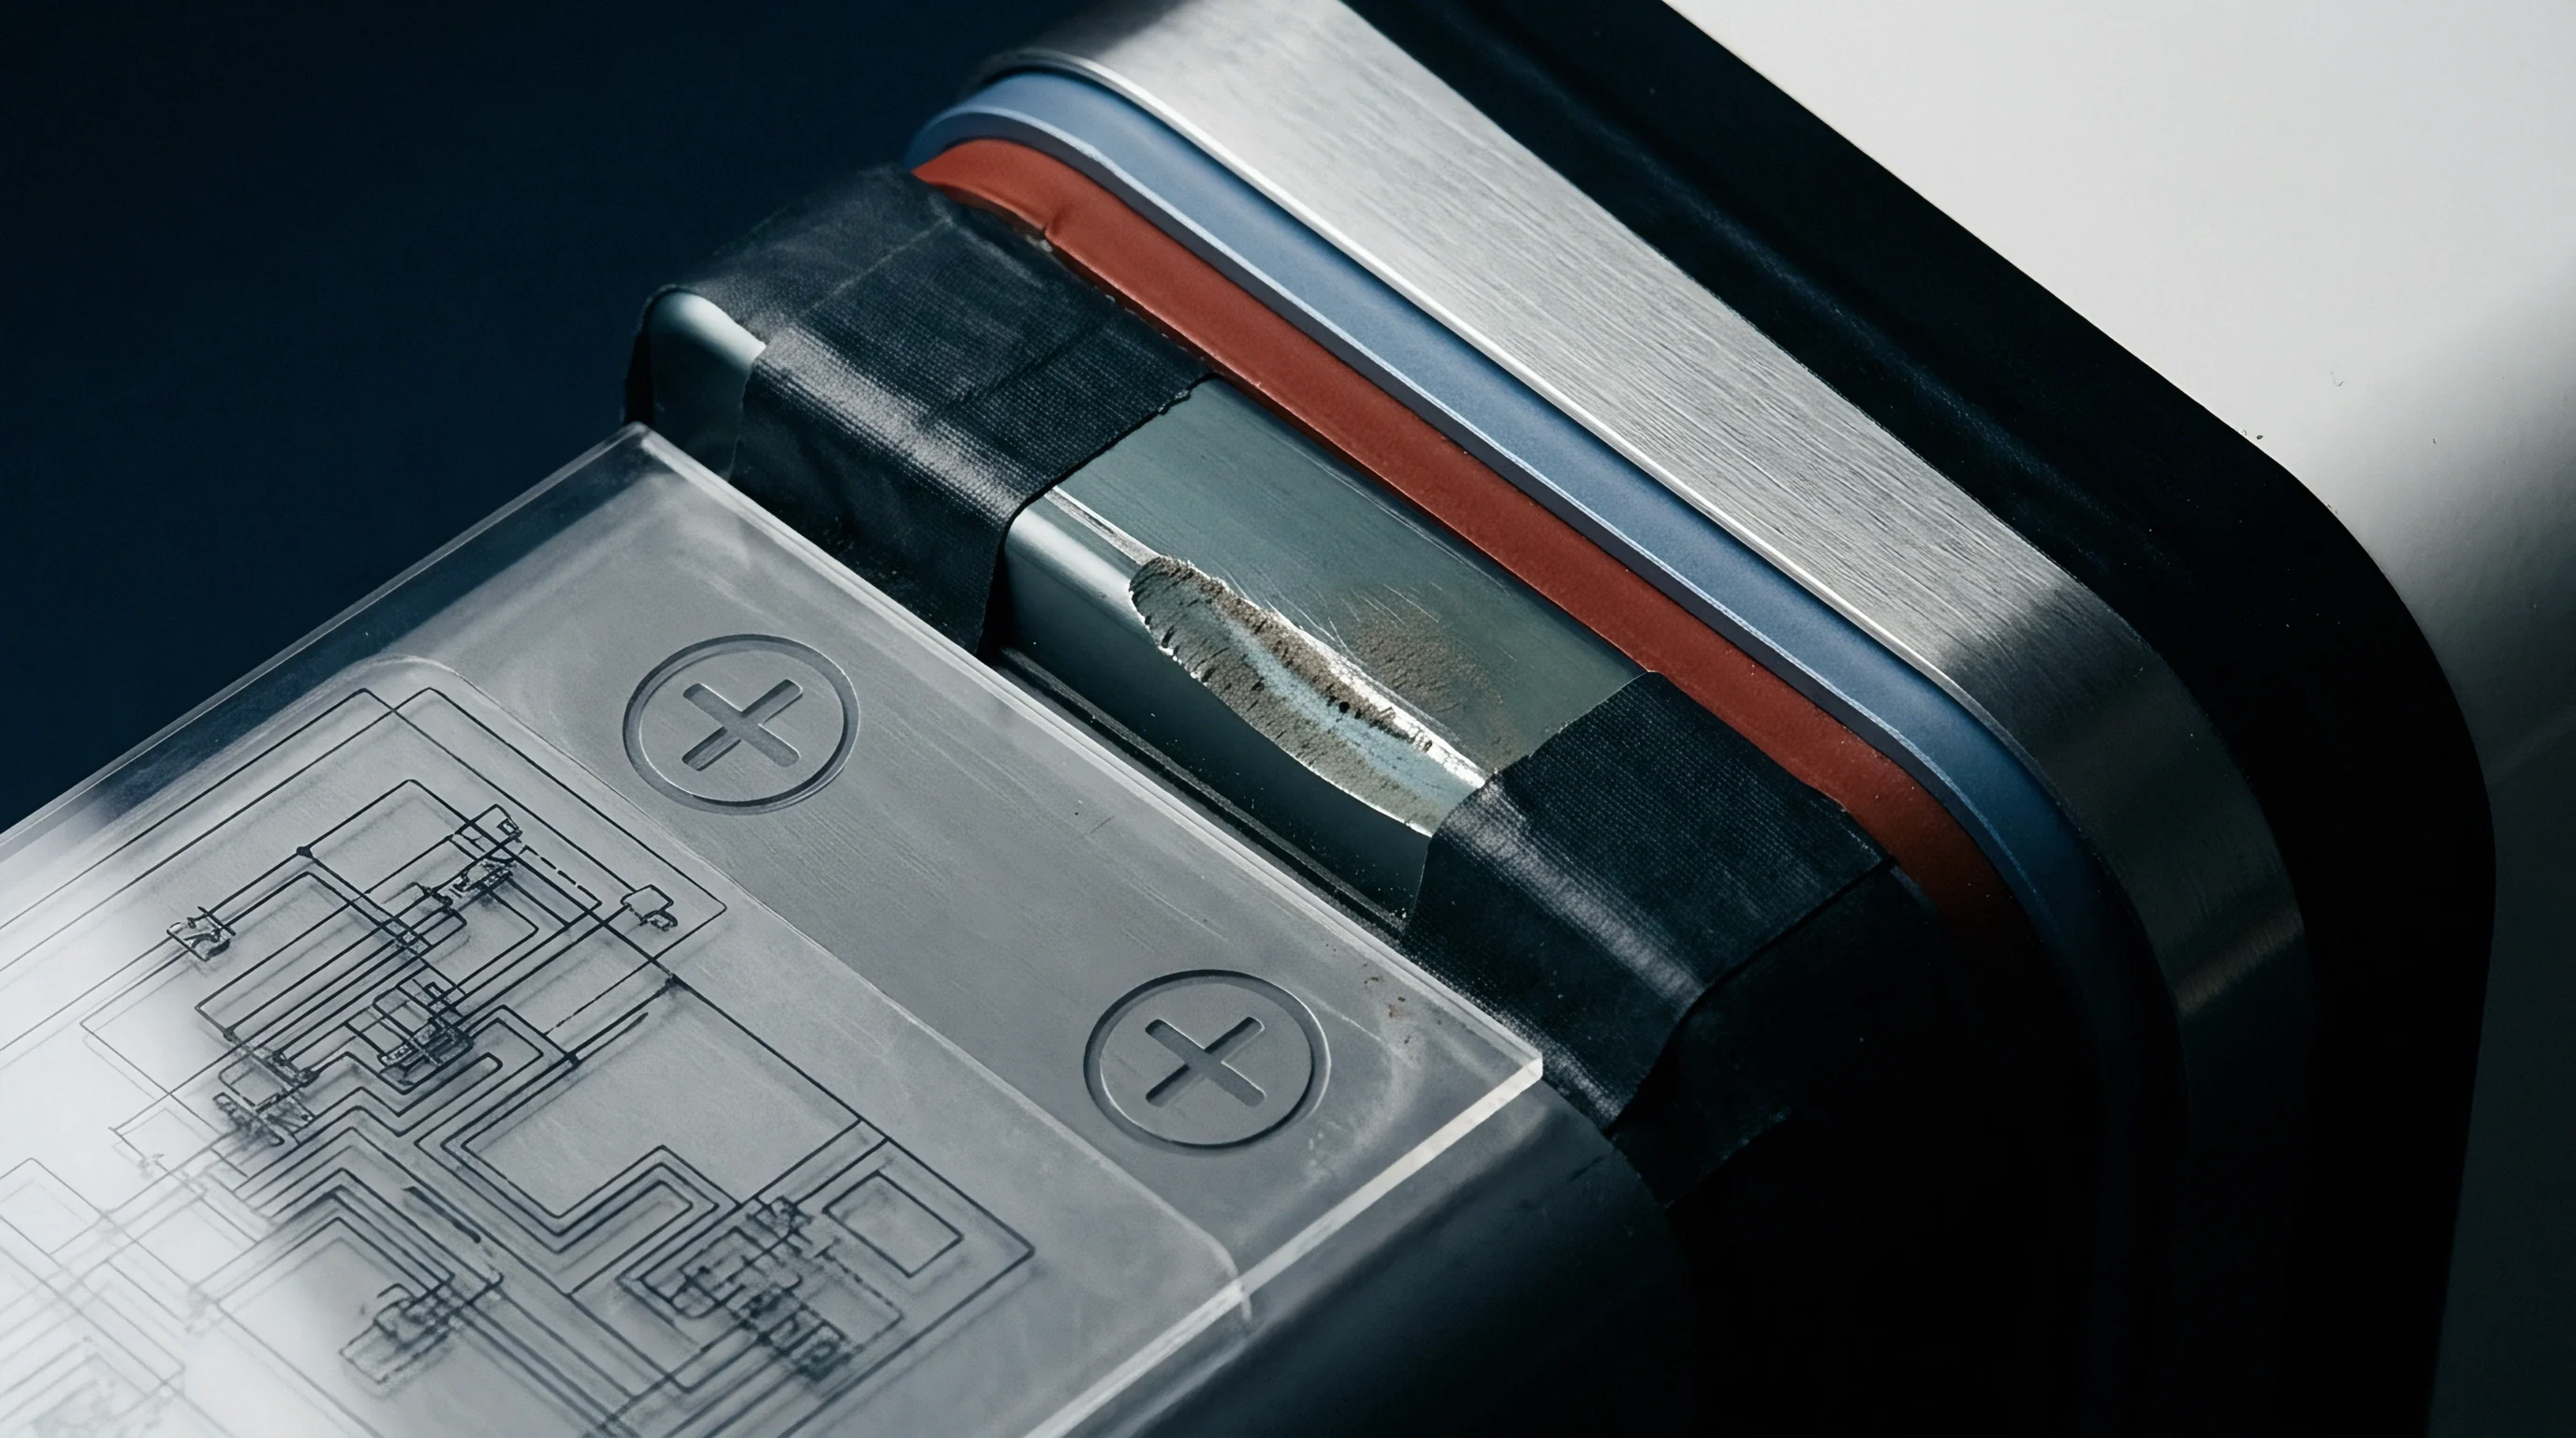
Internal cell architecture dictates whether a prismatic design survives thousands of fast-charge cycles without developing micro-shorts. The coated anode must physically overlap cathode edges in both length and width. When that overhang margin drops below 0.50 millimeters, lithium ions leaving the cathode edges plate out as metallic dendrites on bare foil edges instead of intercalating into graphite.
Standard factory electrical checks rely heavily on open-circuit voltage and AC impedance, but these tests cannot detect internal alignment errors that compromise isolation in fresh, uncycled cells. Destructive teardowns and industrial computed tomography scanning remain the only reliable ways to verify jelly roll or Z-fold stack alignment.
Electrode overhang mismatch below 0.5 millimeters under high-resolution computed tomography correlates with localized lithium plating during fast charging at 10 degrees Celsius.
High-speed X-ray inspection allows incoming docks to evaluate anode overhang non-destructively on sample batches. Machine vision algorithms measure the four corners of every stacked layer. On automated production lines, stacking table drift and winding mandrel wear cause alignment to shift gradually across manufacturing shifts.

Why Do Alignment Faults Escape Open Circuit Tests?
Open-circuit voltage measures bulk thermodynamic equilibrium between the positive and negative active materials, blind to localized geometry. A cell with an anode overhang deficiency of 0.20 millimeters shows the exact same open-circuit voltage as a properly aligned cell on day one. Only after extended cycling, when concentrated edge current density drives dendrites through the separator, does micro-shorting register as elevated self-discharge.
During electrode slitting, dull rotary blades throw lateral copper burrs exceeding 12 micrometers that can pierce polymer separators. Under mechanical winding tension, these metal slivers press into the ceramic-coated polyethylene, eventually causing micro-shorts over the operating life of the cell.
Elevated K-values signal active dendrite formation. Logging daily open-circuit voltage drop over a 21-day quarantine flags cells suffering from internal micro-leakage. This voltage decay rate, measured in millivolts per day, isolates outliers that show normal initial capacity but carry damaged separators beneath the surface.
Formal batch rejection requires clear physical evidence. When cross-sectioning reveals delamination between current collector foils and active coatings, entire production lots are rejected back to the coating line.
Whether high-speed computed tomography can scan every individual electrode layer across thousand-cell batches without wrecking manufacturing takt times remains unresolved on production floors.

Arithmetic
Attribute inspection reduces data to pass-fail bins, throwing away continuous measurement detail. Variables sampling under ISO 3951-1 and ANSI/ASQ Z1.9 works directly with continuous data ~ such as 0.33C discharge capacity, 1 kHz AC internal resistance, and laser-measured shell thickness. By tracking the sample mean and standard deviation, variables plans assess lot acceptability with far fewer samples than attribute schemes require.
Evaluating a 5,000-cell lot of 280 Ah lithium iron phosphate cells demonstrates how the ISO 3951-1 s-method works in practice. With a lower specification limit of 280.0 Ah, inspectors pull a random sample of 35 cells across five master pallets for baseline capacity cycling at 25 degrees Celsius in environmental chambers.
The difference between rated datasheet capacity and actual delivered batch spread determines whether cell balancing circuits overheat during pack commissioning.
The ISO 3951-1 evaluation follows five operational steps.
- Record the individual discharge capacity values across all sampled cells following standardized 0.33C constant-current constant-voltage cycling at 25 degrees Celsius.
- Calculate the sample arithmetic mean across the dataset to define the central process performance level.
- Compute the sample standard deviation using the root-mean-square formula with Bessel correction for sample degrees of freedom.
- Determine the lower quality statistic by subtracting the lower specification limit from the sample mean and dividing the difference by the sample standard deviation.
- Compare the calculated quality statistic against the acceptability constant k established by the designated inspection level in ISO 3951-1.
If the 35 sampled cells produce a mean of 282.40 Ah with a standard deviation of 0.85 Ah, the lower quality statistic calculates to 2.82. For a contract specifying Inspection Level II at an Acceptable Quality Limit of 0.40 percent, ISO 3951-1 Table 2-A sets the acceptability constant k at 1.75. Because 2.82 is greater than 1.75, the batch comfortably clears statistical acceptance.
| Lot Size Band | Inspection Level | Sample Size (n) | AQL 0.25% (k) | AQL 0.40% (k) | AQL 0.65% (k) | Minimum Cpk |
|---|---|---|---|---|---|---|
| 1,201 to 3,200 | Level II (Normal) | 25 | 2.00 | 1.82 | 1.65 | 1.33 |
| 3,201 to 10,000 | Level II (Normal) | 35 | 1.93 | 1.75 | 1.58 | 1.33 |
| 10,001 to 35,000 | Level II (Normal) | 50 | 1.87 | 1.69 | 1.53 | 1.50 |
| 35,001 to 150,000 | Level II (Normal) | 75 | 1.81 | 1.64 | 1.47 | 1.50 |
| Values derived from ISO 3951-1 single sampling s-method tables under normal inspection conditions. Minimum Cpk values represent process capability floors required to sustain indicated quality statistic thresholds. | ||||||
Evaluating 1 kHz AC internal resistance uses the upper specification limit formula instead, subtracting the sample mean from the upper limit and dividing by the standard deviation. Keeping standard deviation tight allows lots to pass inspection even if the mean impedance edges close to the upper ceiling.
Writing ISO 3951-1 Table 2-A directly into purchase agreements moves acceptance criteria from simple failure counts to an empirical demonstration of process capability.

Disposition
Quarantine begins as soon as incoming lots fail statistical criteria. Warehouse management software locks the pallet barcode ranges to prevent material handling equipment from moving cells to assembly bays. Barricaded staging areas and quarantine tape hold rejected pallets while documentation transfers back to the manufacturer.
If batches fail on impedance distribution or bulging cans, the Material Review Board meets to determine commercial next steps, reviewing CMM reports, capacity histograms, and factory calibration certificates. Concession acceptance is restricted strictly to Class D cosmetic flaws that carry zero impact on operating life.
When non-conformances stem from Class B issues ~ such as bimodal capacity distributions ~ supply agreements push full-lot sorting expenses to the vendor. Contract test labs charge between 2.50 dollars and 4.00 dollars per cell for complete dock screening, covering capacity cycling, ACIR logging, and optical laser can scanning.
Customs rules complicate return shipping for hazardous lithium-ion shipments. Cells brought in under temporary import bonds have to return via certified dangerous-goods maritime freight or undergo witness-verified destruction at bonded domestic recycling centers to qualify for duty drawbacks.
The quarantine log is closed once the factory settles credit for the scrapped material and logistics clears the rejected pallets back to the port of origin.