Helium Mass Spectrometry for Micro Leak Detection in Battery Envelopes
Inline helium mass spectrometry detects sub-micron battery envelope leaks down to 10-8 mbar l/s, preventing moisture-induced HF corrosion and solvent loss.


Physics
Gas transport through microscopic breaches in battery containment follows fluid dynamic regimes defined by Knudsen numbers. In lithium-ion pouch laminates or welded prismatic cans, physical channel dimensions dictate whether gas moves via viscous laminar flow, transitional flow, or pure molecular diffusion. A helium mass spectrometer detects helium-4 atoms passing from a higher-pressure region or pre-charged cell interior into an evacuated analytical manifold.
With an atomic diameter of roughly 0.26 nanometers and a molecular mass of 4.0026 atomic mass units, helium effuses through sub-micron apertures far faster than atmospheric nitrogen, oxygen, or volatile electrolyte solvent vapors.
Tracer gas transport is defined by the Knudsen number ~ the ratio of a gas molecule’s mean free path to the characteristic dimension of the leak channel. At room temperature, atmospheric air has a mean free path of roughly 68 nanometers, while helium at atmospheric pressure sits around 192 nanometers. When a seal defect or weld micro-crack is significantly wider than this mean free path, gas travels in the viscous laminar regime governed by Poiseuille equations.
Once channel width drops below 0.1 micrometers, molecular collisions with channel walls dominate over collisions between molecules. Transport shifts into Knudsen molecular flow, where throughput depends on molecular velocity and gas temperature rather than fluid viscosity.
Mass spectrometer leak detectors ionize gas molecules inside an ultra-high vacuum chamber, accelerate them through an electrostatic field, and deflect them using a magnetic field that separates ions by their mass-to-charge ratio. Because helium-4 yields a distinct mass-to-charge ratio of 4, an isolated collector plate records an electrical current directly proportional to the partial pressure of helium in the chamber. Detector sensitivity reaches down to 1.0 x 10⁻¹² millibar liters per second (mbar l/s), or 1.0 x 10⁻¹³ Pascal cubic meters per second (Pa m³/s).
Resolving signals at this level requires tracking ambient helium background levels, which hover around 5.2 parts per million in ordinary air.
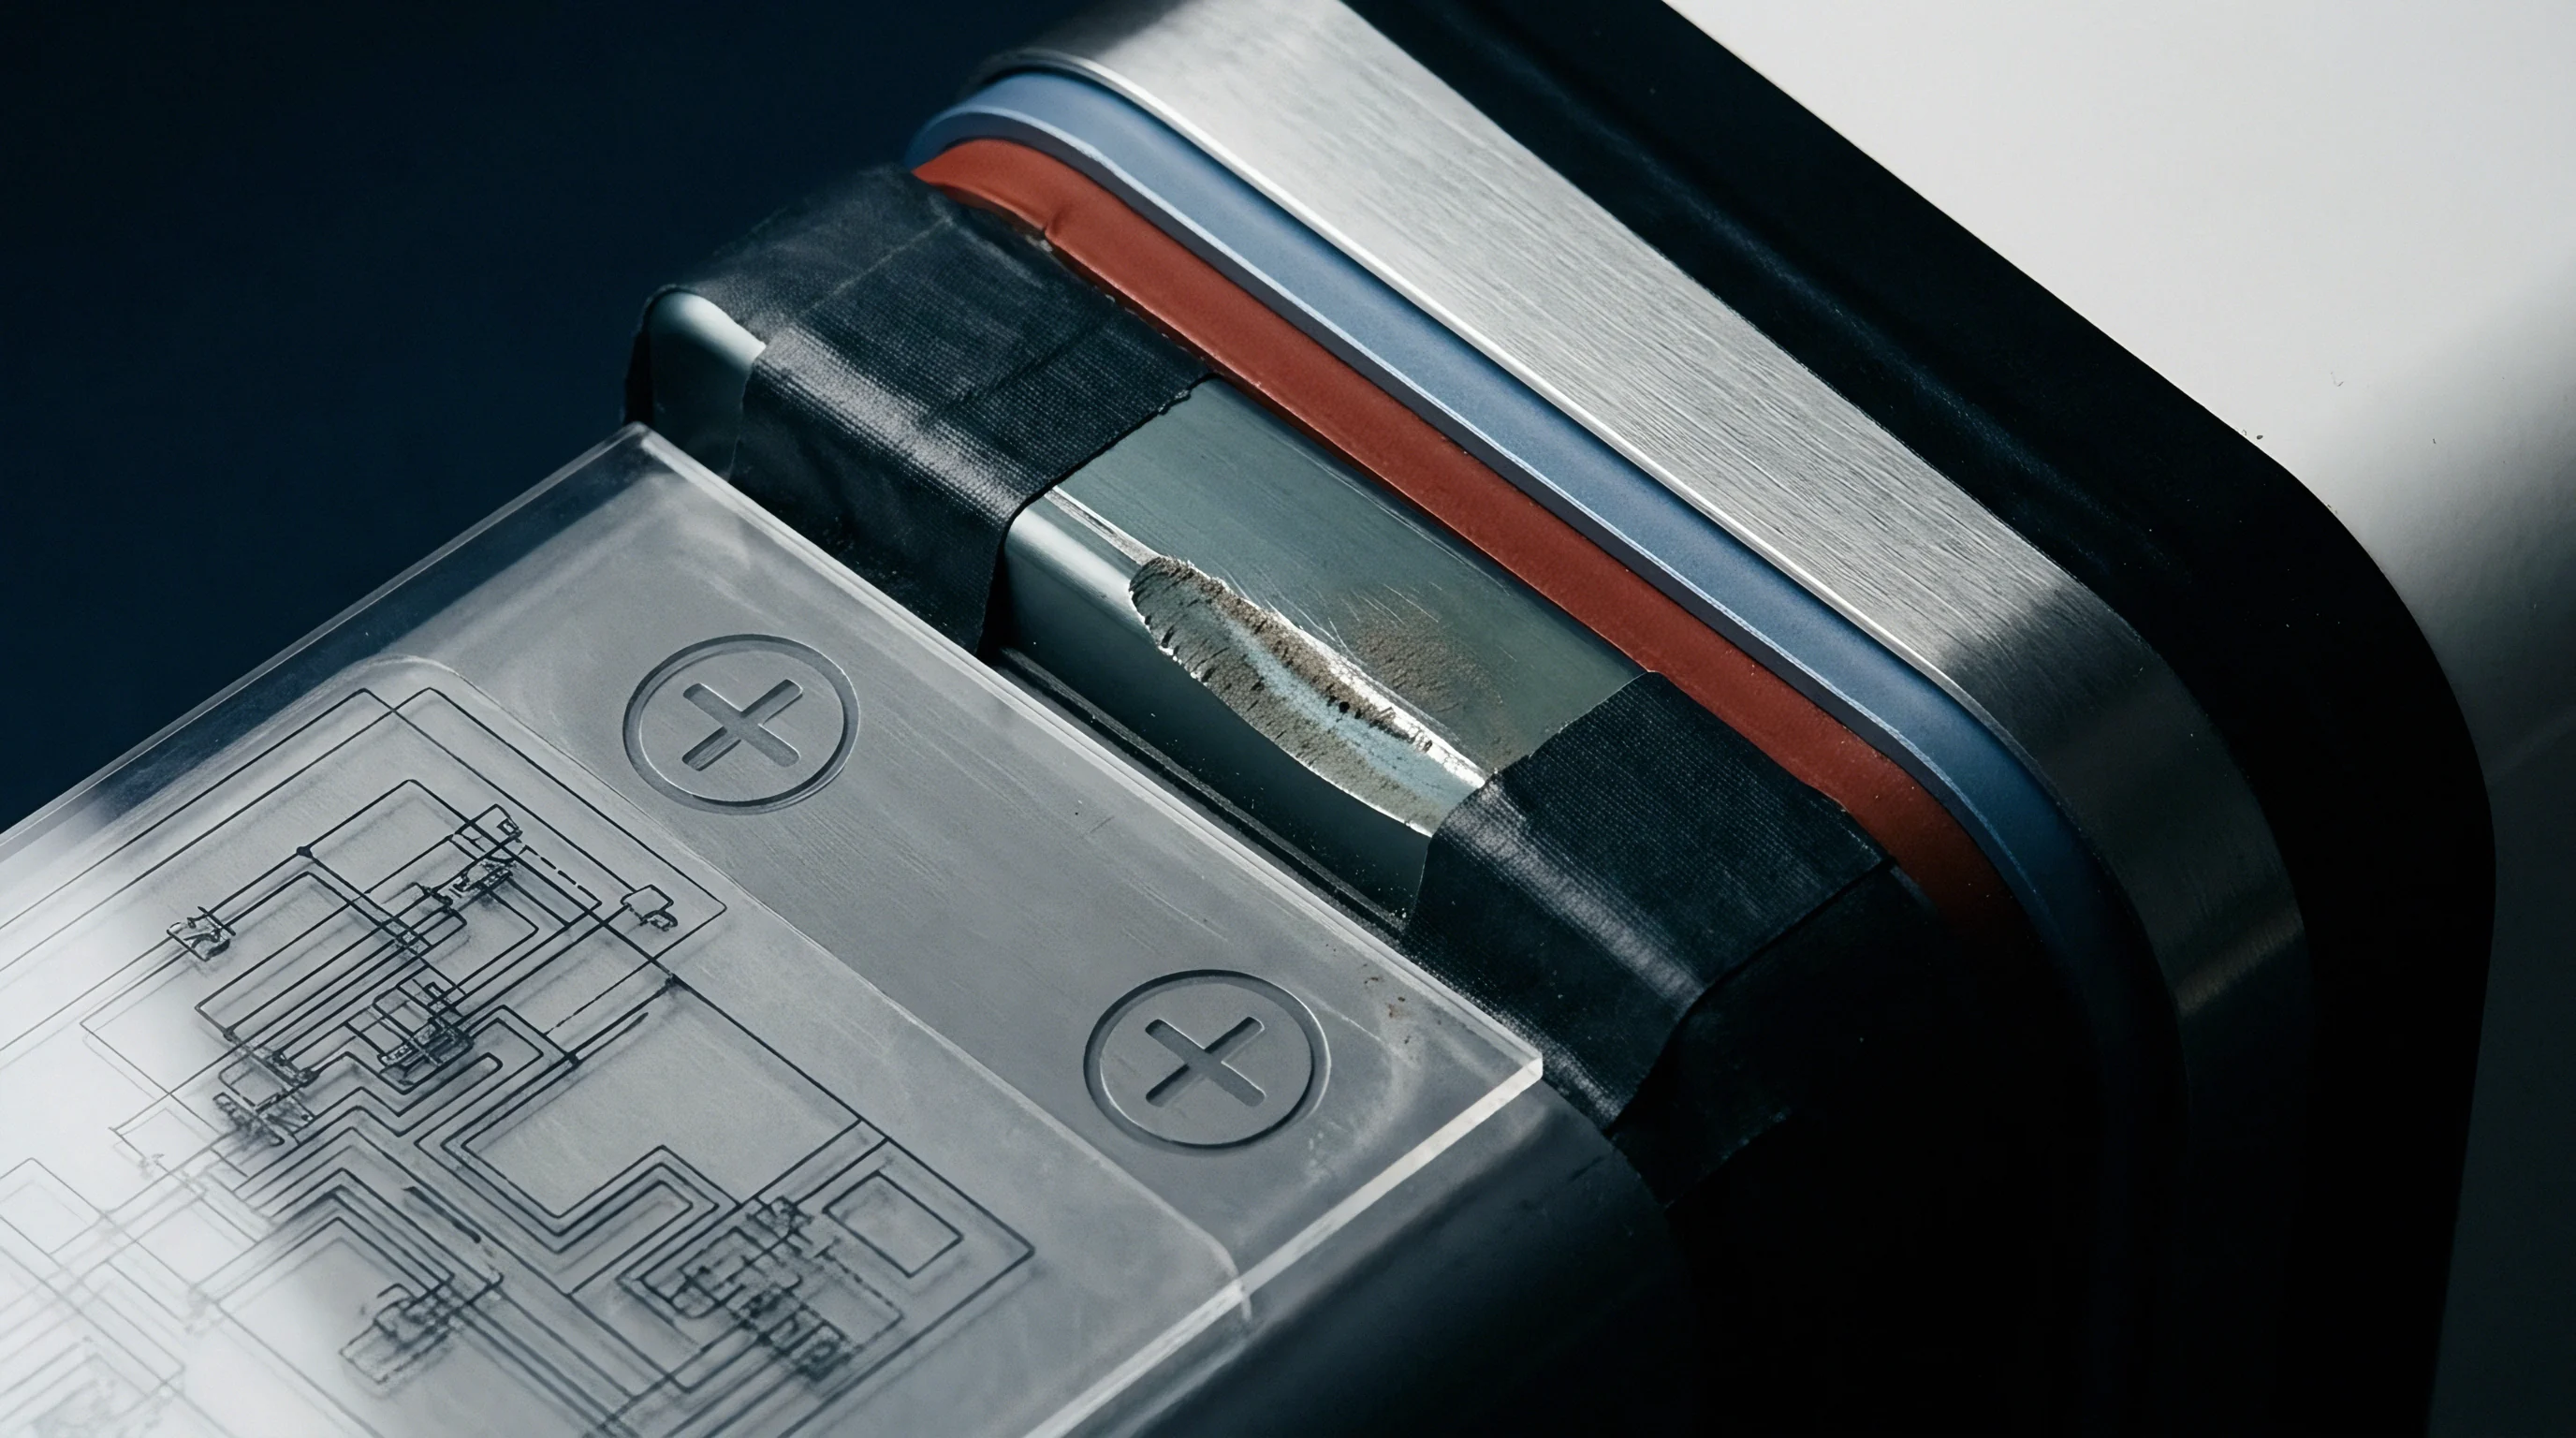
Gas Dynamics in Sub-Micron Defects
Molecular flow takes over when the mean free path of tracer atoms exceeds the internal diameter of the leak channel. In this regime, gas throughput scales linearly with the partial pressure differential across the barrier rather than the square of absolute pressure. Conductance through a circular capillary leak in molecular flow follows Knudsen’s formula:
C_m = (1/6) sqrt((2 pi R T) / M) (d^3 / L)
Here, R represents the universal gas constant, T is absolute temperature in Kelvin, M is molecular mass in kilograms per mole, d is capillary diameter in meters, and L is channel length in meters. Helium flows through a micro-channel faster than nitrogen by a factor equal to the square root of their inverse mass ratio. Comparing helium (4 g/mol) to nitrogen (28 g/mol) yields a theoretical effusion ratio of roughly 2.64.
Under ambient conditions, a channel 100 nanometers long and 50 nanometers wide permits helium transit while severely restricting larger organic solvent molecules.
Viscous flow develops when leak dimensions expand past 1 micrometer. In laminar viscous flow, the gas velocity profile becomes parabolic, peaking along the central axis of the channel. Volumetric flow rate scales with the fourth power of channel diameter and inversely with dynamic viscosity.
Because helium has a dynamic viscosity of roughly 19.6 micropascal-seconds at 20 degrees Celsius compared to 17.8 micropascal-seconds for air, helium moves slightly slower than air under pure viscous laminar conditions at identical pressure differentials. Testing protocols must account for this behavior. A leak measuring 1.0 x 10⁻⁴ mbar l/s operates in viscous flow, whereas a leak measuring 1.0 x 10⁻⁷ mbar l/s operates in molecular flow.
Converting measured helium leak rates into equivalent air or liquid electrolyte leakage without determining the prevailing flow regime introduces substantial calculation errors.
Helium leakage exceeding 1.0 x 10⁻⁷ mbar l/s under a 1 bar pressure differential corresponds to moisture ingress rates above 0.05 milligrams per year.
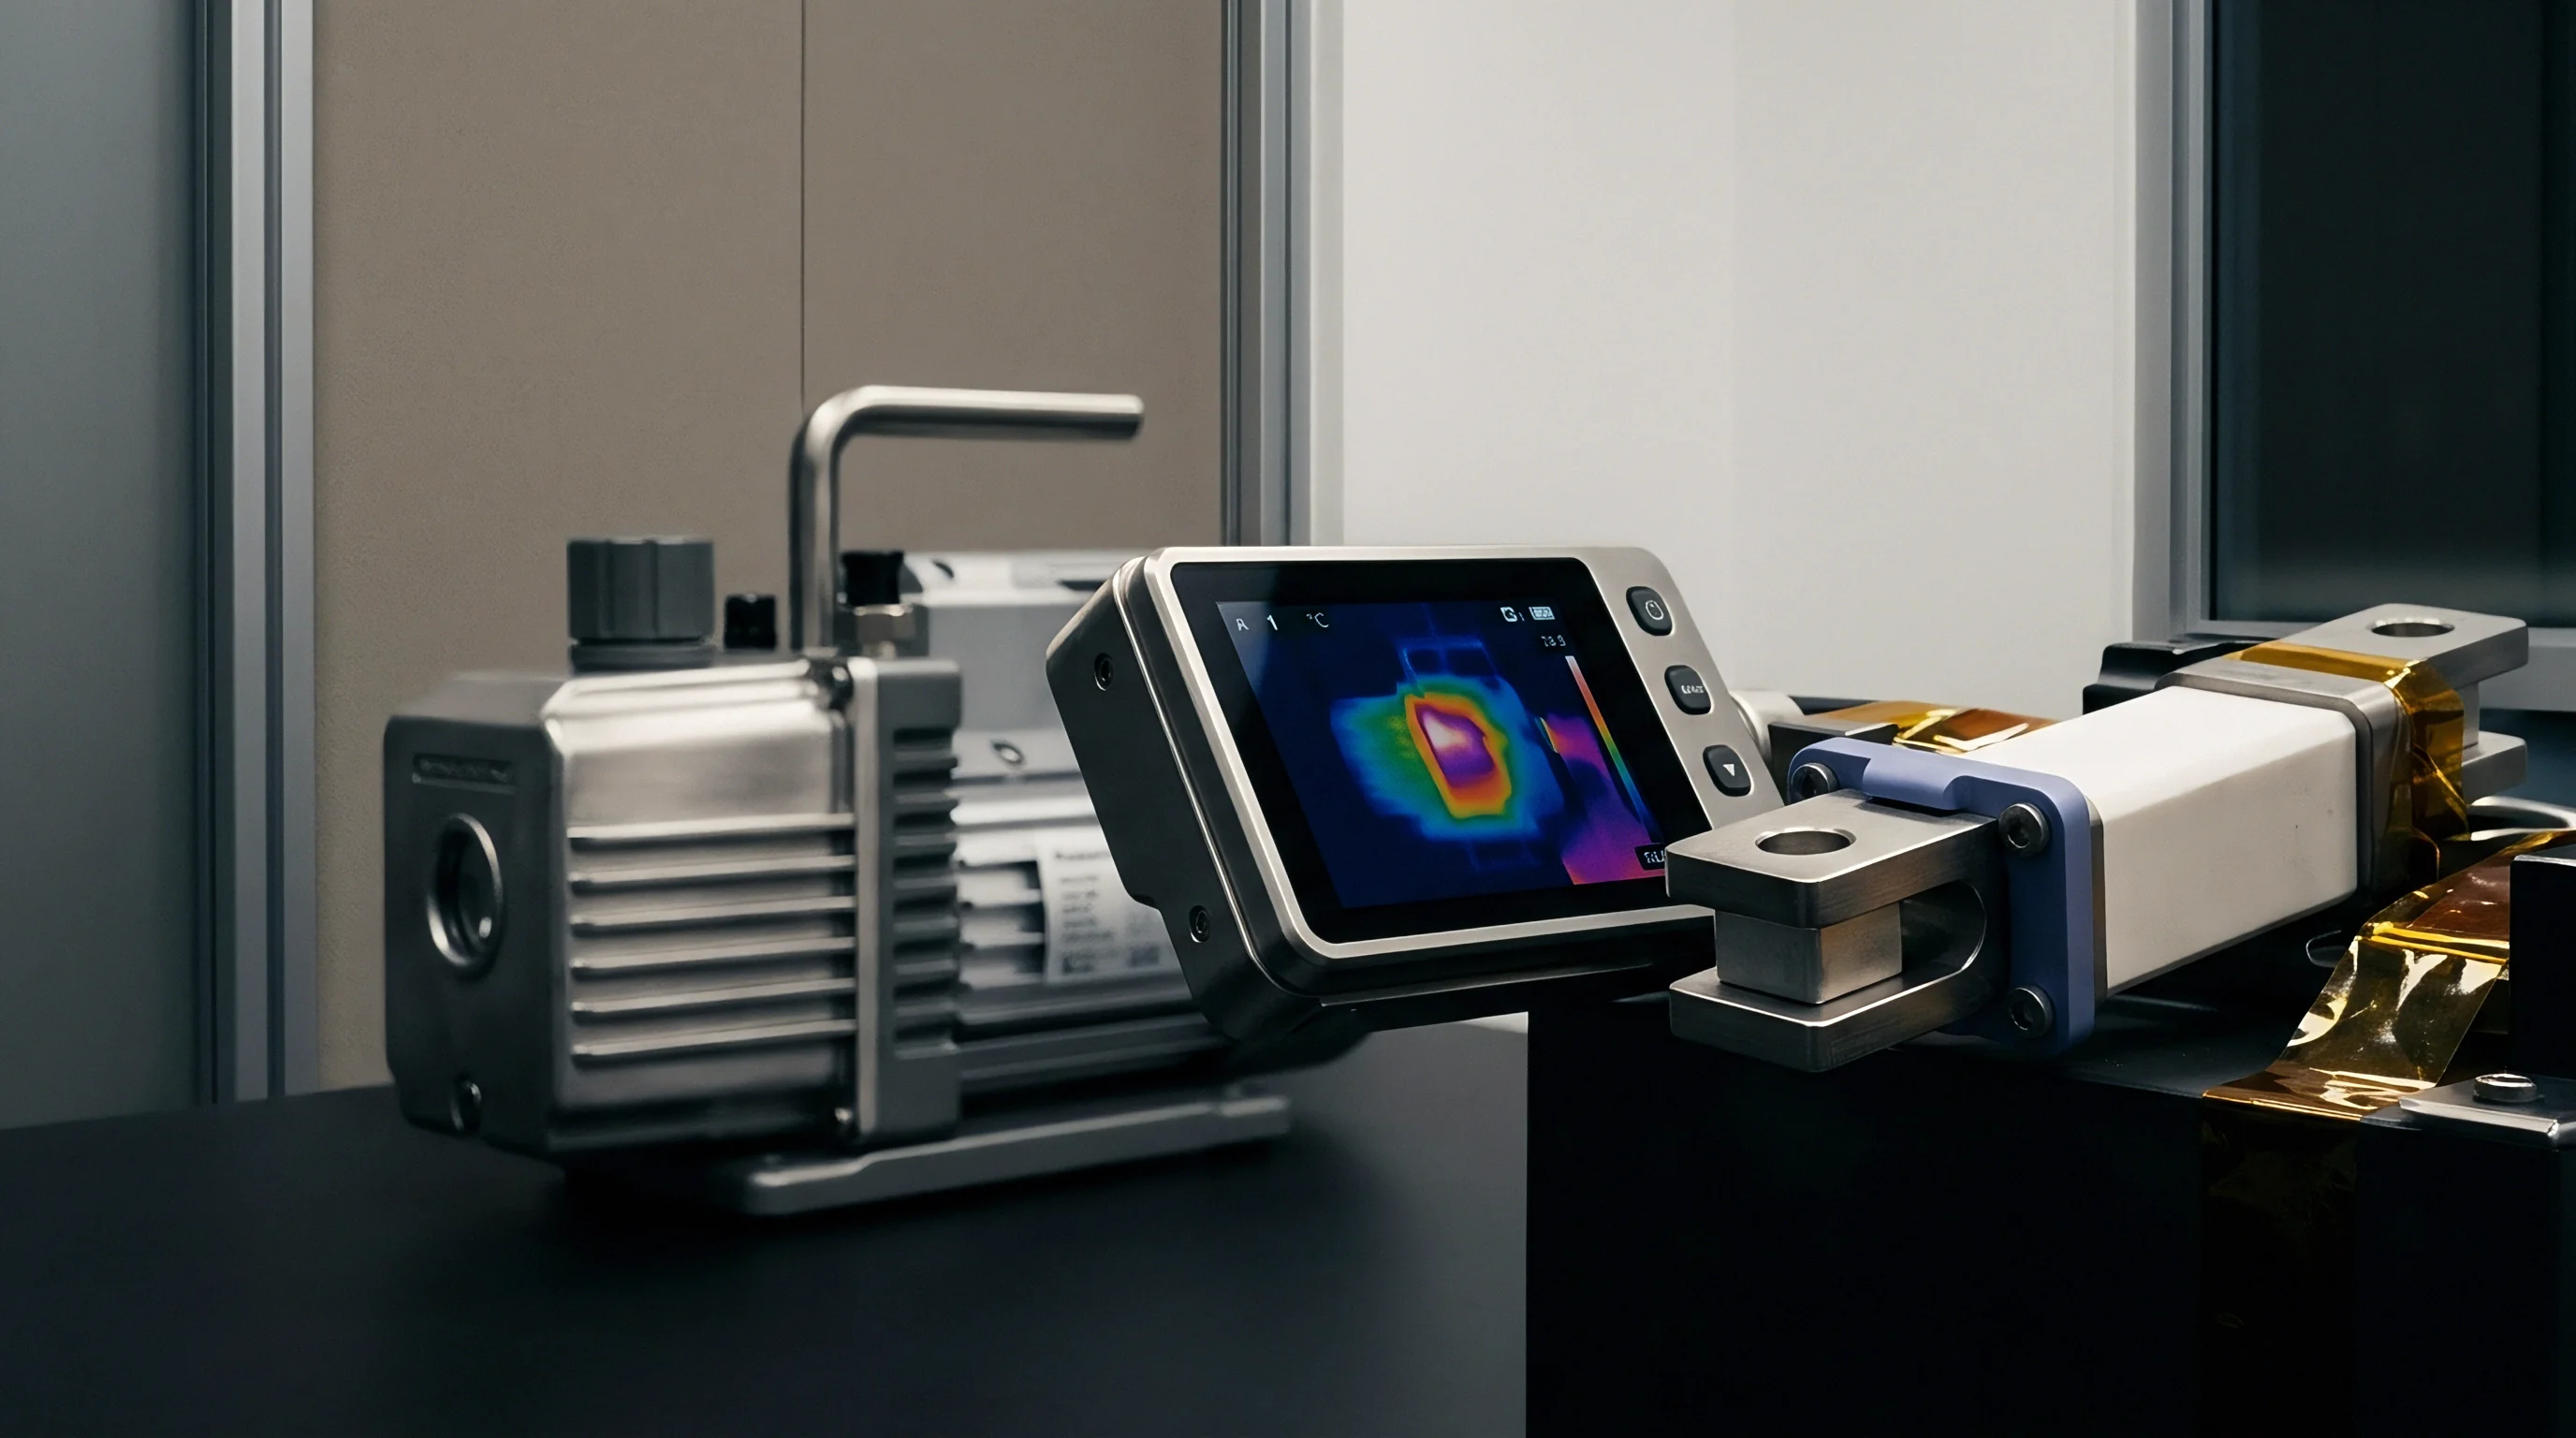
Knudsen Flow Regimes and Molecular Drift
Pressure differentials across a seal drive gas molecules through tortuous pathways formed by micro-cracks, incomplete thermal fusion, or material inclusions. In production battery seals, micro-leaks rarely resemble perfect cylindrical capillaries. Micro-fractures in ceramic seam coatings or pinholes in pouch foil laminates present irregular cross-sections and varying internal diameters, so effective flow conductance behaves like a series-parallel network of changing Knudsen numbers along the defect.
Knudsen diffusion dictates flow through these micro-channels. As internal cell pressure drops during air transit or external pressure rises during chamber evacuation, the Knudsen number shifts dynamically. Gas molecules collide repeatedly with rough channel walls, adsorbing briefly before re-emitting in random directions.
This wall interaction creates a delay between initial tracer gas exposure and steady-state signal detection on the mass spectrometer. In long, narrow pouch seal channels, helium signal response times can exceed 30 seconds. Setting inspection dwell times below this physical threshold risks false negatives, passing defective cells that haven’t released tracer gas yet.

Converting Helium Tracer Rates to Air Equivalents
Mass spectrometer sensors output tracer leak rates in millibar liters per second. Translating a helium test result into an equivalent standard air leak rate requires applying the transport equation for the active flow regime. Standards such as ASTM E498 and ISO 20485 spell out conversion routines to verify compliance against tightness specifications.
For molecular flow (leak rates below 1.0 x 10⁻⁶ mbar l/s), the equivalent air leak rate Q_air relates to the measured helium leak rate Q_He through the square root of their molecular weights:
Q_air = Q_He sqrt(M_He / M_air) = Q_He sqrt(4.003 / 28.97) = Q_He 0.372
In viscous laminar flow (leak rates above 1.0 x 10⁻⁴ mbar l/s), dynamic viscosity governs the conversion rather than molecular weight, changing the relationship to:
Q_air = Q_He (viscosity_He / viscosity_air) = Q_He (19.6 / 17.8) = Q_He 1.101
Applying the viscous conversion factor to a molecular micro-leak overstates the air equivalent by nearly 300 percent. Engineering specifications must state explicitly whether the maximum leak limit refers to pure helium tracer flow under vacuum or equivalent air flow under atmospheric delta-p. A specification requiring a maximum air leak of 1.0 x 10⁻⁷ mbar l/s translates to a helium mass spectrometer reject threshold of 2.69 x 10⁻⁷ mbar l/s in the molecular flow regime.
Estimating liquid electrolyte loss from gas leak rates brings additional complexity. Solvents such as ethylene carbonate, dimethyl carbonate, and ethyl methyl carbonate have surface tensions from 28 to 35 millinewtons per meter and dynamic viscosities between 0.65 and 1.90 millipascal-seconds. Capillary pressure actively resists liquid entry or escape in narrow channels; a 0.2-micrometer channel needs an internal pressure differential above 3 bar to force liquid solvent through.
Instead, solvent vaporizes at the internal liquid-gas interface, and volatile organic vapor diffuses through the dry section in the gas phase. Helium mass spectrometry catches these physical channels before liquid flow starts, serving as an effective preventive screen.
What structural modifications occur within sub-micron polymer channel walls when subjected to sustained ultra-high vacuum during tracer detection?


Envelope
Containment architectures in lithium-ion cells rely on thin composite barriers or welded metallic shells to isolate volatile electrochemistry from ambient air. Cells generally follow three form factors: flexible pouch laminates, rigid aluminum or steel prismatic cans, and cylindrical metallic housings. Each construction has specific mechanical vulnerabilities where micro-leaks form during production, thermal cycling, or transport stress.
Defects spanning 10 nanometers to 5 micrometers compromise long-term hermeticity without ever displaying visible electrolyte liquid.
Flexible pouch cells use a multi-layer aluminum laminate usually measuring 113 to 152 micrometers thick. The stack includes an outer polyamide protective layer, an adhesive, an embedded thin aluminum foil core (40 to 50 micrometers thick) acting as the primary gas and moisture barrier, an acid-resistant bonding layer, and an inner heat-sealable cast polypropylene (cPP) layer. The perimeter heat seal is the primary vulnerability.
During sealing, thermal energy melts opposing cPP layers so polymer chains interdiffuse and fuse as they cool. Fluctuations in sealing temperature, pressure, dwell time, or surface cleanliness create micro-voids across this polymer seal junction.
Prismatic and cylindrical hard cases use metal-to-metal joints closed by laser welding or mechanical crimping. Prismatic shells feature an extruded or deep-drawn aluminum alloy box (typically AA3003 or AA1050) capped with a top cover lid. The perimeter laser weld seam must remain leak-tight along its entire length.
Micro-cracking, blowholes from volatile organic residue, gas porosity from trapped hydrogen, and weld start-stop crater defects can all ruin hermetic performance. Cylindrical cells use a mechanical double- or triple-crimp seal to bind the header assembly, current interrupt device (CID), and safety vent gasket into the nickel-plated steel can groove. Radial compression must stay uniform across the full 360-degree circumference to prevent micro-pathways from opening between the synthetic rubber or fluorinated elastomer gasket and the metal.

Pouch Cell Heat Seal Defect Typologies
Aluminum laminates depend on an inner thermoplastic polyolefin layer to form a seal under heat and pressure. Micro-leaks in pouch seals usually trace back to specific physical issues during thermal welding. Contamination of the seal surface by liquid electrolyte during cell filling is a primary cause.
When sealing jaws compress electrolyte containing volatile carbonate solvents and lithium salts between the cPP layers, the solvent flashes off while solid lithium hexafluorophosphate (LiPF6) precipitates into salt crystals. These crystals block polymer chain entanglement, leaving micro-channels that bridge the cell cavity to the outside environment.
Thermal contraction stress causes another class of pouch seal defects. Rapid cooling in the seal area creates local density shifts in the semi-crystalline cast polypropylene, forming internal micro-fissures along the boundary between the bulk cPP phase and the aluminum foil bonding layer. Channel leaks also crop up near the tab step-up area, where metal tab leads (aluminum positive, copper/nickel negative) exit the pouch.
To seal around these leads, manufacturers apply tab sealant tape ~ a modified polyolefin film pre-coated onto the metal. Incomplete melting of this film or misaligned tab tape leaves open voids along the vertical flanks of the conductor. These tab flank micro-channels are highly tortuous, often passing bubble-emission tests while registering clearly on helium mass spectrometers set to 1.0 x 10⁻⁸ mbar l/s sensitivity.

Prismatic Hard Case Can Welds
Laser welding aluminum alloys creates thermal gradients that invite micro-fissures along the weld bead. Prismatic cells typically feature top cover plates welded to deep-drawn cans using continuous-wave fiber or disk lasers. The AA3003 alloy used in cans contains manganese, whereas cap plates often run AA1050 or AA6061.
Keyhole instability during fast laser welding can trap shielding gas (argon or helium) or air in the melt pool, leaving spherical micro-porosity pockets upon cooling. If these porosity pockets overlap, they create a continuous opening straight through the weld throat.
Solidification cracking occurs when low-melting-point eutectic phases segregate to grain boundaries as the weld pool cools. Tensile stress from thermal contraction pulls these weakened boundaries apart, creating micro-fractures under 500 nanometers wide. Rupture discs and safety vents stamped directly into the prismatic lid carry additional leak risk.
These thin metal diaphragms, coined down to 20 to 50 micrometers thick, can develop micro-pinholes from stamping die wear or localized corrosion. Helium testing identifies these vent defects before cells are integrated into battery modules.
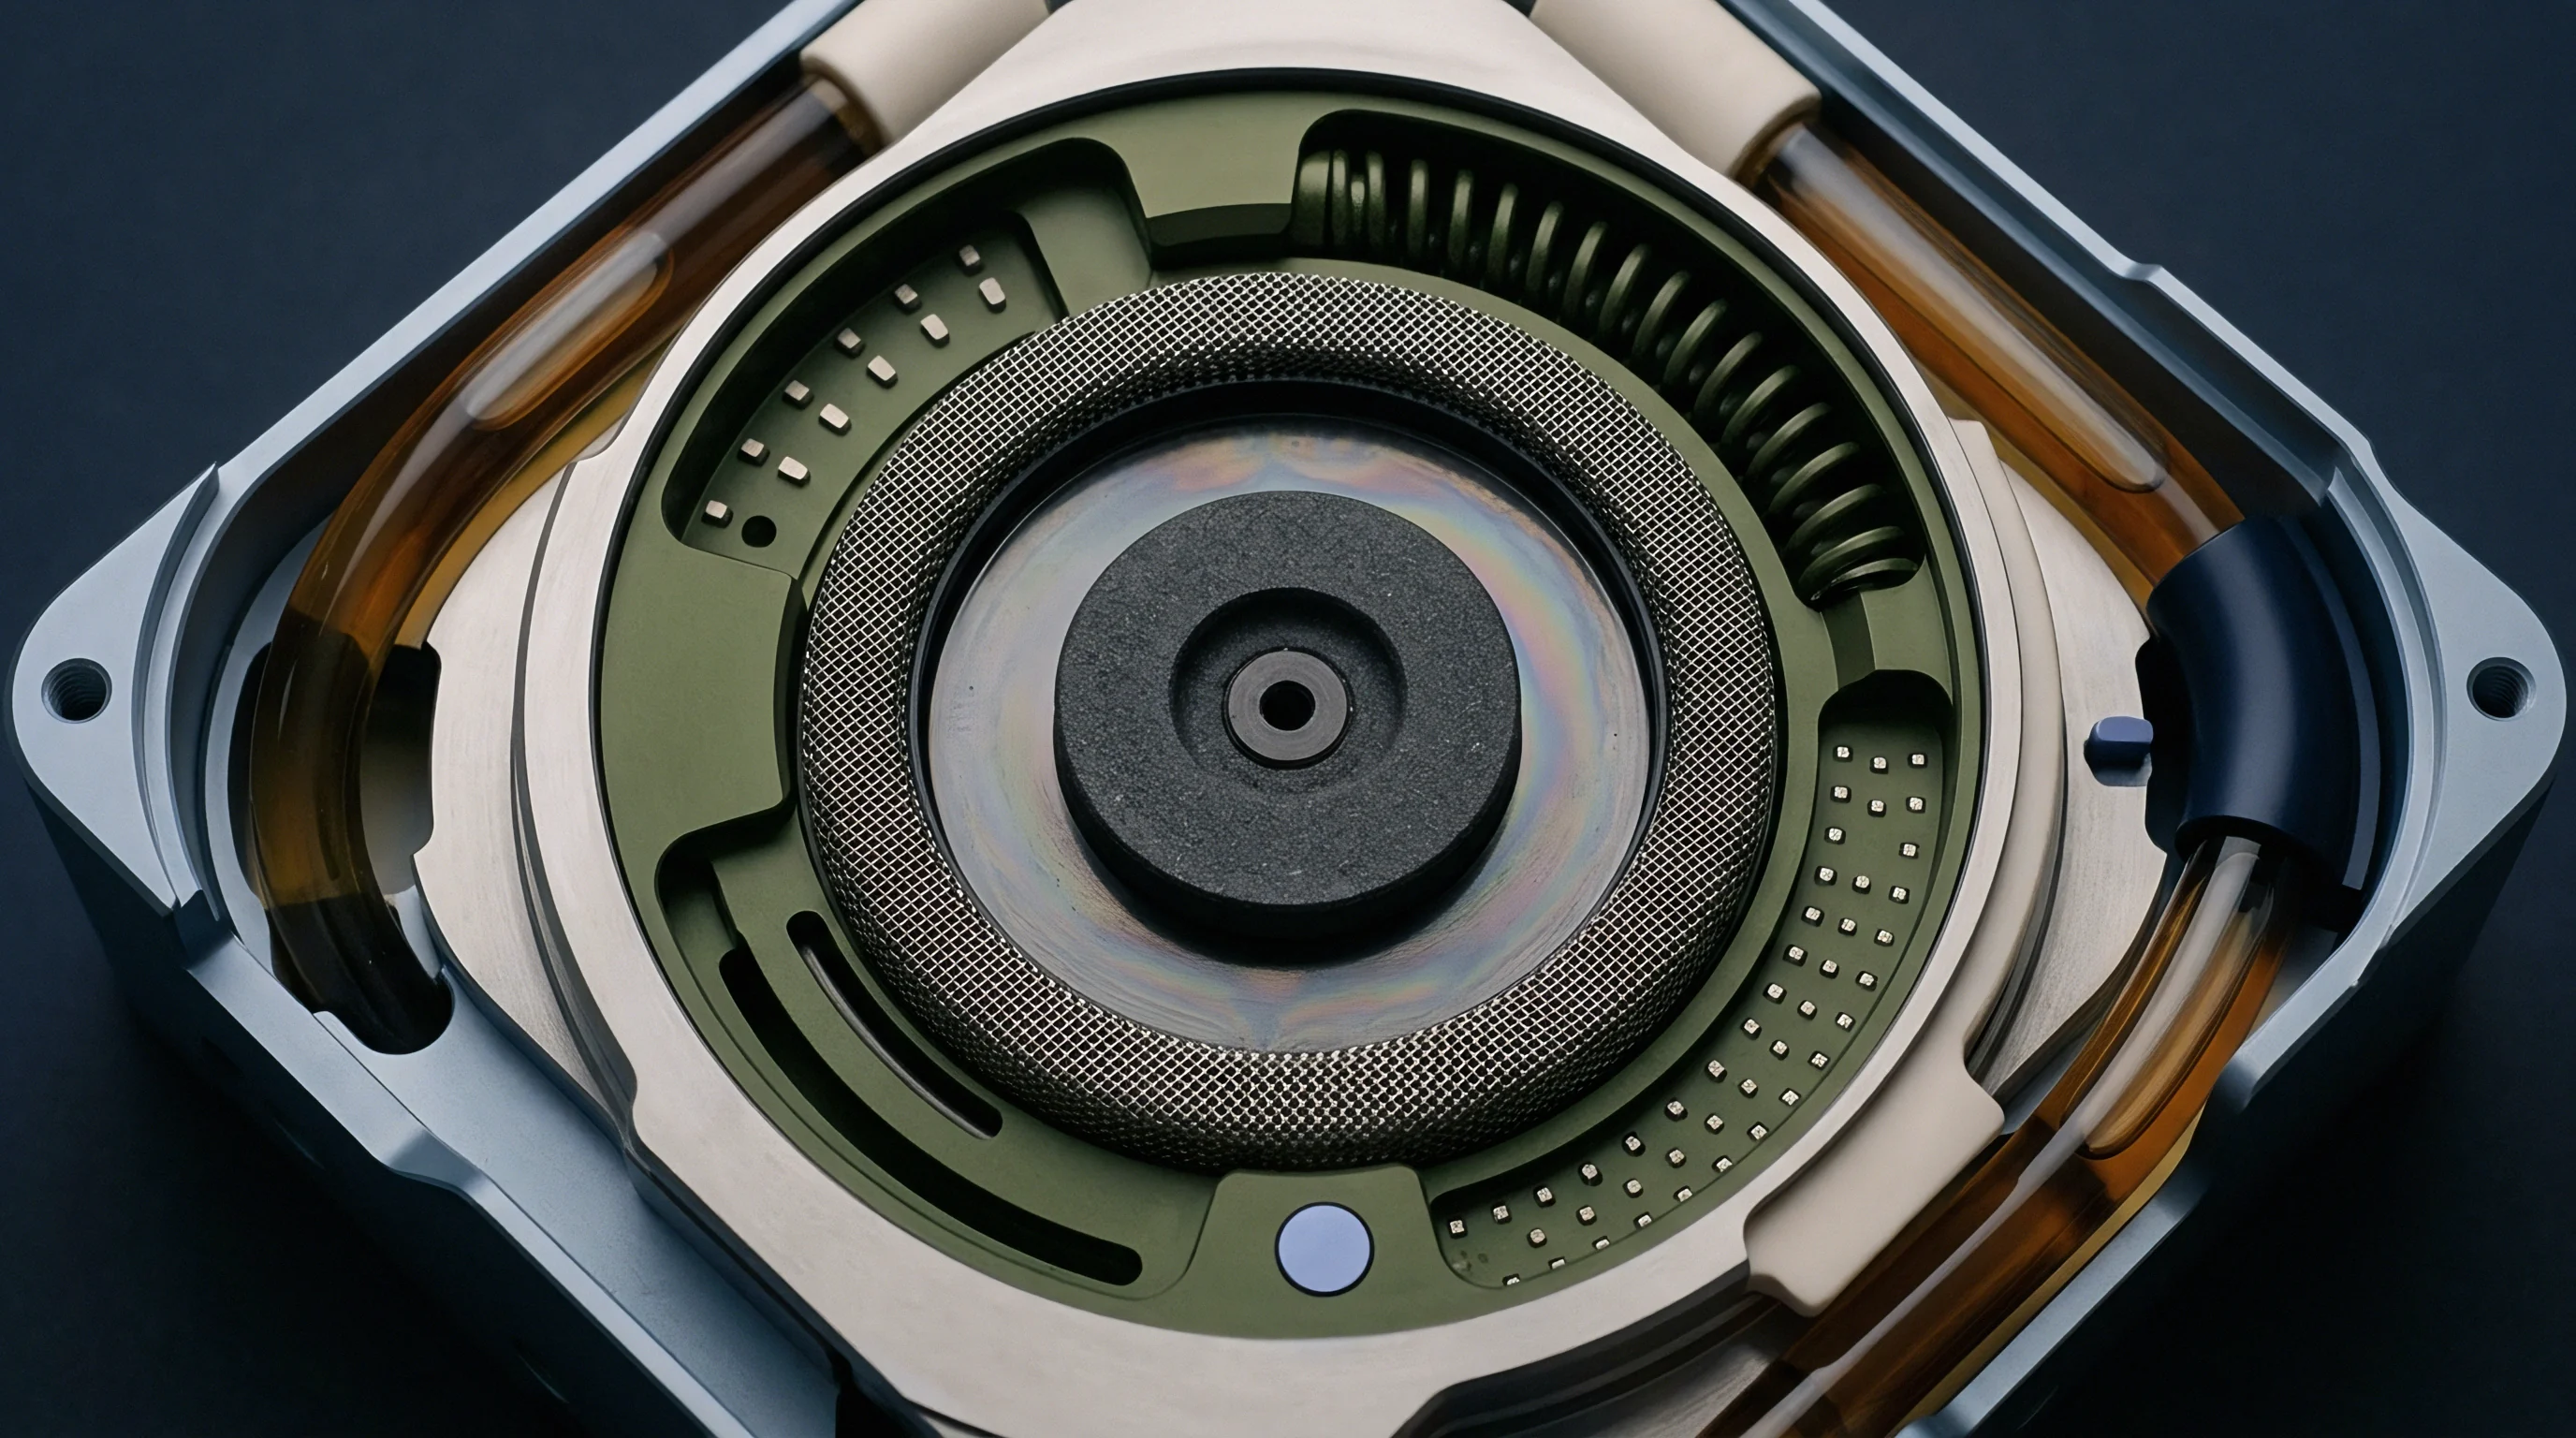
Cylindrical Header Crimps and Rupture Discs
Mechanically crimping a steel can against an elastomer gasket introduces variations in radial compression. Cylindrical formats like 21700 and 4680 cells seal their open end by rolling the upper rim of the steel can over a molded polymer gasket (typically EPDM, fluorocarbon rubber, or perfluoroalkoxy alkanes). Maintaining a hermetic seal requires sustained elastic pressure from the gasket.
Over time, polymer stress relaxation degrades this contact pressure. Micro-grooves on the inner steel surface, metal burrs left from can cutting, or uneven crimp pressure allow gas to creep along the gasket-metal interface.
Mass spectrometry testing isolates gasket leaks from safety vent diaphragm defects. Thermal shock testing (cycling between -40 and +85 degrees Celsius) accelerates differential thermal expansion between the steel outer wall and internal gasket, widening latent micro-gaps. Cells with poor crimp force profiles frequently show helium leak rate increases of two to four orders of magnitude after thermal shock exposure.
| Envelope Format | Dominant Defect Mechanism | Typical Defect Width | Helium Leak Range (mbar·l/s) | Equivalent Moisture Ingress (mg/yr) |
|---|---|---|---|---|
| Pouch (Laminate) | Electrolyte salt inclusion in heat seal | 0.05 to 1.2 µm | 1.0 × 10⁻⁷ to 5.0 × 10⁻⁵ | 0.02 to 8.50 |
| Pouch (Tab Lead) | Tab tape mismatch void | 0.10 to 2.5 µm | 5.0 × 10⁻⁷ to 1.0 × 10⁻⁴ | 0.10 to 18.00 |
| Prismatic (Laser Weld) | Keyhole porosity / micro-cracking | 0.01 to 0.8 µm | 1.0 × 10⁻⁸ to 2.0 × 10⁻⁶ | 0.003 to 0.45 |
| Prismatic (Burst Disc) | Coining pinholes / foil thinning | 0.02 to 0.4 µm | 5.0 × 10⁻⁹ to 8.0 × 10⁻⁷ | 0.001 to 0.12 |
| Cylindrical (Crimp) | Gasket stress relaxation / burrs | 0.20 to 5.0 µm | 1.0 × 10⁻⁶ to 1.0 × 10⁻³ | 0.25 to 120.00 |
A seal defect that permits helium flow under vacuum also allows solvent vapor exit during transit heating.
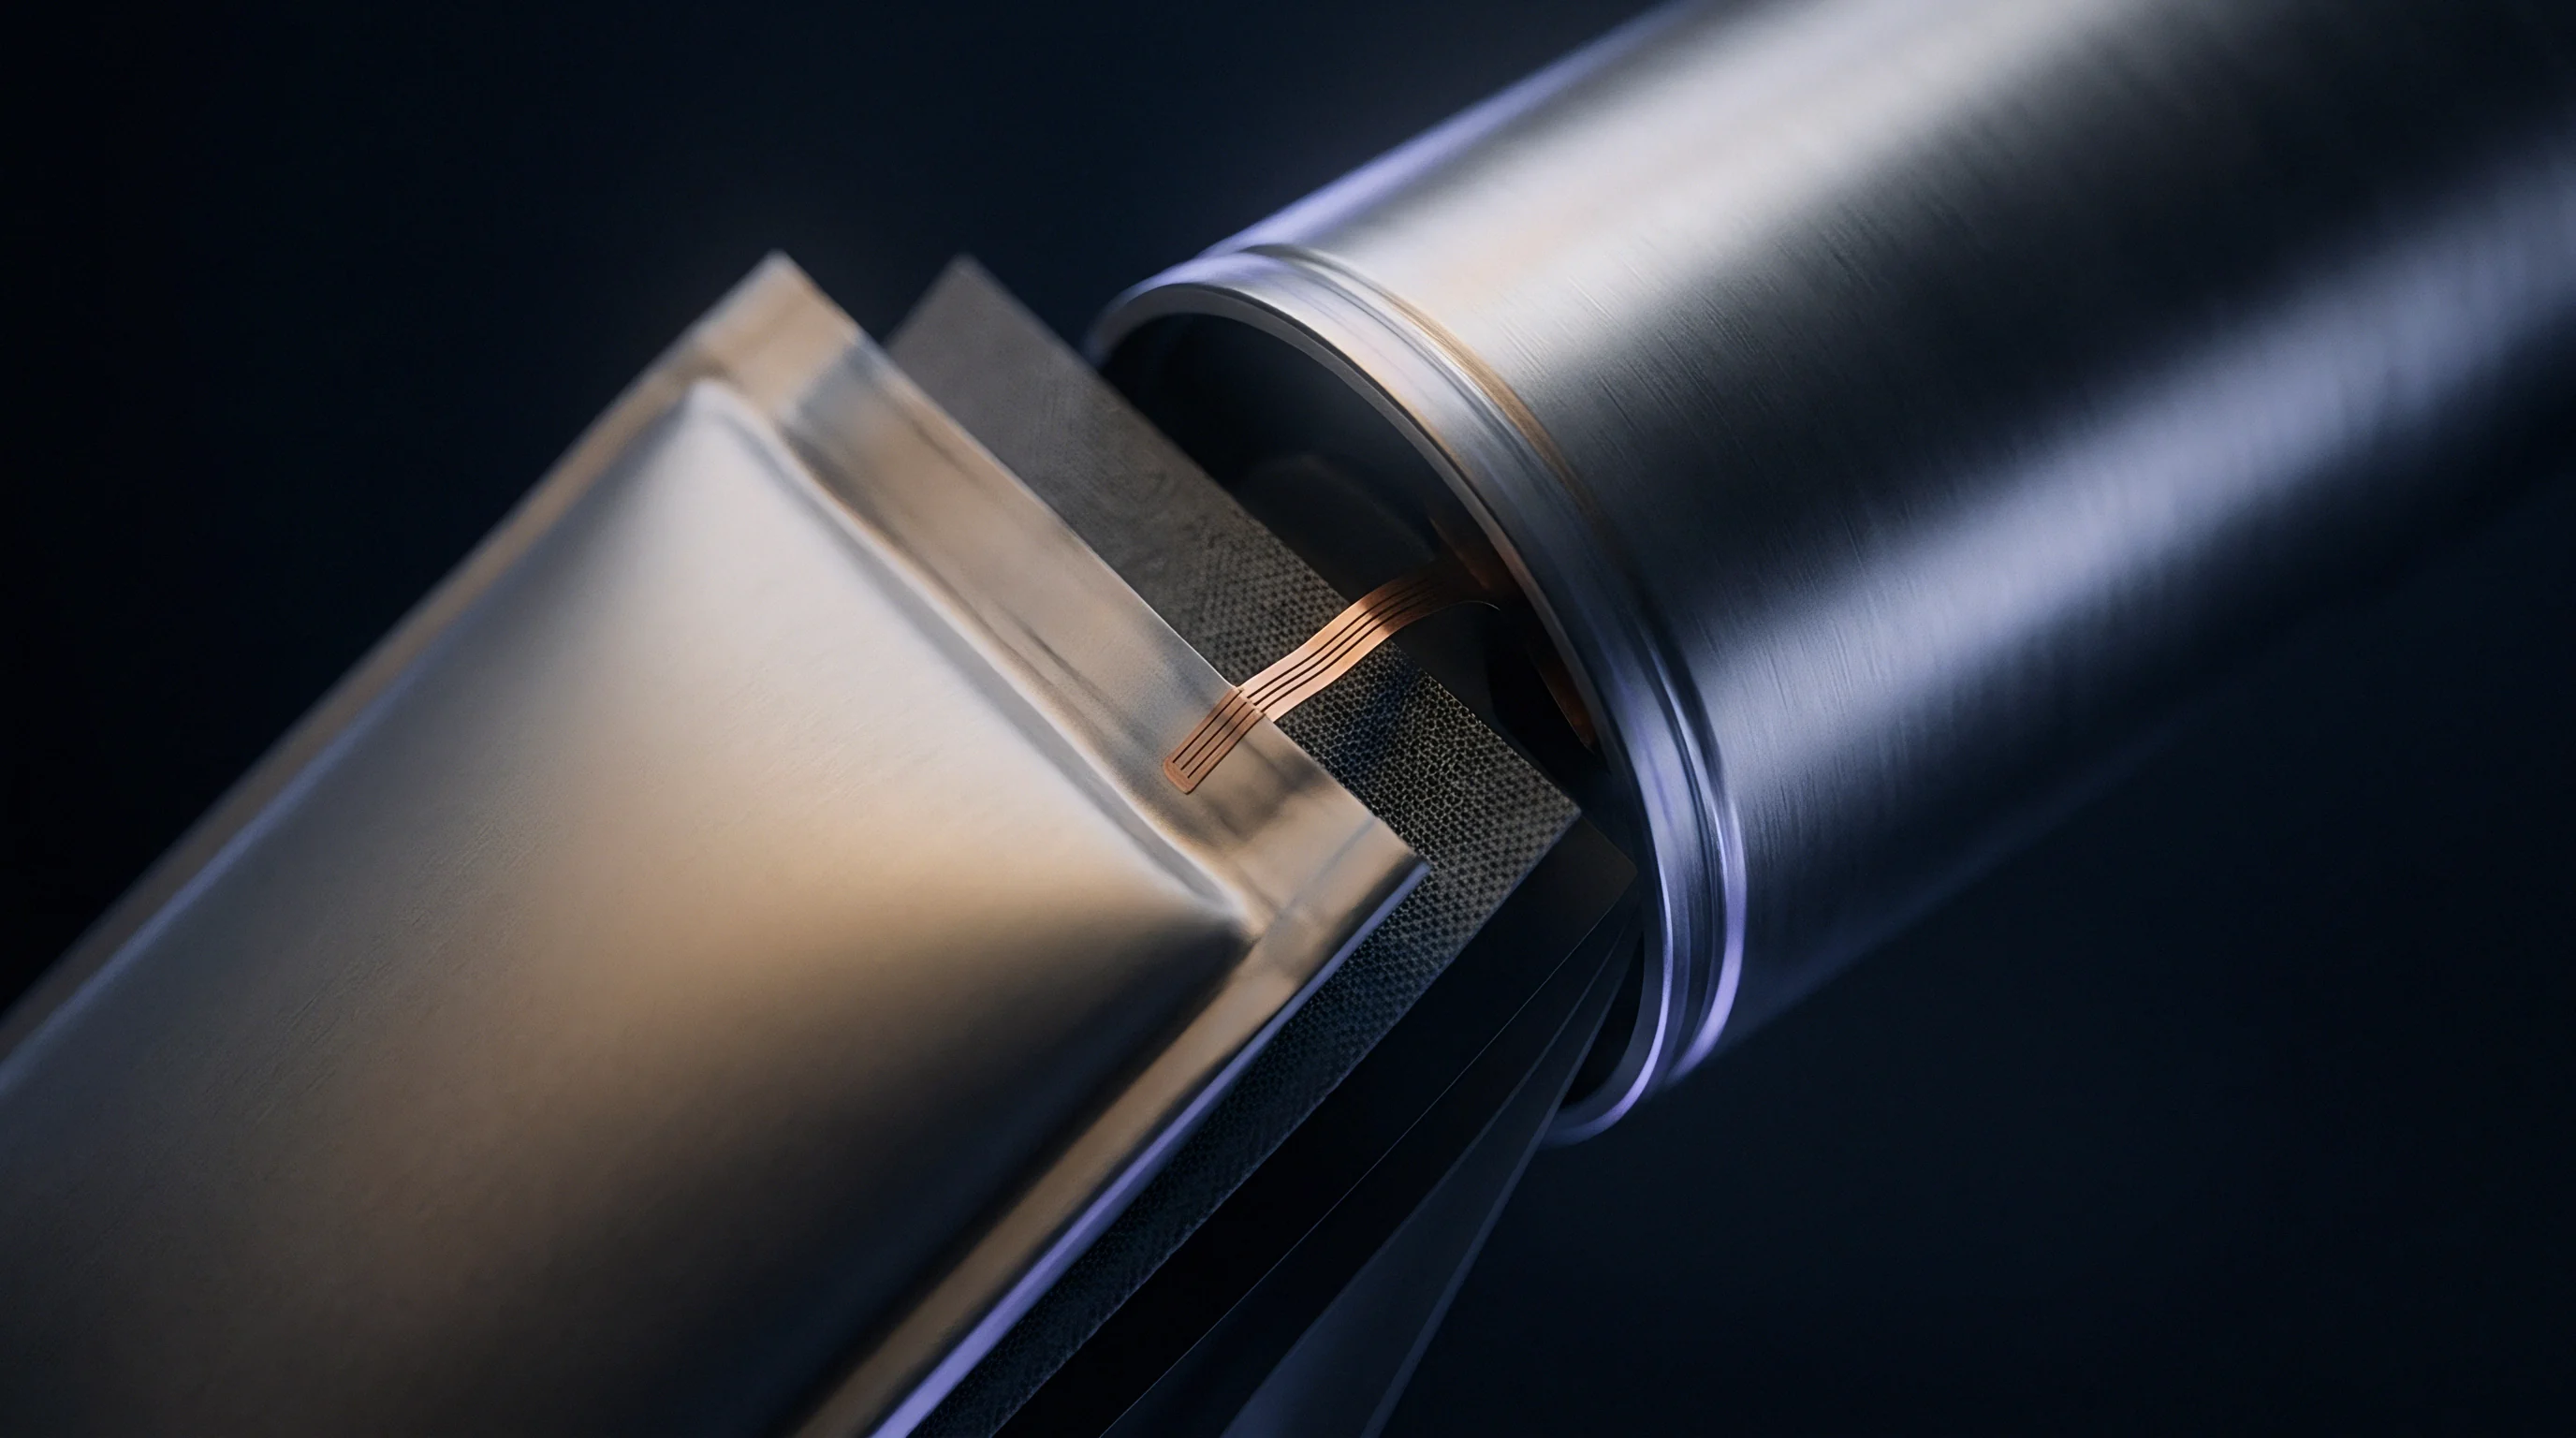
Chamber
Vacuum mass spectrometry isolates the test item inside an evacuated vessel connected to an analytical sensor. Designing an industrial leak detection chamber for battery production means balancing high-vacuum physics against manufacturing line speed. Systems run in two main operational modes: hard vacuum testing (inside-out or outside-in vacuum bombing) and atmospheric accumulation testing.
The choice determines sensor selection, overall cycle time, background washout speed, and achievable detection limits.
Hard vacuum testing offers the highest sensitivity and quickest response times. In outside-in vacuum mode (vacuum bombing), the cell is pre-charged with tracer gas in a pressure vessel, or filled with a tracer mix (such as 10% helium, 90% nitrogen) during vacuum electrolyte filling prior to final seal. The operator places the cell in the chamber, closes the door, and pulls the pressure down to 1.0 x 10⁻¹ to 1.0 x 10⁻³ millibar using high-capacity roughing pumps.
At the crossover pressure setpoint, valves isolate the roughing pump and connect the chamber to a turbomolecular pump backed by a quadrupole or magnetic sector mass spectrometer. Helium escaping through internal micro-leaks expands into the vacuum chamber and streams to the ion source, giving an immediate signal response.
Accumulation testing offers a lower-cost route when hard vacuum risks expanding or deforming soft pouch cells. Here, the test chamber stays near atmospheric pressure or under mild partial vacuum. The sealed cell, loaded with helium tracer gas, sits inside a tight enclosure where carrier gas or an internal fan circulates air around it.
Over a set accumulation window (usually 5 to 30 seconds), escaping tracer gas builds up in the chamber volume. A sampling pump pulls air across a quartz capillary inlet into the mass spectrometer. Accumulation reaches measurement limits down to 1.0 x 10⁻⁶ mbar l/s ~ fine for catching gross manufacturing defects, but insufficient for verifying 10-year hermetic life requirements.

Vacuum Bombing versus Accumulation Methodologies
Pressurizing a cell with tracer gas prior to vacuum testing opens up latent channels. In helium bombing, sealed cells go into a pressure vessel with pure helium gas at 2 to 6 bar for several hours, forcing helium inward through any micro-leaks. After soaking, cells get a brief atmospheric air flush to clear surface-adsorbed helium before moving into the vacuum test chamber.
The mass spectrometer then reads the outgassing helium driven by the accumulated internal partial pressure.
Bombing calculations require modeling internal free volume, bombing pressure, soak duration, and post-bombing transfer delay. The internal partial pressure of helium P_i inside a cell after bombing time t_b follows an exponential saturation curve:
P_i = P_b (1 – exp(- (L_He t_b) / (V P_0)))
In this expression, P_b is external bombing pressure, L_He is the true helium leak rate of the defect, V is the internal free volume of the cell, and P_0 is atmospheric pressure. Once the cell comes out of the bomb, helium begins leaking back out into ambient air during transfer delay t_d. The measured leak rate L_m inside the vacuum test chamber degrades over time according to:
L_m = P_i L_He exp(- (L_He t_d) / (V P_0))
If the delay t_d stretches too long, or if the cell’s internal free volume V is very small (like in thin pouch cells), internal helium escapes before vacuum measurement starts, generating a false pass. Bombing is also unsuitable for cells with large defects (gross leaks over 1.0 x 10⁻³ mbar l/s), because trapped gas vents completely during chamber pump-down before the analyzer valve opens. Adding an auxiliary pressure-decay step to the roughing cycle catches these gross leaks before they flood the mass spectrometer with helium.

Standard Calibration Leak Calibration Practices
Permeation and capillary leak standards provide reference flow rates to verify system sensitivity. Quantitative leak testing relies on calibrating the mass spectrometer at set intervals using physical leak sources traceable to standard metrology institutes (like NIST or PTB). Calibration leaks generally come in two designs: glass/quartz permeation leaks and metal capillary leaks.
Permeation standards use a reservoir of pure helium under pressure, sealed by a thin quartz or Pyrex membrane. Helium atoms diffuse through the solid glass lattice at a highly stable rate. Because helium diffusion through quartz shifts roughly 3 percent per degree Celsius, high-precision leaks include an internal electrical heater and temperature controller to keep the reservoir steady (typically at 30 degrees Celsius).
Permeation leaks deliver stable flow rates from 1.0 x 10⁻⁷ down to 1.0 x 10⁻¹⁰ mbar l/s, making them ideal for tuning ion sources. Metal capillary leaks use crimped stainless tubing or laser-drilled micro-apertures for higher flow rates (1.0 x 10⁻⁴ to 1.0 x 10⁻⁶ mbar l/s), but require a shutoff valve to avoid draining the reservoir.
Daily calibration sequence verification follows a structured procedure. The operator opens the internal reference leak valve, records the raw ion current amplifier response (measured in amperes or volts per mbar l/s), subtracts ambient signal drift, and calculates the machine calibration factor. If the measured sensitivity factor drifts by more than 15 percent from the baseline established during equipment qualification, the system locks out line operations until technicians clean the ion source or replace electron multiplier components.
- Isolate the analytical manifold by closing the primary chamber isolation valve.
- Evacuate the sensor chamber to a background pressure lower than 1.0 x 10⁻⁵ mbar using the turbomolecular pump.
- Measure baseline background helium ion signal for 60 seconds to establish signal noise floor.
- Open the calibrated reference leak valve to introduce a known tracer flow of 5.0 x 10⁻⁸ mbar l/s into the sensor inlet.
- Wait 30 seconds for signal stabilization until peak ion current reaches steady-state equilibrium.
- Calculate system gain by dividing measured ion collector current against the certified calibration leak flow rate.
- Compare calculated system gain against baseline calibration parameters stored during initial commissioning.
- Close the reference leak valve and verify signal decay down to 10 percent of peak value within 15 seconds.

Quadrupole Mass Spectrometer Sensor Operation
Ionization of incoming gases occurs via electron impact within an ultra-high vacuum manifold. The heart of the leak detector is the quadrupole mass analyzer, comprising an electron-emitting filament (typically thoriated iridium or tungsten), an ionization chamber, four parallel cylindrical metal rods, and a Faraday cup or electron multiplier detector. Electrons emitted by the heated filament accelerate toward the anode, striking neutral gas molecules entering from the vacuum chamber and knocking off electrons to form positive ions.
The four parallel rods generate a combined radio-frequency (RF) and direct-current (DC) electrostatic field. By adjusting the ratio of RF amplitude to DC voltage, the quadrupole acts as a mass-selective filter, allowing only ions with a specific mass-to-charge ratio (m/z = 4 for helium) to follow a stable oscillating trajectory down the length of the rods to hit the detector. All other ions (such as nitrogen m/z = 28, oxygen m/z = 32, or water vapor m/z = 18) undergo unstable trajectories, crashing into the rod surfaces and neutralizing.
Static and dynamic accumulation baselines show a 14 percent variance when background helium purging is omitted.
Filament contamination poses an operational risk in battery manufacturing line sensors. Residual electrolyte solvent vapors (such as ethyl methyl carbonate) entering the vacuum chamber crack under electron impact inside the ion source, depositing carbon films onto the filaments and quadrupole rods. Carbon deposits distort electrostatic fields, degrading mass resolution and causing signal drift.
Integrating a liquid nitrogen cold trap or a dual-stage differential pumping system protects the analyzer section, extending filament operational lifetime from weeks to months under continuous production conditions.
| Test Parameter | Hard Vacuum (Outside-In) | Vacuum Bombing | Accumulation Mode | Sniffer Probe Method |
|---|---|---|---|---|
| Detection Limit (mbar·l/s) | 1.0 × 10⁻¹² to 1.0 × 10⁻⁸ | 1.0 × 10⁻⁹ to 1.0 × 10⁻⁶ | 1.0 × 10⁻⁶ to 1.0 × 10⁻⁴ | 1.0 × 10⁻⁶ to 1.0 × 10⁻³ |
| System Pressure Environment | Ultra-high vacuum (< 10⁻³ mbar) | High vacuum (10⁻¹ mbar) | Atmospheric / mild partial vacuum | Ambient atmospheric pressure |
| Typical Cycle Time per Part | 3 to 8 seconds | 15 to 45 seconds | 10 to 30 seconds | Manual / 30 to 120 seconds |
| Risk of Cell Mechanical Distortion | High (requires mechanical support) | High (requires mechanical support) | Negligible | None |
| Background Helium Washout Time | Fast (< 2 seconds) | Moderate (3 to 10 seconds) | Slow (10 to 30 seconds) | Continuous atmospheric drift |
| Gross Leak Detection Capability | Requires secondary sensor | Poor (gas escapes pre-test) | Good | Moderate |
Accumulation testing measures cumulative background leakage while vacuum bombing pinpoints immediate pathway defects.
Failing to clean carbonaceous solvent deposits from quadrupole analyzer rods distorts internal electrostatic fields, resulting in un-calibrated sensor drift that passes compromised cells.

Exposure
Breaching a cell barrier triggers concurrent degradation mechanisms inside the jelly roll. Envelope micro-leaks act as two-way streets: internal organic solvent vapors diffuse outward into the surroundings, while atmospheric moisture and oxygen invade the cell. The resulting chemical degradation rate depends on ambient humidity, storage temperature, state of charge, and physical channel dimensions.
Moisture ingress poses the single highest electrochemical risk to stability. Air carries variable water vapor; 50 percent relative humidity at 25 degrees Celsius yields a water vapor partial pressure of about 15.8 millibars. Inside a freshly sealed lithium-ion cell, water vapor pressure is virtually zero (dew point under -40 degrees Celsius).
This steep pressure gradient drives water molecules through micro-leaks right against outgassing solvent vapors. Once inside, water reacts immediately with lithium hexafluorophosphate (LiPF6) salt in non-aqueous liquid electrolytes.
The main hydrolysis reaction proceeds as follows:
LiPF6 + H2O -> LiF + POF3 + 2 HF
Hydrofluoric acid (HF) produced by hydrolysis breaks down the protective Solid Electrolyte Interphase (SEI) layer on the graphite anode, triggering continuous SEI degradation and re-formation that depletes active lithium ions. HF also attacks transition metal oxide cathodes (like NMC or LCO), dissolving nickel, manganese, and cobalt cations into the electrolyte. These dissolved metals cross the separator and deposit on the anode, causing micro-shorts and self-discharge.
Meanwhile, gaseous phosphoryl fluoride (POF3) hydrolyzes further into alkyl fluorophosphates and additional HF gas, driving up internal pressure and swelling pouch cells.

Moisture Ingress and Hydrofluoric Acid Generation
Extended storage turns even minor moisture ingress into significant chemical damage. A micro-leak of 1.0 x 10⁻⁶ mbar l/s lets in roughly 0.05 to 0.10 milligrams of atmospheric moisture per month under ambient conditions. Typical automotive pouch cells contain 40 to 120 grams of liquid electrolyte with salt concentrations around 1.0 to 1.2 moles per liter.
Introducing as little as 50 ppm of water pushes HF concentrations past 100 ppm, initiating transition metal dissolution within 30 days of warehouse storage.
Quantifying HF buildup shows how damaging micro-leaks really are. The table below outlines chemical degradation parameters across leak tiers after 180 days of ambient storage (25 degrees Celsius, 60 percent relative humidity):
A leak rate of 1.0 x 10⁻⁵ mbar l/s elevates internal HF concentration to 420 ppm, degrading 100 percent-state-of-charge cells to less than 80 percent retained capacity within six months due to active lithium loss and cathode lattice degradation. The accompanying gas generation (carbon dioxide, carbon monoxide, and volatile fluoro-alkanes produced by electrolyte oxidation) causes flexible pouch envelopes to distend, increasing overall cell thickness beyond engineering mechanical tolerances for pack module assembly.

What Helium Leak Rate Triggers Electrolyte Depletion?
Volatile organic solvents evaporate through microscopic seal apertures over extended storage periods. Commercial lithium-ion electrolytes blend cyclic carbonates like ethylene carbonate (EC) with low-viscosity linear carbonates such as dimethyl carbonate (DMC), diethyl carbonate (DEC), or ethyl methyl carbonate (EMC). Linear carbonates exhibit high vapor pressures at room temperature; DMC, for instance, presents a vapor pressure of 55 millibars at 20 degrees Celsius, rising to 140 millibars at 45 degrees Celsius.
Outgassing of linear carbonate vapors through envelope micro-channels causes progressive electrolyte dry-out. The loss of low-viscosity linear solvents alters the solvent ratio, raising overall electrolyte viscosity and shifting salt concentration away from the optimal 1.2 M conductivity plateau. Internal ionic resistance (measured via electrochemical impedance spectroscopy as bulk ohmic resistance R_0) increases exponentially as dry-out progresses.
A cell experiencing a 10 percent liquid electrolyte mass loss typically exhibits a 40 to 60 percent increase in DC internal resistance (DCIR), severely limiting pulse power capability during vehicle acceleration or fast-charging cycles.
Helium mass spectrometry thresholds set to 1.0 x 10⁻⁷ mbar l/s effectively eliminate solvent dry-out risks across a 10-year target operating life. At this leak rate boundary, total cumulative solvent mass loss over a decade remains under 0.02 grams, preserving electrolyte stoic ratios and preventing premature impedance growth.

Low Pressure Transit Risk and UN 38.3
Air transport exposes packages to ambient pressures down to 11.6 kilopascals. Under UN Manual of Tests and Criteria Sub-section 38.3, Test 2 (Altitude Simulation) models non-pressurized cargo hold conditions by storing cells at 11.6 kPa (equivalent to an altitude of 15,000 meters) for a minimum of six hours at 20 degrees Celsius. This pressure drop increases the pressure differential across the cell envelope from nominal 0 bar to nearly 0.9 bar (90 kPa delta-p).
For cells carrying pre-existing micro-leaks, altitude simulation accelerates gas evolution and seal expansion. Flexible pouch cells expand significantly under external low pressure as residual internal gas volume expands according to Boyle Law (P1 V1 = P2 V2). This mechanical expansion exerts peeling stresses directly on the perimeter heat seals.
A marginal heat seal defect that remains closed under standard atmospheric pressure opens up under low external pressure, releasing electrolyte solvent spray or gas bubbles. UN 38.3 pass criteria dictate no mass loss exceeding 0.1 percent, no leakage, no venting, no disassembly, no rupture, and no fire. Measuring helium leakage under simulated vacuum conditions guarantees compliance before submitting cells for transport certification.
Primary failure modes develop in battery cell envelopes when seal hermeticity is compromised during production or transit:
- Interfacial Heat Seal Micro-Channels formed by local temperature drops across sealing jaws permit molecular moisture diffusion directly into active electrode areas.
- Laser Weld Keyhole Porosity Clusters inside top-cap cover seams create mechanical stress concentrations that fracture under vibrational transport loading.
- Tab Tape Delamination Boundaries located at the metal-polymer interface allow linear carbonate solvent vapors to outgas into module enclosures.
- Gasket Compression Relaxation Trajectories along cylindrical header crimps reduce interfacial sealing pressure, leading to electrolyte seepage under high-temperature storage.
- Micro-Pinholes in Stamped Safety Diaphragms cause localized corrosion around burst lines, lowering the actual rupture threshold below specified pressure limits.
UN 38.3 Sub-section 38.3.4.2 penalizes cell mass loss exceeding 0.1 percent following altitude simulation with immediate transport rejection.
The seal passed visual factory inspection because electrolyte salt residue fills the defect channel during room-temperature storage.


Evidence
Proving leak tightness requires verifiable test records tied directly to accredited calibration sequences. Procurement contracts and dangerous goods regulations mandate certified compliance files proving cell envelope integrity. Integrating non-destructive leak testing into standard production quality systems (like ISO 9001 and IATF 16949) demands clear inspection steps, calibrated references, and complete traceability back to batch production runs.
Regulations governing cross-border transport of dangerous goods ~ including UN 38.3, the European Agreement concerning the International Carriage of Dangerous Goods by Road (ADR), and IATA Dangerous Goods Regulations (DGR) Packing Instructions 965 and 968 ~ enforce strict containment rules. While UN 38.3 Test 2 verifies altitude performance, overall type approval requires cell design validation through documented non-destructive leak testing. Test summaries must declare the specific test method used, tracer gas concentration, calibration standard certification date, and the absolute pass/fail threshold applied during lot verification.
ISO 20485 provides the technical baseline for helium mass spectrometry, defining procedures for system calibration, background signal calculation, and accumulation chamber operation. Meanwhile, IEC 62133-2 Clause 7.2.1 specifies seal rules for secondary lithium cells, requiring envelopes to prevent electrolyte leakage under thermal abuse and pressure drops. Sourcing dossiers that lack explicit ISO 20485 tracer test evidence fail regulatory audits, leaving shipments vulnerable to holds at border customs facilities.
International Standards for Non-Destructive Leak Testing
ISO 20485 sets out tracer gas methods for testing sealed components. It outlines two primary paths: Group A (testing components evacuated internally or submerged in tracer gas under vacuum) and Group B (testing components pre-filled with tracer gas under pressure). For battery cell production, Group A method A1 (outside-in vacuum chamber method) and Group B method B6 (accumulation chamber method) form the backbone of factory acceptance standards.
ASTM E498 defines procedures for detecting leaks down to 1.0 x 10⁻⁸ mbar l/s using helium tracer gas in inside-out testing mode. The standard calls for tracking background helium levels before and after each measurement cycle. If background helium inside the test enclosure creeps up by more than 20 percent of the target reject signal during a single shift, operators must run a nitrogen purge cycle.
In practice, test summaries are inspected against original calibration certificates before acceptance files are approved.
European Regulation EU 2023/1542 (the EU Battery Regulation) introduces mandatory carbon footprint declarations, supply chain due diligence, and recycled content metrics. Article 6 of the regulation requires battery cells to meet strict safety and durability parameters. Envelope leak testing forms a load-bearing pillar of the required conformity assessment file (Module A or Module D under EU certification rules).
Manufacturers submitting cells for CE marking must attach non-destructive leak test records demonstrating helium tightness to 1.0 x 10⁻⁷ mbar l/s, proving the cell can sustain its declared cycle life without moisture-induced capacity degradation.

Acceptable Quality Limit Sampling versus Cent Percent Verification
Statistical lot sampling under ISO 2859-1 evaluates batch conformity using defined risk thresholds. Cell manufacturers choose between 100 percent inline automated leak screening and statistical lot sampling (Acceptable Quality Limit, or AQL). For high-volume automotive EV pouch and prismatic cell lines, 100 percent inline vacuum mass spectrometry testing is standard practice.
Inline systems integrate high-speed robotic loading, rapid evacuation chambers, and dual-manifold mass spectrometers capable of testing up to 30 cells per minute per channel.
For industrial or energy storage system (ESS) cell lines, suppliers often propose statistical lot sampling under ISO 2859-1 (ANSI/ASQ Z1.4) General Inspection Level II, Single Sampling Plans for Normal Inspection. An AQL of 0.01 percent is typically specified for critical envelope hermeticity defects. The sample size code letter for a lot size of 35,000 cells under Level II is ‘N’, requiring a sample size of 500 cells.
Under an AQL of 0.01, zero defective units are allowed in the sample (Accept = 0, Reject = 1). If a single cell in the 500-unit sample exhibits a helium leak rate exceeding the 1.0 x 10⁻⁷ mbar l/s threshold, the entire lot of 35,000 cells undergoes quarantine and mandatory 100 percent sorting.

Audit Protocols for Supplier Test Summaries
Reviewing vendor test documentation reveals gaps between factory calibration and delivered lot quality. Sourcing practices must audit supplier leak detection files to confirm that reported numbers reflect physical reality rather than idealized nominal parameters. A valid helium leak test summary document must contain specific, un-redacted technical metadata.
Evaluating vendor compliance involves checking incoming test documentation against a strict audit checklist. Standard safety files require technical verification across several core areas:
- System Calibration Stamp showing daily verification against a certified NIST-traceable permeation reference leak with valid temperature compensation tables.
- Background Washout Profile proving background helium partial pressure returned to baseline noise levels prior to inserting the target production batch.
- Tracer Gas Concentration Certificate confirming tracer mix percentage (minimum 10 percent helium balance nitrogen) utilized during post-filling pressure bombing.
- Chamber Evacuation Dwell Records verifying roughing pump pull-down time permitted full vacuum crossover before triggering sensor signal integration.
- Rejection Setpoint Conversion Matrix demonstrating proper Knudsen or viscous conversion factors were applied to adjust target air limits into helium tracer units.
- Serial Code Association Logs linking individual barcode matrix scans on cell tops to raw mass spectrometer peak intensity data files.
Under ISO 20485 Clause 8.3, tracer leak test documentation remains invalid unless calibration verification occurs within 12 hours of the production testing window.

Invoice
Financial commitments in battery procurement come down to balancing capital equipment expenditure against warranty exposure. Micro-leak detection using helium mass spectrometry represents a significant operational cost center during cell assembly. Investments in automated vacuum chambers, turbomolecular pumping skids, and gas recovery systems add directly to cell unit costs.
Cutting back on inline inspection, however, shifts financial risk downstream to pack integrators, vehicle OEMs, and importers of record who shoulder legal liability for field failures.
Capital expenditure (CapEx) for a multi-chamber, fully automated inline helium leak detection system handling 1.5 million prismatic cells annually runs between 450,000 USD and 850,000 USD depending on vacuum pump sizing and target cycle times. Operational expenditure (OpEx) includes power for pumping skids, regular replacement of quadrupole ion filaments, reference leak recalibration, and helium tracer gas. Industrial helium (Grade 4.5, 99.995 percent pure) represents the largest ongoing variable cost.
Global supply constraints drive price volatility, with bulk gas ranging from 15 to 45 USD per cubic meter.
Installing gas recovery systems changes line economics dramatically. Continuous high-volume testing without recycling burns through substantial helium volumes; a plant producing 10,000 cells daily can vent over 150 cubic meters of helium per day, topping 1,200,000 USD in annual gas costs. An inline closed-loop recovery system reclaims 90 to 98 percent of vented tracer gas.
The unit compresses exhausted gas from the chamber, runs it through a catalytic purification membrane to strip moisture and air, and re-compresses it into storage tanks. Recovery drops net tracer gas cost per cell from 0.35 USD to roughly 0.03 USD, paying off the 180,000 USD recovery skid CapEx within 14 months of operation.

Capital Expenditure for Inline Mass Spectrometry Systems
Automated vacuum helium testing machinery represents a significant capital investment for cell manufacturing facilities. Equipment amortisation calculations depend on line speed, machine uptime (Overall Equipment Effectiveness, or OEE), and chamber cycle efficiency. A standard dual-chamber vacuum leak testing station features two parallel vacuum vessels operating out-of-phase: while Chamber A evacuates and executes sensor reading, Chamber B unloads tested cells and loads the next batch.
A worked financial model illustrates the landed cost impact of inline helium testing for a 2.0 Gigawatt-hour (GWh) prismatic cell production plant. Assuming a cell capacity of 100 Ampere-hours (Ah) at a nominal voltage of 3.2 Volts (320 Watt-hours per cell), the facility produces 6,250,000 cells per year. Equipment depreciation over five years for two dual-chamber inline leak detection lines total 240,000 USD annually.
Electrical power consumption (60 kW average load at 0.12 USD per kWh) adds 50,400 USD annually. Maintenance parts, including filament replacements and turbomolecular pump overhauls, add 35,000 USD per year. Combined tracer gas operating costs (with 95 percent helium recovery) contribute 187,500 USD per year.
Dividing the total annual operating cost of 512,900 USD by the annual production volume of 6,250,000 units yields a direct testing cost of approximately 0.082 USD per cell, equivalent to 0.256 USD per kilowatt-hour of cell capacity. Compared to total cell manufacturing landed costs of 65 to 85 USD per kWh, 100 percent helium mass spectrometry testing adds less than 0.4 percent to direct unit cost while eliminating micro-leak liability exposure.

Helium Conservation and Recovery Economics
Recycling tracer gas reduces operating expenses during continuous high-volume cell inspection. Membrane separation technologies split helium from nitrogen and oxygen based on selective permeation rates through hollow-fiber polymer membranes. Helium molecules permeate across the membrane wall rapidly due to their small kinetic diameter, while larger nitrogen molecules remain in the retentate stream.
Single-stage membrane recovery units achieve helium purity levels of 85 to 92 percent, which is sufficient for reuse in high-concentration bombing or direct cell pre-filling applications.
For applications requiring ultra-high tracer concentration (such as fine-leak vacuum testing at 1.0 x 10⁻⁹ mbar l/s thresholds), two-stage membrane systems or Pressure Swing Adsorption (PSA) units elevate helium purity to over 99 percent. Maintaining precise helium concentration logs inside the recycling loop prevents quantitative testing errors. If the tracer gas concentration inside the recovery storage tank drops from 95 percent down to 80 percent due to air contamination, the raw leak rate signal measured by the mass spectrometer drops proportionally by 15.8 percent, causing the machine to accept cells that actually exceed the engineering leak limit unless automated gas chromatography monitoring adjusts the calibration baseline in real time.

Warranty Liability and Recall Economics
Field failures originating from un-detected containment breaches incur severe financial penalties. The commercial decision to replace 100 percent helium mass spectrometry with cheaper, less sensitive methods (such as pressure decay or solvent-vapor sniffing) exposes cell suppliers and pack assemblers to asymmetric risk. Solvent sniffing using acoustic photo-isothermal or metal-oxide gas sensors achieves detection limits no better than 1.0 x 10⁻⁴ mbar l/s, leaving micro-leaks in the 1.0 x 10⁻⁵ to 1.0 x 10⁻⁷ mbar l/s range undetected.
Calculating the net present value of automated inline leak detection against field recall exposure highlights the financial rationale. Consider a batch of 50,000 automotive battery packs, each containing 192 prismatic cells (9,600,000 cells total). Skipping 100 percent helium testing saves roughly 787,000 USD in line production costs.
If an un-detected micro-leak escape rate of 0.02 percent occurs (20 defective cells per 100,000 units), approximately 1,920 compromised cells enter field service. Over 24 to 36 months of vehicle operation, moisture ingress causes 15 to 20 percent of these compromised cells to develop severe internal HF corrosion, high DC resistance, and thermal events during fast charging.
Remediating a field battery failure requires full pack replacement, vehicle towing, battery module recycling, and legal administration, costing between 8,000 USD and 14,000 USD per vehicle. A field failure population of 300 vehicles generates warranty claims between 2,400,000 USD and 4,200,000 USD. If systemic micro-leaks trigger an official safety recall supervised by transport authorities (such as NHTSA or KBA), total recall logistics, brand damage, and regulatory fines can exceed 50,000,000 USD.
Spending 0.082 USD per cell for inline vacuum helium testing provides absolute risk mitigation, converting a potential multi-million dollar corporate exposure into a fixed, predictable quality control expense item.
| Test Method | CapEx per Line (USD) | OpEx per Cell (USD) | Detection Limit (mbar·l/s) | Escape Risk (PPM) | Warranty Exposure Index |
|---|---|---|---|---|---|
| Inline Vacuum Helium Mass Spec | 450,000 to 850,000 | 0.08 to 0.12 | 1.0 × 10⁻¹⁰ to 1.0 × 10⁻8 | < 1 | Baseline (1.0x) |
| Accumulation Helium Chamber | 180,000 to 320,000 | 0.04 to 0.07 | 1.0 × 10⁻⁶ to 1.0 × 10⁻⁵ | 15 to 45 | 12.5x |
| Solvent Vapor Sniffer Probe | 45,000 to 85,000 | 0.02 to 0.04 | 1.0 × 10⁻⁴ to 1.0 × 10⁻³ | 120 to 350 | 85.0x |
| Differential Pressure Decay | 25,000 to 50,000 | 0.005 to 0.01 | 1.0 × 10⁻³ to 1.0 × 10⁻² | 500 to 1,200 | 240.0x |
| Methods note: Calculations based on 2.0 GWh annual plant throughput (6.25M prismatic cells/year), 5-year equipment depreciation, helium recovery efficiency of 95 percent, and average warranty remediation costs of 10,000 USD per pack failure event. | |||||
Structuring purchase contracts with explicit supplier indemnification clauses locks regulatory risk back onto the cell manufacturer. The contract specifies that any cell batch exhibiting a field micro-leak rate exceeding 1 PPM within 36 months of delivery triggers mandatory supplier reimbursement of all pack disassembly, transportation, and module replacement costs. Sourcing practices audit the vendor laboratory test records, trace calibration standards to national metrology files, and archive the raw mass spectrometer data files alongside UN 38.3 test summaries in the permanent safety file.