Intercalation Potential Shifts in Large Format Lithium Cells
Local intercalation overpotentials in large format cells force anode potentials below 0V vs Li/Li+, causing lithium plating long before terminal voltage limits.

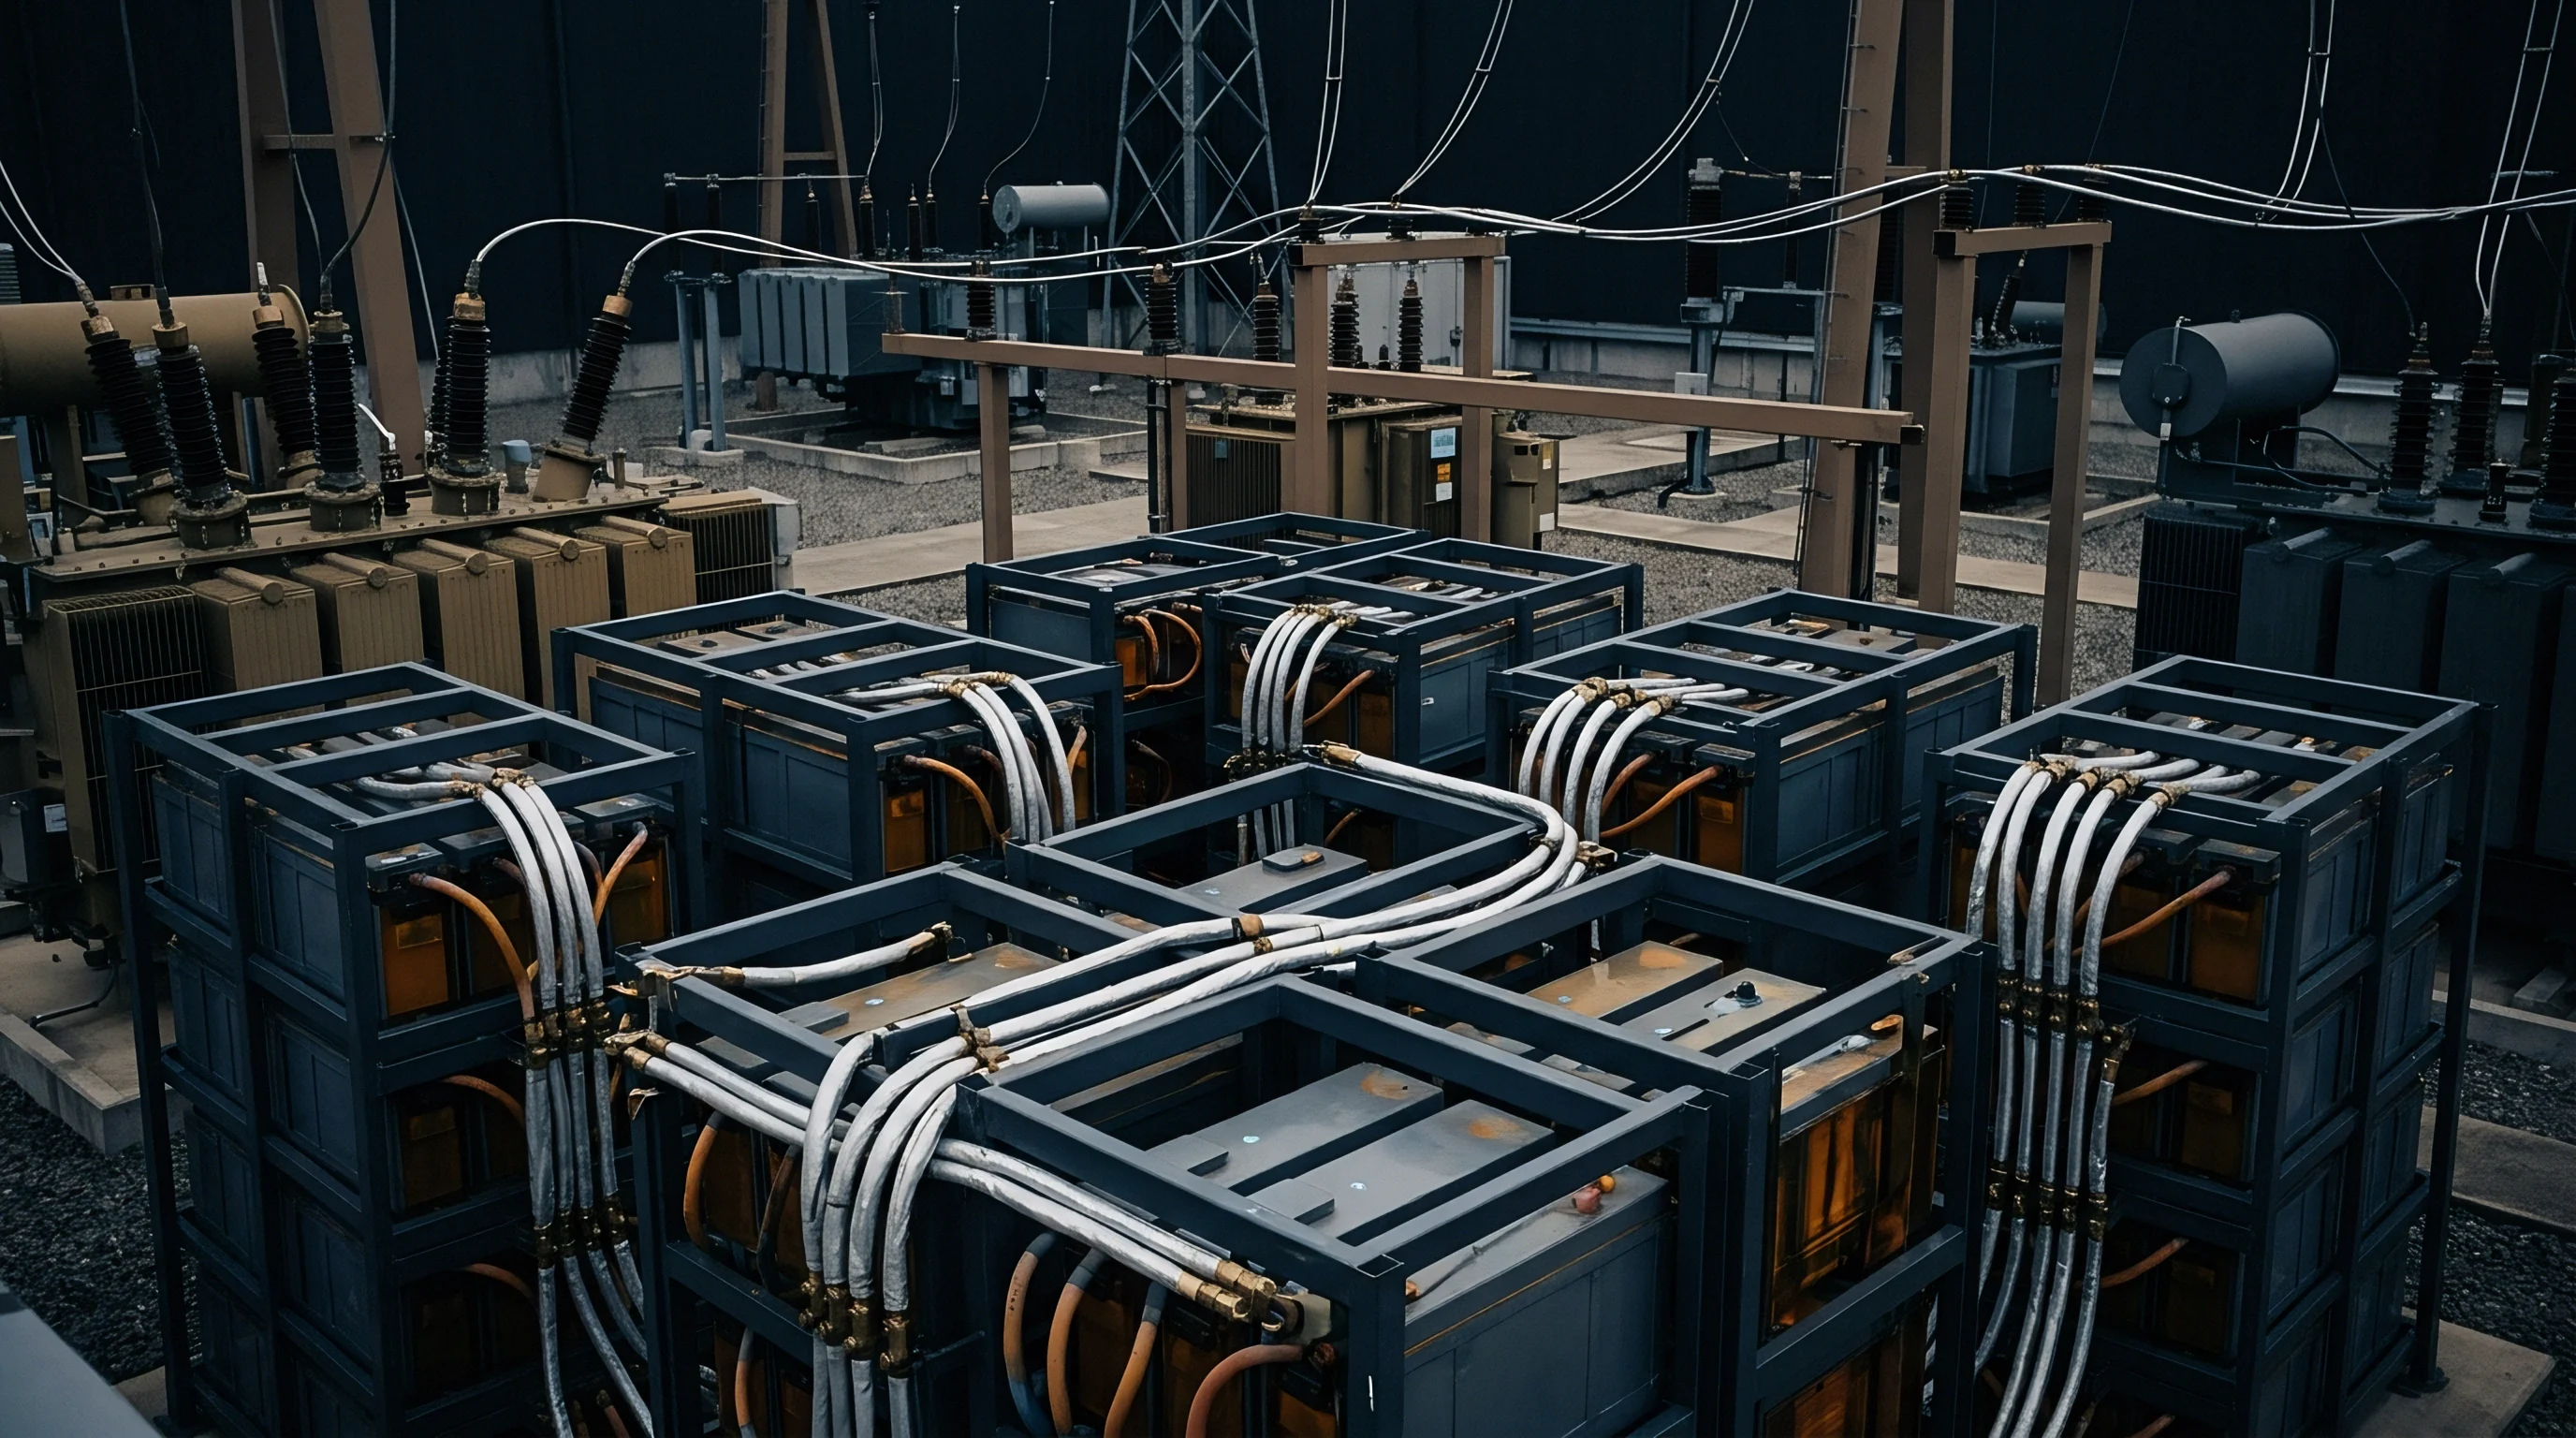
Gradient
Large-format prismatic cells rated at 280 ampere-hours carry over six milliohms of lateral electronic resistance across their current collector foils. Along electrode sheets extending past 1.5 meters unwound, current density never splits evenly across the active material. Current takes the path of lowest resistance, crowding near the collector tabs.
That local crowding drives up regional overpotential, pulling the local negative electrode potential far below the volume-averaged equilibrium potential seen at the terminals.
The 12-micrometer aluminum positive foils and 6-micrometer copper negative foils both add longitudinal electrical resistance. During a continuous 280-ampere 1C charge, current entering at the top tabs creates a linear voltage drop through the height and length of the jellyroll or stack. Areas right next to the tabs see local current densities up to 2.4 times higher than the bottom fold of the electrode stack, raising both activation and concentration overpotentials inside the graphite particles and porous separator electrolyte.
Thermodynamically, lithium ion intercalation into synthetic or natural graphite moves through discrete stages. At equilibrium, stage-four lithiation (LiC36) rests at about 210 millivolts versus Li/Li+, stage three (LiC18) near 140 millivolts, stage two (LiC12) near 85 millivolts, and fully intercalated stage one (LiC6) at 65 millivolts versus Li/Li+. That leaves a baseline margin of just 65 millivolts before metallic lithium precipitates at zero current.
Under fast charging, total overpotential (ηtotal) sums the ohmic drop (ηΩ), charge transfer resistance (ηct), and solid-state diffusion polarization (ηdiff).
Local overpotential controls the kinetic response here. Once current crowding pushes local overpotential past 65 millivolts at the graphite surface, the local anode potential drops below 0 volts versus Li/Li+. At that point, the driving force flips from intercalating lithium into the graphite lattice to plating metallic lithium directly onto particle surfaces.
In large cells, this local potential collapse happens well before terminal voltage hits its upper cutoff of 3.65 volts for lithium iron phosphate or 4.2 volts for nickel manganese cobalt.
| Cell Architecture | Nominal Capacity (Ah) | Max Local Current Density (mA/cm²) | Tab Region Overpotential (mV) | Anode Potential vs Li/Li+ (mV) | Plating Risk Zone Location |
|---|---|---|---|---|---|
| Prismatic Stacked LFP | 280 | 4.85 | 112 | -17 | Positive Tab Proximity Zone |
| Prismatic Wound LFP | 314 | 5.30 | 128 | -31 | Inner Core Tab Outer Wrap |
| Pouch Stacked NMC622 | 100 | 3.60 | 78 | +12 | Central Tab Junction Region |
| Cylindrical 4680 NMC811 | 25 | 6.10 | 145 | -48 | Top Collector Ring Interface |
Thermal gradients exacerbate this spatial divergence. Large cells conduct heat poorly across laminated layers ~ typically 0.5 to 1.5 Watts per meter-Kelvin perpendicular to the foil, against 20 to 30 Watts per meter-Kelvin along it. Ohmic heating (I2 R) near high-current tab zones raises local temperatures 8 to 14 degrees Celsius above the core during heavy rate steps.
The extra heat boosts ionic mobility and lowers charge transfer resistance, pulling even more current toward the tabs. This coupled thermal-electrochemical feedback tightens the safety margin on negative electrode potential.
Local state-of-charge gradients do not disappear when current stops. After a high-rate charge pulse, tab regions reach full lithiation (LiC6) while remote areas lag behind at LiC12 or LiC18. Internal equalization currents then trickle through the foils and porous electrodes to balance the charge.
While that happens, local anode potentials in over-lithiated zones sit near 0 volts versus Li/Li+ for tens of minutes, giving parasitic lithium nucleation and side reactions extra time to proceed at rest.
Whether internal current redistribution during rest can fully redissolve sub-critical metallic lithium seeds before SEI encapsulation takes over is still unmeasured across multi-tab prismatic geometries.

Rig
Fitting three-electrode sense wires into commercial prismatic cells requires precision milling through the metal case without disturbing internal argon balance. Two-terminal measurements only catch the total cell voltage ~ the difference between cathode and anode potentials ~ which hides single-electrode dynamics. A spike in full-cell voltage could mean positive electrode polarization, an anode potential drop, or high ohmic impedance across the separator.
Tracking local intercalation shifts takes a stable reference electrode placed directly in the internal ionic path.
Placement decides signal fidelity. Micro-reference wires of pure metallic lithium, gold-coated tungsten, or lithium titanate oxide must sit within the separator layer without creating pinch points. In a 71 mm thick 280Ah prismatic cell, a single reference probe gives misleading numbers; placing it at the perimeter misses potential drops deep in the core.
Reliable diagnostic testing uses multi-point grids with at least three micro-reference probes stationed at the top tab, geometric center, and bottom fold.
A 2C charge step on a 280Ah cell drives a 42 millivolt drop in local anode potential within 120 seconds of initiation.
Pairing high-precision coulometry with isolated potential logging resolves kinetic phase boundaries. Each reference channel needs an electrometer with input impedance above 10 gigohms so the micro-reference tip does not polarize. Current channels must supply low-noise power with ripple under 0.01 percent of full scale.
Ambient thermal drifts shift reference half-cell thermodynamics by 0.5 to 1.2 millivolts per degree Celsius, so keeping the enclosure within ±0.1 degree Celsius is necessary to stop artificial voltage drift during differential capacity runs.
At a charge rate of 1.5C and a cell temperature of 15 degrees Celsius, negative electrode potential measured 45 millimeters below the positive tab drops 18 millivolts below Li/Li+.
Data acquisition systems log local potential across C-rates, ambient temperatures, and states of charge. Running raw voltage arrays through differential capacity (dQ/dV) and incremental voltage (dV/dQ) transforms highlights subtle shifts long before physical swelling shows up. Once local anode potential dips below zero, the dQ/dV curve forms a distinct secondary peak early in the following discharge as deposited lithium strips off before normal graphite de-intercalation.
- Asymmetric Reference Impedance introduces phase-shift artifacts into high-frequency electrochemical impedance spectroscopy spectra, distorting true charge-transfer resistance extraction.
- Electrolyte Drying at Puncture Sites alters local ionic conductivity along the reference wire insertion path, shifting measured local overpotential magnitudes upward.
- Reference Alloy Formation degrades pure lithium reference wire tips through reaction with trace moisture or solvent impurities, drifting the baseline reference voltage by several millivolts per week.
- Capacitive Shielding Effects caused by metallic reference sheaths disrupt local electric field lines within thin separator spaces, altering regional current density distribution.
- Ground Loop Coupling between high-current power channels and sensitive millivolt reference channels creates high-frequency voltage noise that obscures true zero-crossing events.
Three-electrode impedance analysis splits solid-electrolyte interphase resistance (Rsei) from charge-transfer resistance (Rct) at each interface independently. In large prismatic cells, the anode charge-transfer arc expands rapidly below 15 degrees Celsius. When Rct grows to dominate overall cell impedance, the voltage drop across the electrode interface under charge pulls the negative electrode potential below 0 V relative to Li/Li+.
Mapping this impedance across spatial zones shows which parts of the electrode drive cell degradation.
Reference readings taken right near positive terminal welds usually reflect contact impedance spikes rather than thermodynamic phase changes.
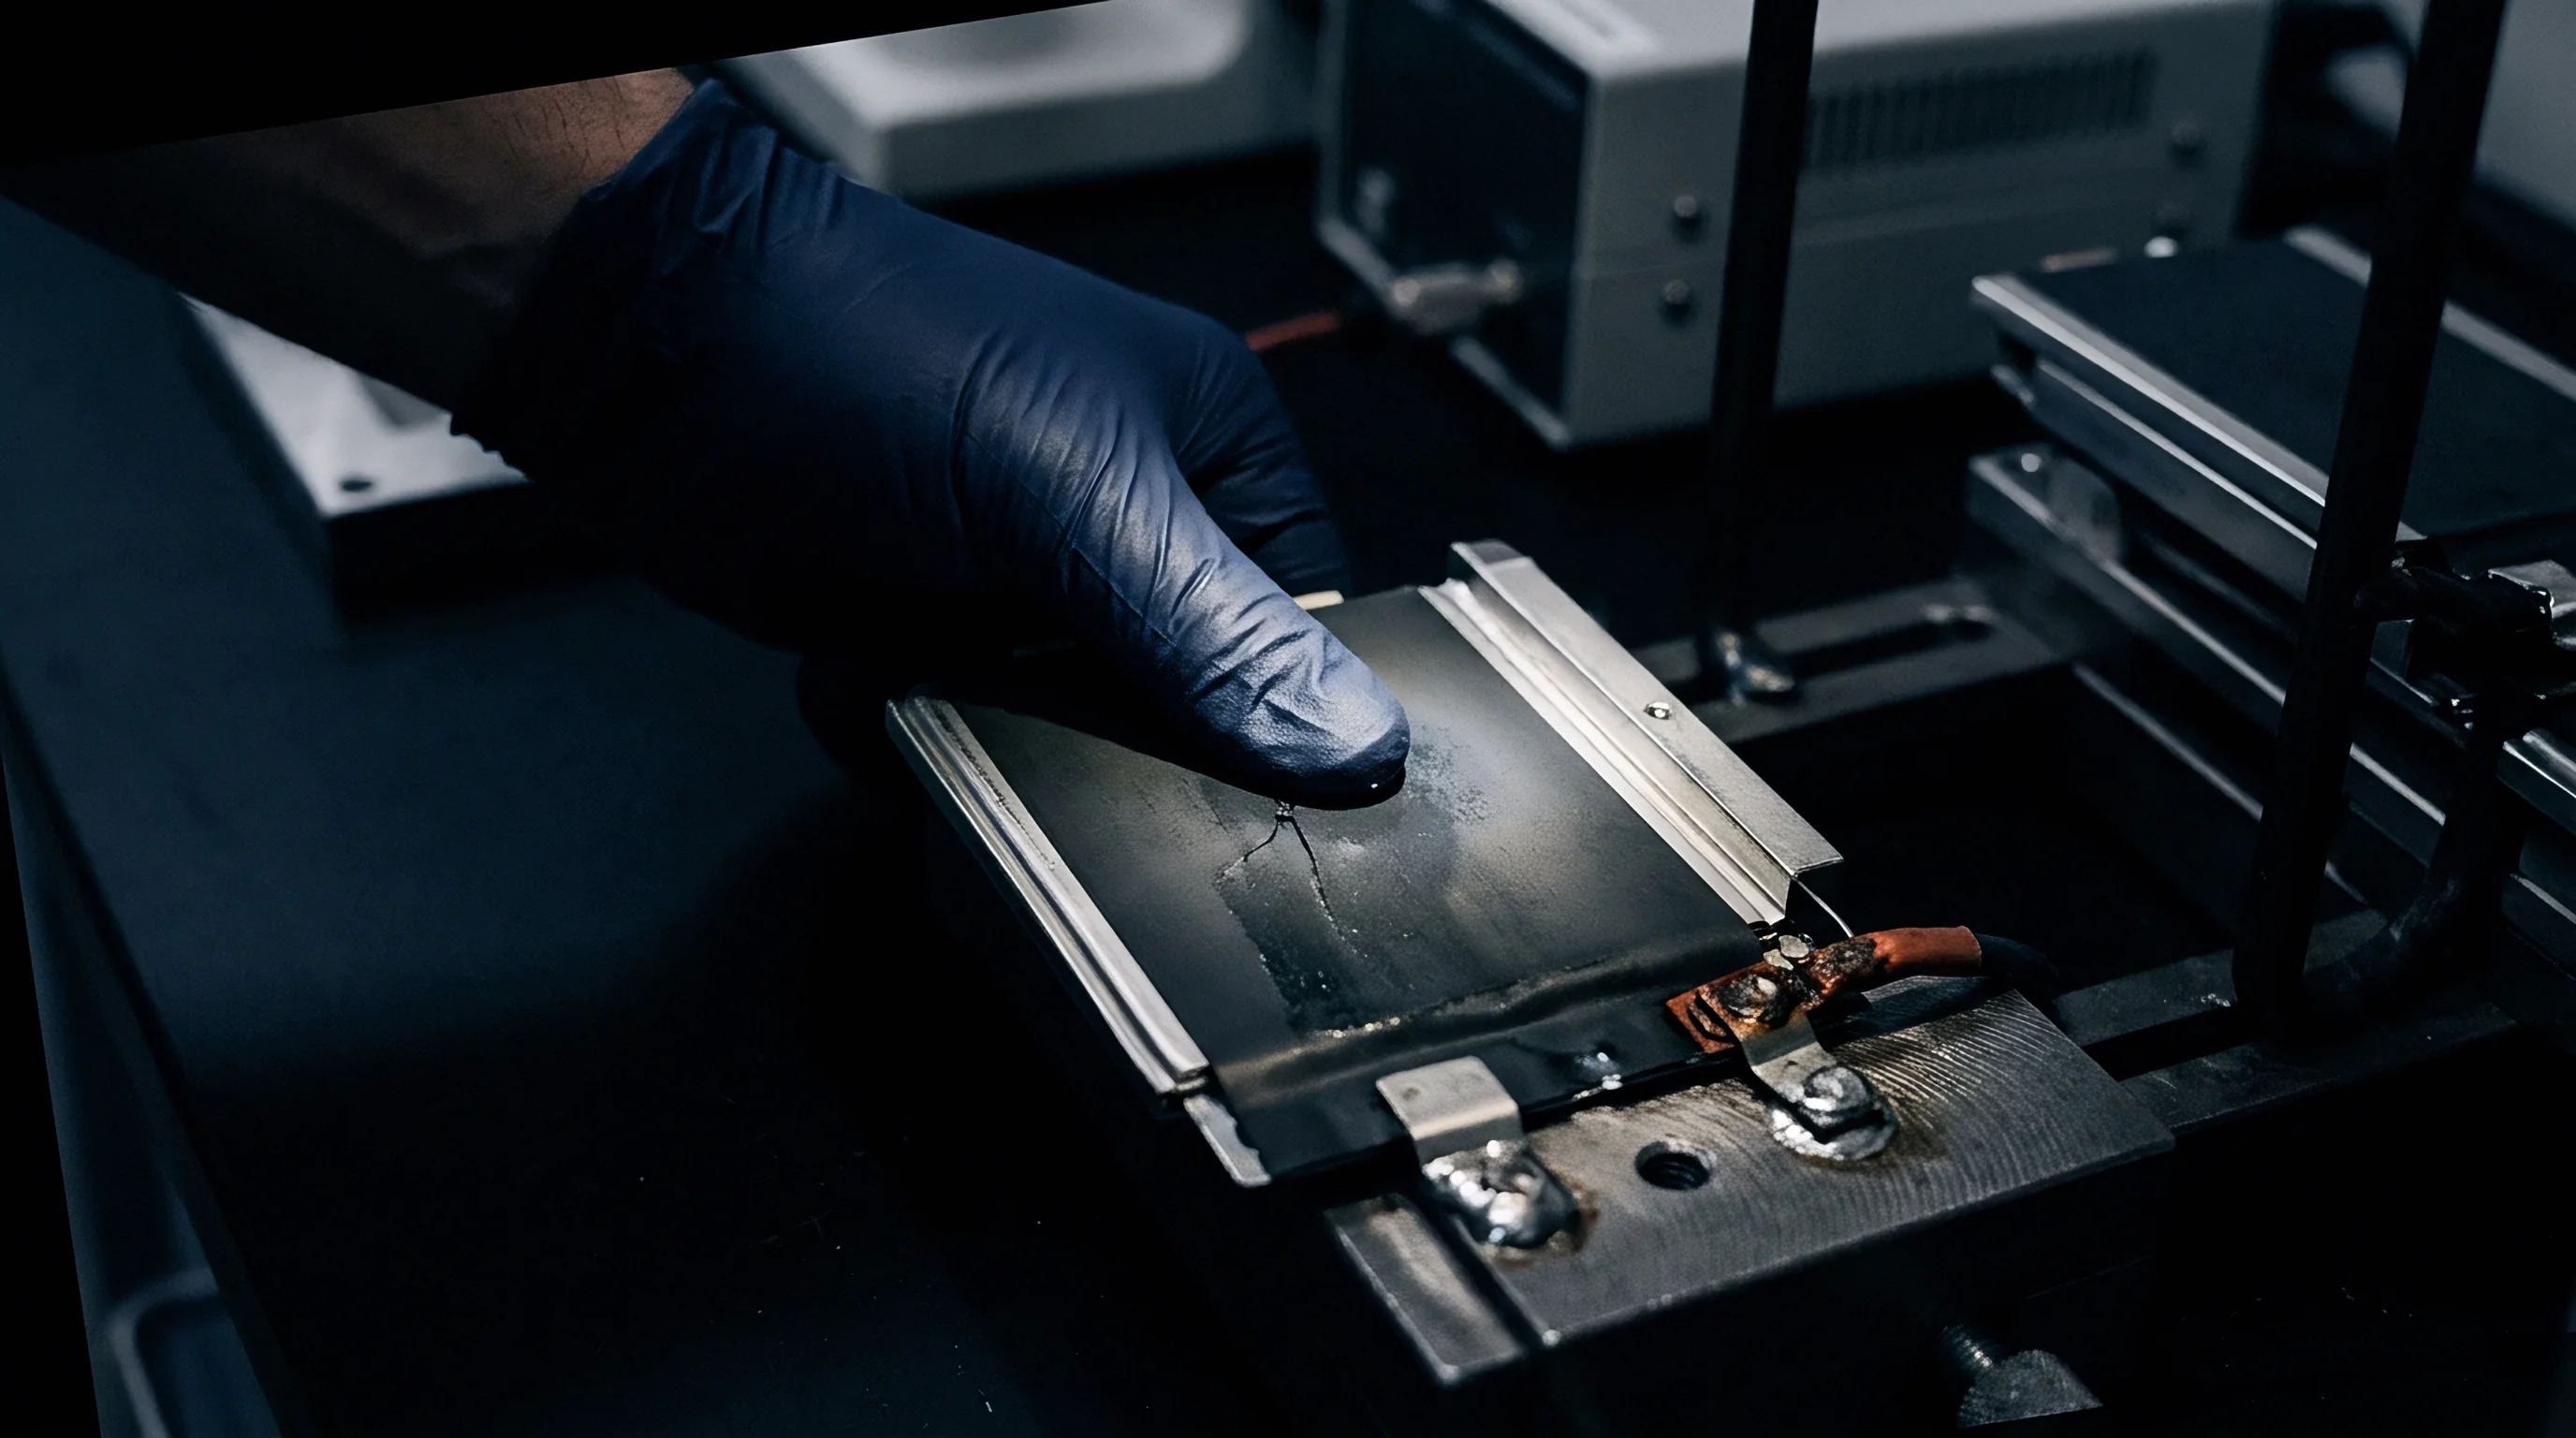
Onset
Lithium deposition begins when negative electrode potential drops below the thermodynamic reversible potential of metallic lithium. While graphite intercalation is favorable at equilibrium, its reaction kinetics limit the rate under high charge currents or low temperatures. Solid-state diffusion of lithium through bulk graphite is slow ~ typically 10-10 cm2/s to 10-12 cm2/s at 25 degrees Celsius.
At 0 degrees Celsius, that diffusion coefficient drops by more than two orders of magnitude, stacking up lithium ions at particle surfaces faster than they can enter the graphene layers.
When surface concentration hits saturation (LiC6), extra charge drives local potential down to the lithium reduction threshold (0 V vs Li/Li+). Metallic lithium then nucleates at high-energy sites like surface defects, particle edges, or thin spots in the SEI layer. Once formed, metallic lithium growth competes directly with graphite intercalation for ionic current, with the split determined by the magnitude of negative overpotential.
Reversible lithium plating redissolves into the electrolyte or re-intercalates into nearby vacant graphite sites during rest or discharge. Irreversible plating happens when deposited lithium reacts chemically with organic carbonates and lithium salts in the electrolyte. That reaction consumes active lithium and liquid solvent, building thick, porous, non-passivating secondary SEI layers that permanently degrade coulometric efficiency and trap active material as dead lithium.
| Ambient Temp (°C) | Max Safe C-Rate (V_anode > 0mV) | Onset C-Rate (V_anode = 0mV) | Severe Plating C-Rate (V_anode < -30mV) | Anode Potential at 1.0C Charge (mV) |
|---|---|---|---|---|
| 45 | 2.10C | 2.50C | 3.10C | +48 |
| 25 | 0.85C | 1.15C | 1.60C | +14 |
| 15 | 0.45C | 0.65C | 1.00C | -18 |
| 5 | 0.18C | 0.30C | 0.50C | -52 |
| -10 | 0.05C | 0.08C | 0.15C | -115 |
Calculating the local overpotential requires accounting for both mass transport and kinetic limitations within the porous electrode architecture. The total local anode potential (Vanode) relative to Li/Li+ follows the relationship:
Vanode = Eeq(thη) – Ilocal Rohm – fracR Tα F ln left( fracjlocalj0 + sqrtleft(fracjlocalj0right)2 + 1 right) – ηdiff
Where Eeq(thη) represents the open-circuit potential of graphite at local state of charge thη, Ilocal Rohm captures local electronic and ionic ohmic losses, jlocal is the localized volumetric current density, j0 is the exchange current density, α is the charge transfer coefficient, and ηdiff represents concentration polarization in both solid and liquid phases. When high charge rates raise jlocal while cold temperatures depress j0 and diffusion, these negative terms quickly outstrip Eeq(thη), pushing Vanode below zero.
In a 314Ah cell under a 1C charge at 10 degrees Celsius, local current density near the positive tab hits 4.2 milliamperes per square centimeter due to path length differences. Meanwhile, exchange current density at 10 degrees Celsius drops to 0.8 milliamperes per square centimeter. Plugging these into the overpotential equations yields an activation overpotential of 68 millivolts, an ohmic drop of 22 millivolts, and diffusion polarization of 35 millivolts.
Subtracting those losses from the 65 millivolts equilibrium potential of stage-one graphite leaves a net local anode potential of -60 millivolts versus Li/Li+, triggering rapid metallic deposition by the tab while the bottom of the cell runs safely at +12 millivolts.
Thick electrode coatings optimized for high energy density force lithium deposition at ambient temperatures during fast charge pulses.
Building safe charging envelopes that avoid negative potential drops requires mapping state of charge, temperature, and current limits over the full pack lifespan. As cells age, growing SEI layers increase internal resistance and active material loss concentrates current across the remaining active sites. A charge profile that keeps anode potential positive on a fresh cell can trigger severe plating once that cell loses 15 percent of its initial capacity.
- Mount the target cell inside a thermally controlled chamber calibrated to hold ambient temperature within 0.1 degree Celsius of setpoint.
- Connect three-electrode sense leads to high-impedance voltage channels sampling at 10 Hertz or higher.
- Run an incremental step-charging protocol, raising current in 0.1C steps while continuously monitoring regional negative electrode potential channels.
- Record the current magnitude and state of charge where any regional negative potential channel touches 0 millivolts versus Li/Li+.
- Apply a 0.85 safety derating factor to that boundary current to establish the maximum fast-charge limit for that temperature setpoint.
Operating continuously with negative anode potentials causes metallic lithium deposits to transform from mossy structures into hard crystalline dendrites. These follow high ionic flux paths through the separator’s polymer matrix toward the cathode. Mechanical pressure in prismatic cells ~ usually kept between 0.1 and 0.5 megapascals by external compression frames ~ alters dendrite shape, forcing deposits sideways along the separator surface rather than straight through.
This lateral growth blocks ionic channels across broad areas, creating dead zones that intensify current crowding nearby.
Unmonitored plating during low-temperature charging induces dendrite-driven micro-shorts that breach separators and short testing hardware.


Diagnostic
Non-destructive tracking of internal potential shifts relies on catching subtle movements in open-circuit voltage plateaus during low-rate discharge. Standard factory end-of-line checks measure basic parameters like total capacity and 1 kilohertz AC resistance, which miss localized potential shifts and early lithium accumulation. Detailed diagnostics run differential voltage (dV/dQ) and incremental capacity (dQ/dV) analysis on full-cell constant-current data taken at low rates, usually between C/20 and C/50.

Why Do Upper Stage Differential Capacity Peaks Drift Leftward under Fast Charging?
Upper-stage differential capacity peaks correspond to phase transitions in the graphite anode, specifically stage two (LiC12) to stage one (LiC6). When fast charging pulls local anode potential below zero, part of the charge current deposits metallic lithium rather than intercalating stage-one graphite. On the next low-rate discharge, that metallic lithium strips off around 0 to 50 millivolts versus Li/Li+ before stage-one graphite de-intercalation starts.
This extra oxidation path alters the voltage profile, shifting the stage-one de-intercalation peak toward lower state-of-charge coordinates and broadening its width.
On incremental capacity (dQ/dV) curves, metallic lithium stripping appears as a sharp peak just above the baseline discharge voltage. The area under this peak directly measures the quantity of reversibly plated lithium on the anode surface. Comparing the stripping peak area to the main graphite de-intercalation peak gives a precise measure of reversibility without tearing open the cell.
Differential capacity peak degradation shifts systematically toward lower voltages as localized lithium plating alters active material inventory ratios.
Electrochemical impedance spectroscopy (EIS) provides complementary frequency-domain data across broad state-of-charge windows. When local potential drops cause lithium deposition and secondary SEI growth, the high- and mid-frequency Nyquist arcs shift in distinct ways. The real-axis intercept, which marks ohmic resistance (RΩ), increases as electrolyte solvent gets consumed.
The mid-frequency semicircle ~ reflecting charge-transfer resistance (Rct) coupled with double-layer capacitance (Cdl) ~ widens as passive films thicken over lithium nucleation sites.
- Low-Frequency Warburg Tail Distortion indicates constrained solid-state diffusion paths caused by metallic lithium coverage over graphite particle pores.
- Mid-Frequency Arc Splitting surfaces non-uniform solid-electrolyte interphase impedance distributions resulting from localized high-overpotential fast-charge zones.
- Stripping Voltage Plateau Asymmetry identifies irreversible metallic lithium isolation occurring when isolated lithium islands lose electrical contact with the graphite matrix.
- Rest Voltage Relaxation Time Constant Elongation measures post-charge equalization currents driven by spatial state-of-charge gradients within large-format jellyrolls.
- High-Frequency Inductive Loop Enlargement signals internal current path reconfiguration triggered by localized active material passivating layer breakdown.
Pulse discharge relaxation tracks cell health by watching voltage recovery right after high-rate charge steps. When charge current cuts off, a cell holding plated lithium shows a prolonged multi-stage relaxation curve. An initial fast decay covers ohmic and charge-transfer relaxation, followed by a slow plateau lasting hundreds of seconds that reflects a mixed potential between chemical re-intercalation and ongoing electrolyte corrosion.
Tracking these relaxation time constants over cycle life flags localized overpotential degradation early.
Voltage plateau shifts reflect localized metallic lithium accumulation rather than benign electrode wetting variation.

Dossier
International transport compliance for large lithium-ion cells relies on documented proof of structural stability under thermal and electrical stress. Regulations govern battery shipments across sea, air, and land to limit thermal runaway risks. The UN Manual of Tests and Criteria, specifically Section 38.3, sets qualification protocols that every cell design must pass before entering commercial transport.
When localized potential shifts drive internal lithium plating, safety margins on aged or fast-charged cells narrow, exposing shippers to regulatory and physical liabilities in transit.
UN 38.3 protocols test cell integrity across eight environmental and operational stress regimes. Test T.4 (Shock) and Test T.5 (External Short Circuit) carry high failure risks for cells subjected to repeated negative overpotential conditions. External short-circuit testing under Clause 38.3.4.5 calls for an external resistance under 0.1 ohm at 55 degrees Celsius.
In cells containing metallic lithium dendrites or fragile secondary SEI layers, the resulting current surge and quick heating can cause separator collapse or melt-through, triggering catastrophic thermal runaway.
Air transport under IATA Dangerous Goods Regulations Packing Instruction 965 caps standalone lithium-ion cell charge at 30 percent of rated capacity on cargo flights. That 30 percent cap holds negative electrode potential safely inside stage-three and stage-four lithiation (LiC18 to LiC36), well above the zero-volt lithium reduction threshold. At this charge level, driving forces for dendrite growth or micro-short propagation stay low during cabin pressure changes or flight vibration.
| Standard / Regulation | Clause / Section | Target Parameter / Condition | Plating-Induced Failure Mode | Required Audit Document |
|---|---|---|---|---|
| UN Manual of Tests | Section 38.3.4.5 (T.5) | Ext. Short Circuit < 0.1Ω at 55°C | Separator breach under micro-short thermal load | UN 38.3 Test Summary Report |
| UN Manual of Tests | Section 38.3.4.7 (T.7) | Overcharge at 2x Max Charge Current | Catastrophic plating-driven rapid thermal runaway | Certified Factory Test Record |
| IEC 62133-2 | Clause 7.3.9 | Forced Internal Short Circuit (800N) | Local short circuit at dendrite accumulation zone | ILAC Accredited Lab Certificate |
| IATA DGR | PI 965 Section IA | Max 30% State of Charge Air Limit | High SOC internal relaxation potential shift | Shipper’s Declaration for DG |
Audit procedures require unbroken paper trails connecting cell lot numbers back to original type-test certification files. A UN 38.3 Test Summary must spell out specific design parameters, including mass, nominal energy, upper charge voltage, and maximum continuous charge current. If a manufacturer alters electrode coating thickness, tab positioning, or separator porosity to gain energy density, the original UN 38.3 summary becomes legally void.
Shipping revised cells under obsolete certificates invalidates dangerous goods declarations, leaving the shipper of record open to heavy fines and port impoundments.
Section 38.3.5 of the UN Manual of Tests and Criteria invalidates transport authorization when design changes alter internal electrode stack dimensions beyond two percent.
European Battery Regulation (EU 2023/1542) expands compliance beyond transport safety by mandating carbon footprint declarations and electrochemical durability metrics. Annex VII of EU 2023/1542 calls for detailed records on capacity fade, internal resistance growth, and energy efficiency retention during standard cycling. Cells that undergo severe potential drops under fast-charging profiles fail the durability thresholds needed for CE marking and EU entry, stranding stock at port.
- Omission of Maximum Overcharge Current Limits in Section 38.3.5 test summaries invalidates downstream pack-level safety documentation.
- Unaccredited Laboratory Test Issuance breaches IMDG Code Special Provision 230 requirements, prompting immediate vessel discharge refusal by maritime carriers.
- Discrepancies Between Datasheet Charge Voltage and Test Logs trigger dangerous goods inspector holds at major logistics transfer hubs.
- Incomplete Cycle-Aging Documentation Prior to Testing masks overpotential degradation, resulting in field recalls when aged cells fail thermal stability checks.
Freight forwarders audit incoming cargo against dangerous goods databases before loading vessels or air freighters. If a test summary lacks required technical signatures or misses laboratory accreditation details, shipping lines hold the container immediately. The costs of held hazardous cargo fall entirely on the importer of record listed on customs entries.
Clause 8.3.2 of IEC 62133-2 alters shipment classification by rejecting test certificates whenever thermal runaway occurs during forced internal short-circuit testing.

Settlement
Commercial cell procurement contracts assign financial liability when capacity degradation exceeds agreed warranty boundaries. Purchasing large-format lithium-ion cells at multi-megawatt-hour scale means paying for usable delivered energy over a set operating life. Datasheets present optimistic cycle life figures measured under clean lab conditions: 25 degrees Celsius, low charge rates (C/3 or C/2), and narrow state-of-charge windows.
Those numbers mask the accelerated degradation that happens when real-world duty cycles push anode potentials into overpotential territory.
If an integration agreement lacks clear operational boundaries for local potential limits during fast charging, the buyer carries the cost of early pack failures. Modern procurement contracts include technical schedules specifying allowed anode potential margins, differential capacity peak drift limits, and internal resistance growth curves. Writing these electrochemical parameters into purchase agreements converts subjective claims into clear, testable engineering metrics.
Procurement contracts bind cell vendors to strict upper voltage limits during low-temperature fast charging.
Incoming lot inspection protocols use ISO 2859-1 Acceptance Quality Limit (AQL) frameworks to verify batch conformity before releasing cells into module assembly. Sourcing specifications typically apply an AQL of 0.40 Level II Normal Inspection for internal resistance and capacity spread across incoming pallets. Running sample units on high-precision diagnostic channels confirms whether the production lot matches the reference stability profile set during initial qualification.
Landed cost calculations need to account for warranty reserve allocations tied to potential-shift degradation. A 280Ah cell bought at 52 US dollars per unit works out to an initial capital expense around 57 US dollars per kilowatt-hour. If fast charging drops the anode potential into severe lithium plating, usable cycle life plunges from 6,000 cycles down to 2,200 cycles before hitting 80 percent capacity retention.
That shift raises the true levelized cost of energy storage by over 170 percent, erasing initial volume discounts.
Recourse mechanisms need explicit framing within supply contracts. Default or non-conformance shouldn’t just mean absolute capacity loss; clauses ought to cover any shift in differential capacity (dV/dQ) peak positions past 15 millivolts over 1,000 standard cycles. When sample testing reveals unusual impedance growth or early stripping peaks, the contract should allow the buyer to reject the full shipment lot at the vendor’s expense, covering return ocean freight and hazardous waste disposal fees.
Importers of record carry final legal liability for field failures caused by unverified charging envelopes when contract terms leave out explicit operating potential limits.