Grounding Low Temperature Battery Performance Claims through Rigorous Electrochemical Laboratory Testing
Low temperature battery testing requires rigorous cold soak protocols, four-wire Kelvin sensing, and impedance analysis to ground supplier performance claims.

Kinetics
Subzero temperatures shift the electrochemical equilibrium of lithium-ion cells largely by slowing ion transport through the bulk electrolyte. At room temperature, standard carbonate solvents stay low in viscosity with high dielectric constants, allowing lithium ions to move quickly between electrodes. Drop the temperature toward minus twenty degrees Celsius or lower, and fluid viscosity climbs sharply while ionic conductivity falls by over an order of magnitude.
This bottleneck in bulk mass transport drives up concentration polarization, cutting terminal voltage long before active materials approach theoretical exhaustion.
Cold hinders lithium diffusion, though the electrolyte formulation determines just how severe the transport barrier gets. Standard blends of ethylene carbonate with dimethyl carbonate or diethyl carbonate lose ionic conductivity rapidly at subzero setpoints. Ethylene carbonate itself melts at thirty-six degrees Celsius and depends entirely on linear co-solvents to stay liquid when cold.
Below minus ten degrees Celsius, restructuring of the solvation shell around lithium ions raises the desolvation activation energy at the electrode-electrolyte interface. The ion has to strip off these surrounding solvent molecules before it can intercalate into the host lattice ~ a step that becomes the primary bottleneck in low-temperature performance.
Ionic Transport and Solvation Dynamics
Lithium ions pass through liquid electrolytes by shedding their solvation shells prior to entering the solid phase. Under ambient conditions, this energetic cost is trivial compared to charge transfer resistance. Put the cell under subzero thermal stress, however, and desolvation resistance climbs exponentially following Arrhenius behavior.
As thermal energy drops, stripping polar carbonate molecules from the positive lithium ion takes far more energy. As a result, charge transfer resistance across the solid electrolyte interphase ends up dominating total cell impedance.
Solid-state diffusion inside graphite anodes and layered nickel-manganese-cobalt oxide cathodes degrades in parallel. Transitioning from twenty-five degrees Celsius down to minus thirty degrees Celsius drops solid diffusion coefficients by two to three orders of magnitude. Instead of distributing evenly within the host material, lithium builds up at particle surfaces.
This gradient creates severe concentration polarization, cutting discharges short when the cell hits its lower voltage cutoff prematurely.

Charge Transfer Resistance at Subzero Thresholds
Interfacial impedance grows exponentially once ambient temperatures drop below zero degrees Celsius. The solid electrolyte interphase ~ built mostly of lithium carbonate, lithium fluoride, and alkyl carbonates ~ acts as both a physical and electrostatic barrier. While this layer prevents ongoing solvent degradation at room temperature, its ionic conductivity falls off precipitously in the cold.
Analyzing high- and mid-frequency arcs on electrochemical impedance spectra shows severe polarization growth. The high-frequency intercept, which reflects bulk electrolyte ohmic resistance, widens moderately. The mid-frequency semicircle, corresponding to interfacial charge transfer resistance, expands dramatically.
At minus twenty degrees Celsius, charge transfer resistance can account for over eighty percent of total internal cell resistance, suppressing terminal voltage under load and terminating discharge early.
Discharge capacity at minus thirty degrees Celsius drops by forty-two percent when continuous discharge rates increase from one-tenth C to one-half C.
Cell design heavily dictates the severity of these kinetic losses. Thin, high-porosity electrode coatings keep local current density low and shorten diffusion paths, curbing concentration polarization. Conversely, thick electrodes built for high energy density generate extreme overpotentials under subzero conditions, locking away a large share of stored energy at standard discharge rates.
Additives like fluoroethylene carbonate or vinylidene carbonate alter the solid electrolyte interphase composition, lowering the activation energy for lithium ion transport to improve cold performance.
Poor subzero output stems primarily from internal mass transport limits rather than external wiring losses.
Chill
Thermal mass delays internal equilibrium relative to surface readings inside environmental test chambers. A cell in a subzero chamber hits ambient surface temperatures long before its core settles thermally. Starting tests too soon yields flawed capacity and voltage metrics, as internal self-heating or leftover thermal energy distorts kinetic measurements.
Reliable testing requires explicit soak durations calculated from cell thermal mass, core heat capacity, and convective heat transfer coefficients.
Formats like 21700 or 4680 cylindricals, as well as thick prismatics, suffer from low transverse thermal conductivity. Heat generated in the internal electrode jellyroll has to cross multiple layers of active material, current collectors, and separator foils to reach the casing. When evaluating subzero discharge profiles, running tests too early captures transient states where the core remains warmer than chamber air, artificially inflating discharge capacity.

Thermal Equilibration and Internal Gradients
Core temperatures in large prismatic cells lag behind surface thermocouple readings during fast thermal transitions. Thermal behavior is governed by the Biot number, which compares internal conductive resistance against external convective resistance. Large cell formats yield Biot numbers above 0.1, meaning internal thermal gradients cannot be ignored.
A four-hour cold soak might chill the aluminum casing to minus twenty degrees Celsius while the core remains several degrees warmer.
Tracking thermal stabilization requires multi-point thermocouple setups or non-destructive core temperature estimation using electrochemical impedance spectroscopy. Phase shifts at high frequencies provide reliable thermal metrics because bulk resistance correlates directly with core temperature. Environmental chambers also require tight air velocity control, as natural convection creates uneven thermal zones across multi-cell test trays.
Core versus Surface Temperature Dynamics
High-rate discharge generates steep thermal gradients from core to casing. Dissipation from internal resistance ~ proportional to current squared times resistance ~ produces thermal energy tied directly to cold impedance growth. Reversible entropic heat synthesis also moves cell temperature depending on state of charge and chemistry, though ohmic heating dominates under subzero conditions, raising internal temperature during test runs.
Ambient air cools the casing, creating an internal gradient where the core runs substantially warmer than the skin. Since kinetics improve with heat, the core handles a disproportionate share of the current density. This localized current crowding accelerates degradation and can trigger non-uniform lithium deposition during charging.
Soak times for high-density prismatic cells require four hours per kilogram of cell mass to reach uniform thermal equilibrium at subzero setpoints.
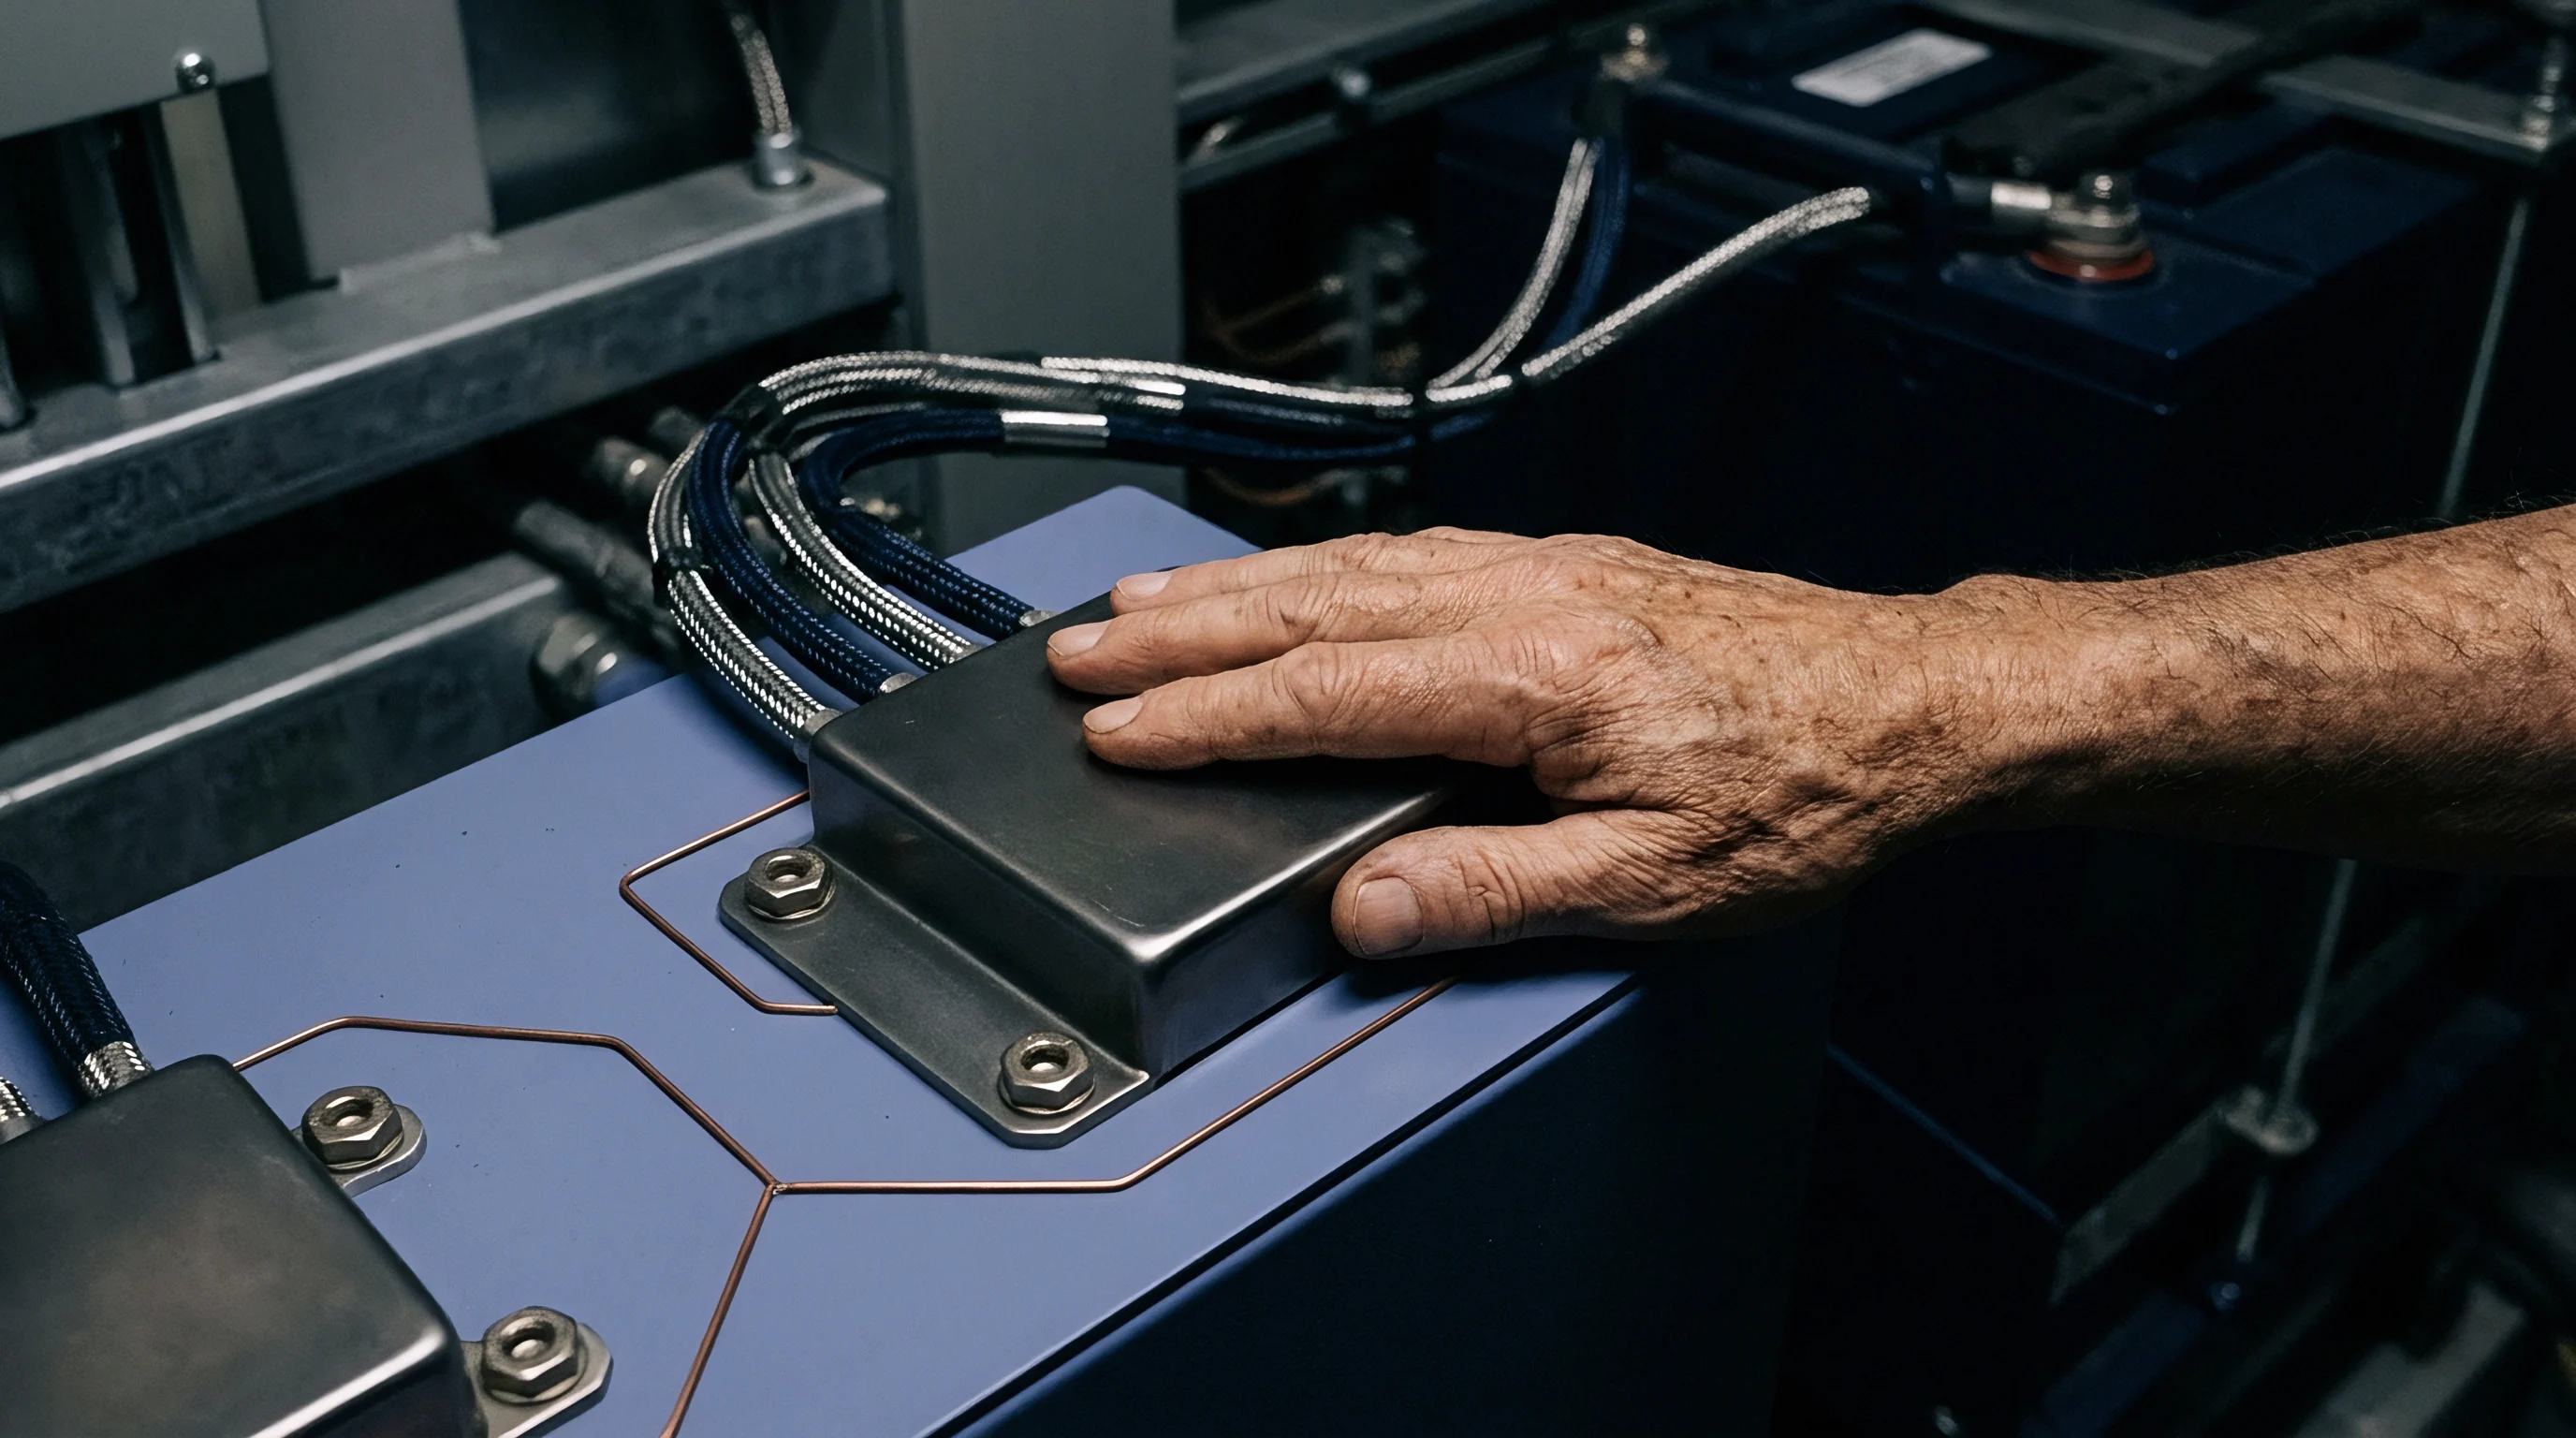
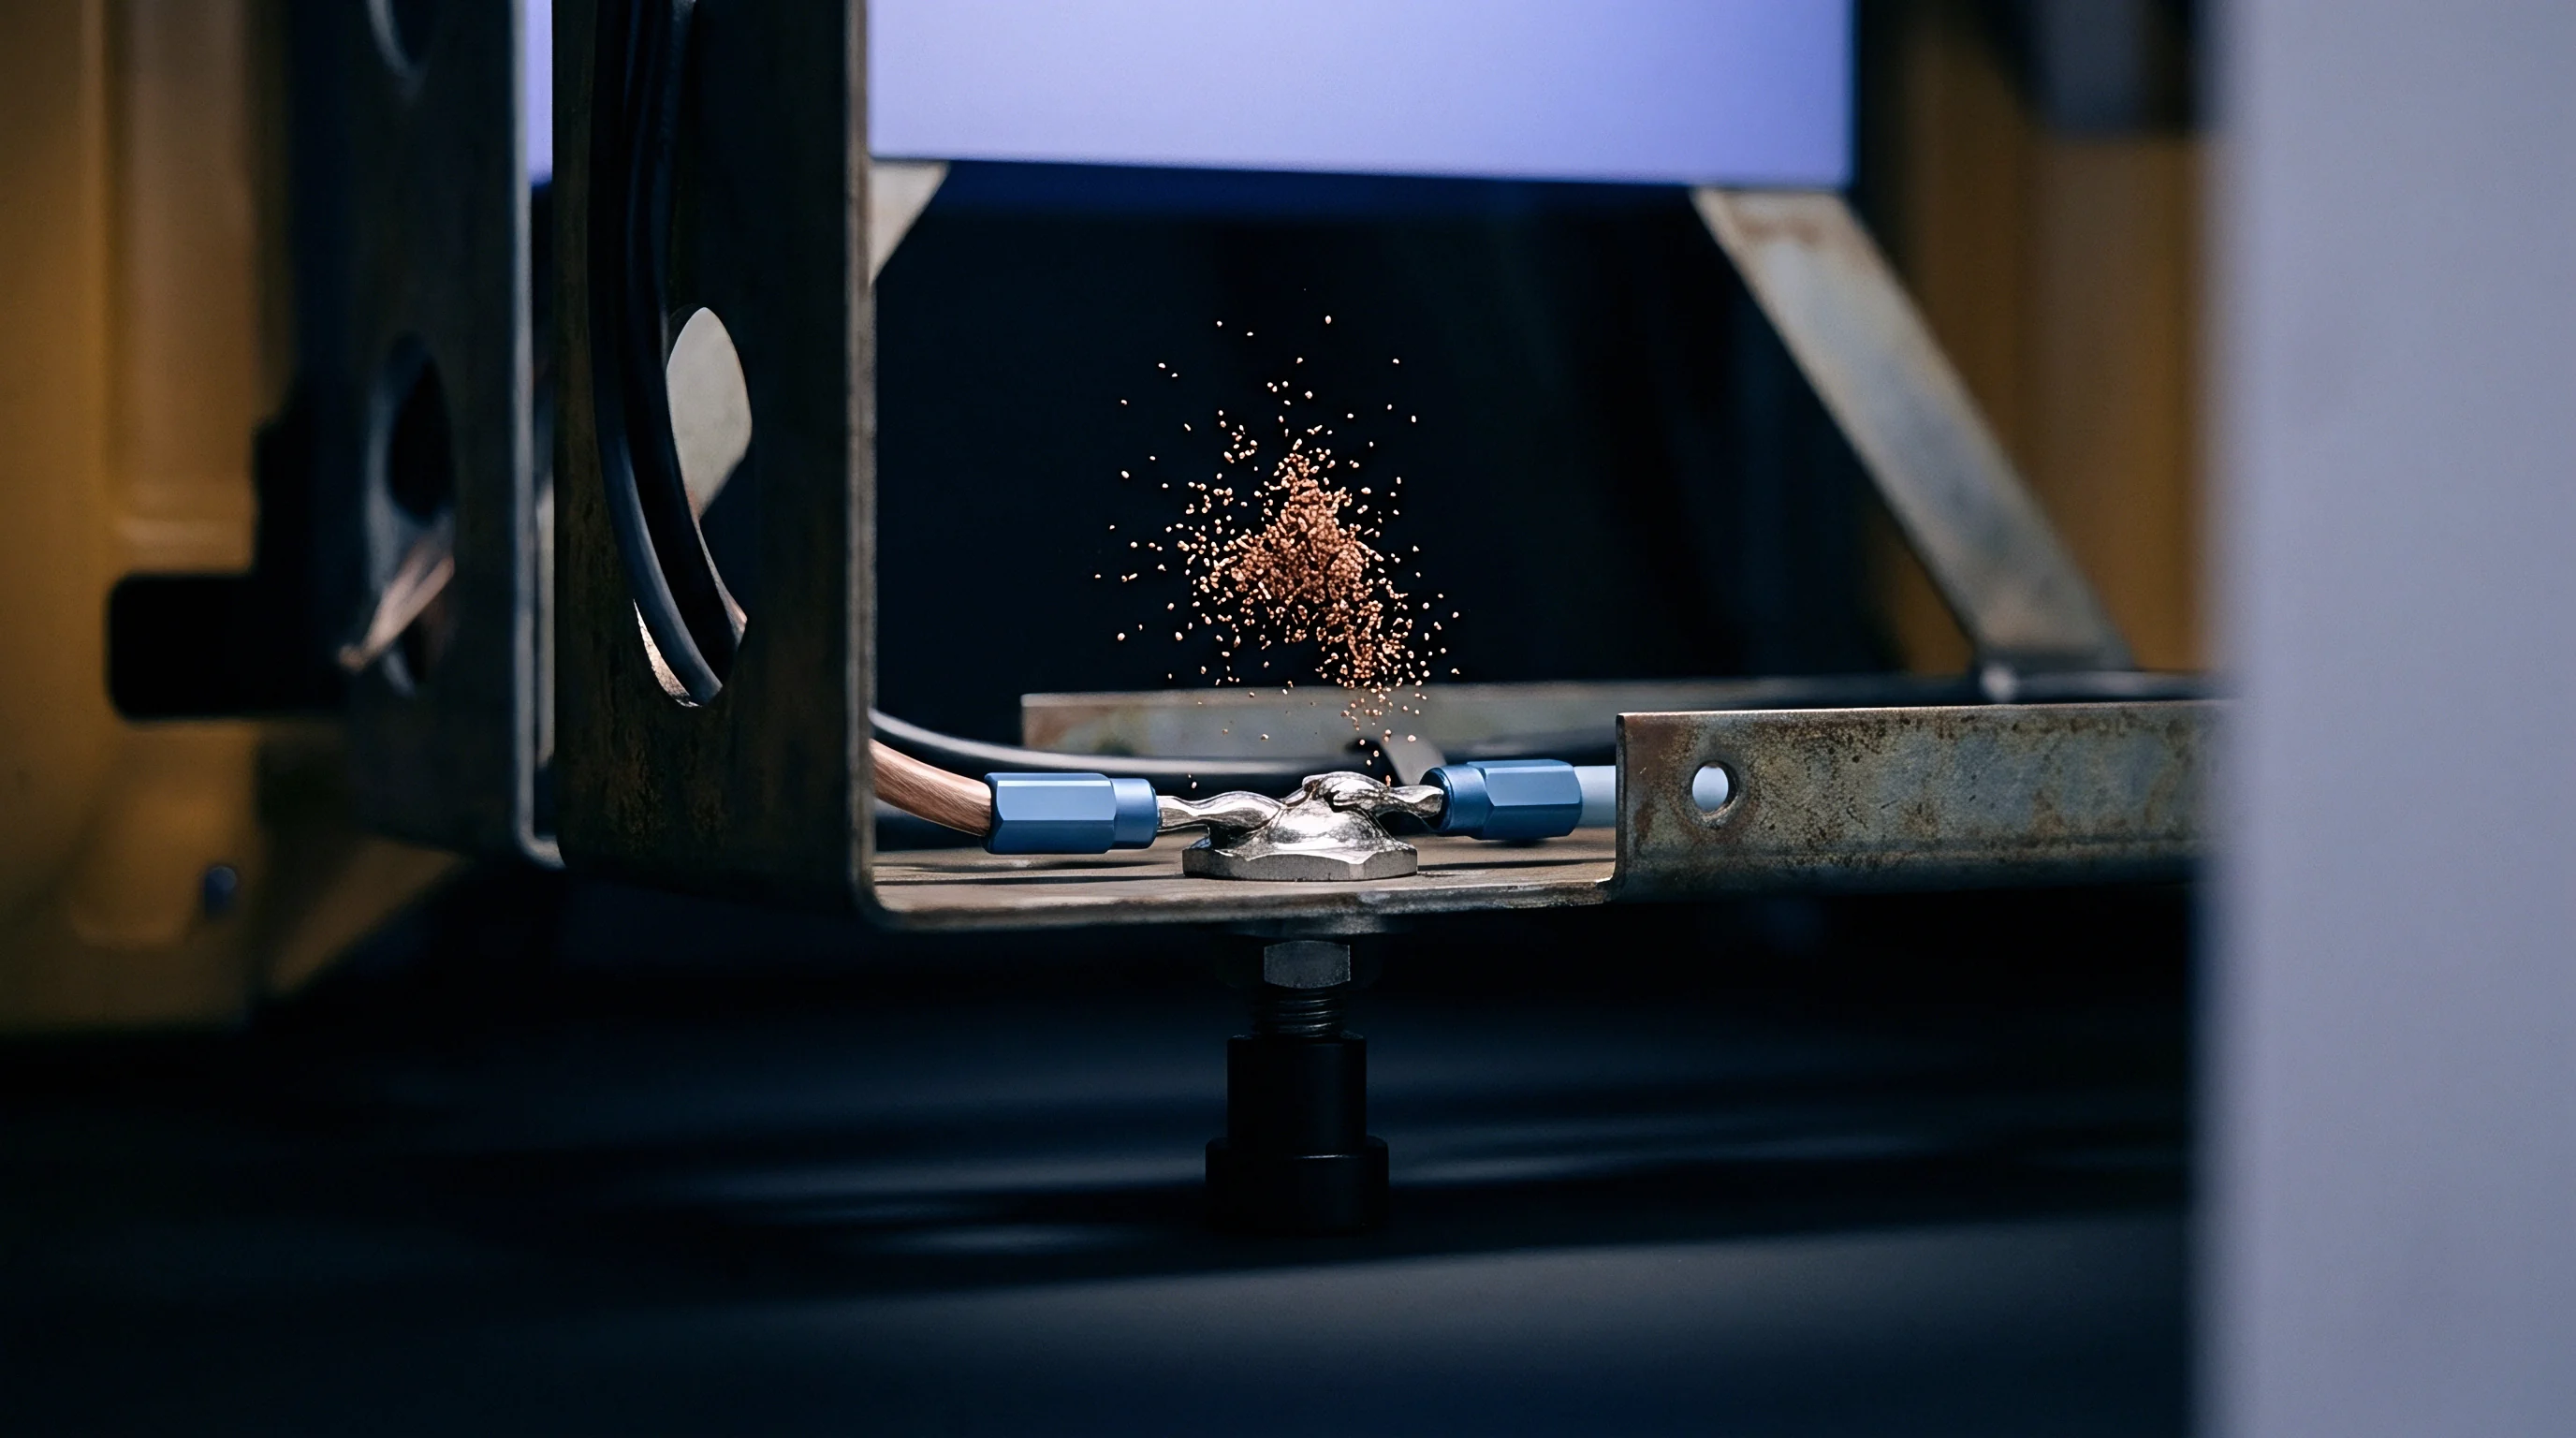
Test setups must account for ambient thermal coupling through power leads. Thick copper cables connected to cell terminals serve as thermal conduits, drawing ambient room heat straight into the test sample inside the chamber. Insulated terminal extenders and thermal breaks on test fixtures are necessary to block this heat influx from corrupting low-temperature data.
Relying solely on cell surface temperature to start a test introduces major measurement errors, as the internal electrochemistry has yet to equalize.


Rig
Accurate low-temperature measurements depend on isolating contact resistance from true internal cell impedance. At subzero setpoints, internal resistance in high-power formats falls into the milliohm or sub-milliohm range, making external contact resistance a major source of potential experimental error. Test fixtures require dedicated sensing setups, active thermal isolation, and properly calibrated signal conditioning.
Mechanical clamps expand and contract with temperature shifts, shifting contact pressure and resistance over multi-day cycling programs. Applying gold-plated, spring-loaded four-wire Kelvin probes directly to clean terminals eliminates voltage drop errors. Cable routing inside chambers must also prevent condensation, which forms stray current paths and warps impedance spectroscopy sweeps.

Four Wire Sensing and Contact Resistance Isolation
Voltage drops across high-current leads distort low-impedance cell measurements unless separate sense lines connect directly to the terminal posts. In a standard two-wire setup, test channels record the combined resistance of power cables, interface connections, and the battery. Because contact resistance shifts with thermal expansion and contraction, two-wire subzero tests produce unreliable voltage profiles and flawed internal resistance values.
Four-wire Kelvin configurations isolate current leads from voltage-sensing lines. Because the voltage-sensing circuit draws virtually zero current, contact resistance along the sense path becomes negligible. Test rigs need to maintain constant clamping force at the terminals using calibrated torque limits or constant-force pneumatic actuators rated for subzero operation.

Electrochemical Impedance Spectroscopy at Low Temperatures
Frequency sweeps from ten kilohertz down to ten millihertz map expanding charge-transfer semicircles in subzero conditions. Low-temperature impedance spectroscopy requires precise excitation amplitudes: voltages must stay small enough to preserve linear system response without disturbing the cell’s thermodynamic state ~ typically between five and ten millivolts.
Below minus twenty degrees Celsius, signal-to-noise ratios degrade due to weak voltage responses under load and thermal noise in measurement channels. Potentiostats and galvanostats need shielded, low-capacitance cabling routed away from chamber compressor motors. Any signal drift caused by self-heating during slow, low-frequency sweeps must be corrected using non-stationary impedance analysis.
Where Does Thermal Equilibrium Fail during Subzero Testing?
Continuous high-rate discharge generates ohmic self-heating that pushes core temperatures above chamber ambient. As the core warms, internal resistance drops, producing a non-linear voltage curve that masks true cold performance. If chamber thermal systems fail to clear this heat, the test ends up measuring a warming cell rather than baseline performance at the subzero setpoint.
Active cooling protocols and pulsed discharge methods help prevent thermal run-up during measurement. Running short current pulses separated by adequate rest periods allows generated heat to dissipate into chamber air, maintaining isothermal conditions. This approach captures the true baseline capability of the chemistry at the target temperature.
- Mount the cell inside the environmental chamber using insulated ceramic isolation blocks.
- Attach four-wire Kelvin sensing clamps directly to the nickel-plated copper terminal tabs.
- Affix calibrated T-type thermocouples to the geometric center of both broad faces and terminal posts.
- Lower chamber temperature to the specified target setpoint at a maximum rate of one degree per minute.
- Hold target temperature for a minimum of four hours to eliminate internal thermal gradients.
- Perform open-circuit voltage verification to ensure thermodynamic stabilization.
- Execute the electrochemical test profile while recording voltage, current, and temperature at one-hertz intervals.
Data acquisition systems need to sample parameters synchronously across high-speed channels. Voltage, current, surface temperature, and ambient channels must align temporally to correlate transient polarization events accurately with thermal shifts.
| Temperature (°C) | Ohmic Resistance R_0 (mΩ) | Charge Transfer R_ct (mΩ) | Diffusion Coefficient D_Li (cm²/s) | Capacity Retention at 1C (%) |
|---|---|---|---|---|
| 25 | 0.42 | 0.28 | 2.4 × 10⁻¹⁰ | 100.0 |
| 0 | 0.58 | 0.95 | 8.1 × 10⁻¹¹ | 91.2 |
| -10 | 0.79 | 2.41 | 3.2 × 10⁻¹¹ | 78.5 |
| -20 | 1.15 | 6.85 | 9.5 × 10⁻¹² | 54.1 |
| -30 | 1.82 | 19.40 | 1.8 × 10⁻¹² | 22.8 |
| Data recorded following a 6-hour thermal soak at 50% state of charge using a 10 mV AC excitation EIS sweep from 10 kHz to 10 mHz. | ||||
Standard IEC 61960-3 sub-clause 7.6 specifies low-temperature discharge testing at minus twenty degrees Celsius after a sixteen-hour soak, overriding vendor datasheet claims built on shortened soaking windows.
Hysteresis
Voltage responses during subzero charge-discharge cycles show pronounced asymmetry driven by mass transport limits. Open-circuit voltage relaxation stretches from minutes into hours cold. Remove the load, and terminal voltage recovers slowly while internal lithium ion concentration profiles relax back toward equilibrium.
This prolonged relaxation distorts state-of-charge algorithms designed for ambient temperatures.
Polarization losses during discharge drag terminal voltage down, while charging polarization pushes voltage rapidly toward upper safety cutoffs. This widening gap slashes round-trip energy efficiency, converting much of the stored chemical energy into internal waste heat.
Voltage Suppression and Energy Efficiency Loss
Under load in the cold, terminal voltage drops abruptly from large ohmic and polarization overpotentials. A cell rated for nominal operation at 3.7 volts can fall instantly to 3.0 volts when loaded at minus twenty degrees Celsius. Bulk electrolyte resistance drives this initial collapse, followed by a steady voltage decay governed by sluggish solid-state diffusion.
Efficiency losses compound in subzero operation. Lower average discharge voltages paired with elevated charge voltages constrain net energy yield. In arctic energy storage systems, round-trip efficiency routinely drops below sixty percent, requiring oversized thermal management and generation capacity to keep systems running.

Self-Heating Kinetics and Transient Overpotentials
Internal resistance converts electrical energy into heat during low-temperature discharge runs. Under heavy current loads, this self-heating produces a characteristic V-shaped voltage curve: voltage plummets initially under cold resistance, then rebounds mid-discharge as internal warmth thins the electrolyte and speeds up interfacial kinetics.
Failure to enforce four-wire Kelvin connections during low-temperature testing invalidates cell qualification dossiers under international automotive standard ISO 12405-4.
Transient overpotentials during cold charging force anode interfacial potential below zero volts relative to a lithium reference electrode. In this thermodynamic state, metallic lithium deposition competes directly with graphite intercalation, creating serious safety risks and accelerating cell degradation.
| Operating Regimes | Discharge C-Rate | Average Discharge Voltage (V) | Wh Efficiency (%) | Thermal Energy Generation (kJ) |
|---|---|---|---|---|
| 25°C Isothermal | 1.0C | 3.68 | 94.2 | 12.4 |
| 0°C Chamber Ambient | 1.0C | 3.41 | 83.6 | 31.8 |
| -10°C Chamber Ambient | 1.0C | 3.18 | 72.1 | 58.2 |
| -20°C Chamber Ambient | 0.5C | 3.05 | 64.5 | 76.9 |
| -20°C Isothermal (Pulsed) | 0.5C | 2.78 | 48.2 | 112.5 |
Whether electrolyte additives can curb interfacial resistance growth at minus forty degrees without compromising high-temperature storage stability remains an open question in battery research.


Discrepancy
Discrepancies between catalog specs and bench test data stem from artificial test conditions designed to minimize polarization. Cell manufacturers often report subzero capacity using tiny discharge rates ~ like 0.02C or 0.05C ~ that bear little resemblance to real-world demands. Alternatively, datasheets show tests run immediately after pulling cells from room-temperature storage, using residual internal heat to mask true cold performance.
Technical marketing materials rarely document the full thermal and electrical history of test samples. A cell advertised at eighty percent capacity retention at minus twenty degrees Celsius under a 0.1C load will fall flat when subjected to a continuous 1C duty cycle in industrial service.
Datasheet Flattery versus Bench Execution
Manufacturer test protocols frequently use low C-rates or elevated cutoff voltages to hide cold capacity dropoffs. Discharging at C/50 minimizes mass transport constraints, recovering near-theoretical capacity even at minus thirty degrees Celsius. But commercial systems cannot operate at such negligible power draws without sacrificing utility.
Bench testing under a one-C load at minus twenty degrees Celsius shows a thirty-five percent drop in usable capacity compared to supplier marketing curves recorded at one-tenth C. Evaluation must match operational reality by applying realistic current profiles, continuous power loads, and actual airflow conditions.
Lithium Plating and Cycle Degradation at Low Temperatures
Charging lithium-ion cells below zero degrees drives anode potential below zero volts against metallic lithium, causing metal deposition. Metallic lithium forms dendrites capable of piercing separator foils, triggering self-discharge micro-shorts, thermal instability, or complete cell failure. Cold-charging protocols demand low C-rates and strict voltage ceilings to stay clear of the plating threshold.
Overpotential speeds up irreversible capacity loss. Plated lithium reacts with solvent molecules to build secondary solid electrolyte interphase structures, permanently tying up active lithium. This mechanism causes rapid capacity fade during subzero cycling, dropping cell life from thousands of cycles down to tens or hundreds if charging currents are not strictly limited.
- Dendritic Metallic Plating deposits metallic lithium onto graphite surfaces, creating short-circuit hazards.
- Electrolyte Depletion accelerates as decomposed lithium salts thicken the solid electrolyte interphase layer.
- Particle Microcracking occurs when steep concentration gradients force non-uniform volume changes in cathode materials.
- Gassing and Venting occur when high overpotentials decompose electrolyte solvent species into volatile gases.
Tracking impedance growth across subzero cycles catches early signs of internal structural decay. Differential voltage analysis (dV/dQ) calculated from low-rate cycling profiles identifies peak shifts tied to active material loss and lithium depletion before anode potential drops negative. This diagnostic capability allows engineers to set safe operating envelopes that prevent permanent cell failure in cold environments.
Relying on datasheet claims for cold capacity without laboratory validation yields undersized battery packs and unexpected shutdowns in subzero field operations.


Dossier
Translating electrochemical metrics into procurement contracts requires explicitly defining test parameters in vendor agreements. Cell qualification programs should tie technical limits directly to warranty terms, landed cost calculations, and batch acceptance criteria. Procurement clauses that omit test C-rates, soak durations, or thermal controls leave buyers exposed to performance defaults in cold-climate deployments.
Electrolyte viscosity climbs rapidly in the cold. Procurement dossiers need to require supplier certification under third-party testing that matches actual operational duty cycles. Evaluating low-temperature capacity retention on a landed-cost basis ensures that pack designs account for required capacity oversizing, auxiliary heating power draw, and lifetime degradation.

Contractual Integration of Low Temperature Test Standards
Purchase specifications must incorporate exact pulse profiles, ambient soak durations, and clear end-of-life capacity metrics. Technical annexes in supply agreements should set minimum voltage cutoffs under peak cold loads to prevent premature cutoffs in the field. Warranties also need explicit cold-charging boundaries, defining safe current limits across temperatures and states of charge to avoid disputes over lithium plating.
Incoming batch inspection should rely on statistical sampling of subzero internal resistance. Any batch showing out-of-spec impedance growth in the cold gets flagged for quarantine and root-cause analysis before moving to module assembly.
Landed Cost and Cycle Life Arithmetic at Subzero Operating Conditions
Delivered energy costs climb quickly when subzero degradation cuts into total cycle life. A cell that looks economical based on room-temperature cost-per-kilowatt-hour can effectively double in per-cycle cost once cold capacity suppression and accelerated aging are factored in. Financial models have to include thermal management power draw alongside efficiency losses to gauge true landed cost.
- Thermal Soak Protocol defines the exact soak duration and chamber stability window required before testing.
- Voltage Cutoff Boundaries set lower limits to prevent severe polarization damage during cold discharge.
- Plating Detection Criteria use differential voltage metrics to spot metallic lithium deposition.
- Warranty Adjustment Factors index guaranteed cycle life directly to the proportion of subzero charge cycles run.
Evaluating performance across thermal bands builds lifecycle economic models for cold-climate energy storage deployments. Factoring in real-world cold energy delivery provides realistic ROI estimates and avoids premature replacement schedules.
| Operating Temperature Profile | Cycle Life to 80% EOL | Average Energy Efficiency (%) | Total Lifetime Energy Delivered (MWh) | Landed Cost per Delivered kWh ($) |
|---|---|---|---|---|
| Continuous 25°C | 3,500 | 93.5 | 58.2 | 0.086 |
| Seasonal Variation (0°C to 25°C) | 2,400 | 86.2 | 36.3 | 0.137 |
| Continuous -10°C (Optimized Charge) | 1,100 | 74.0 | 14.3 | 0.349 |
| Continuous -20°C (Uncontrolled Charge) | 180 | 58.1 | 1.9 | 2.631 |
Landed cell cost calculations remain incomplete until subzero capacity retention factors are factored into the economic model.