Grading Games in the Secondary Cell Market
Secondary cell sorting games artificially elevate capacity ratings via thermal and discharge rate manipulation, requiring strict incoming testing to avoid severe pack failure.

Bins
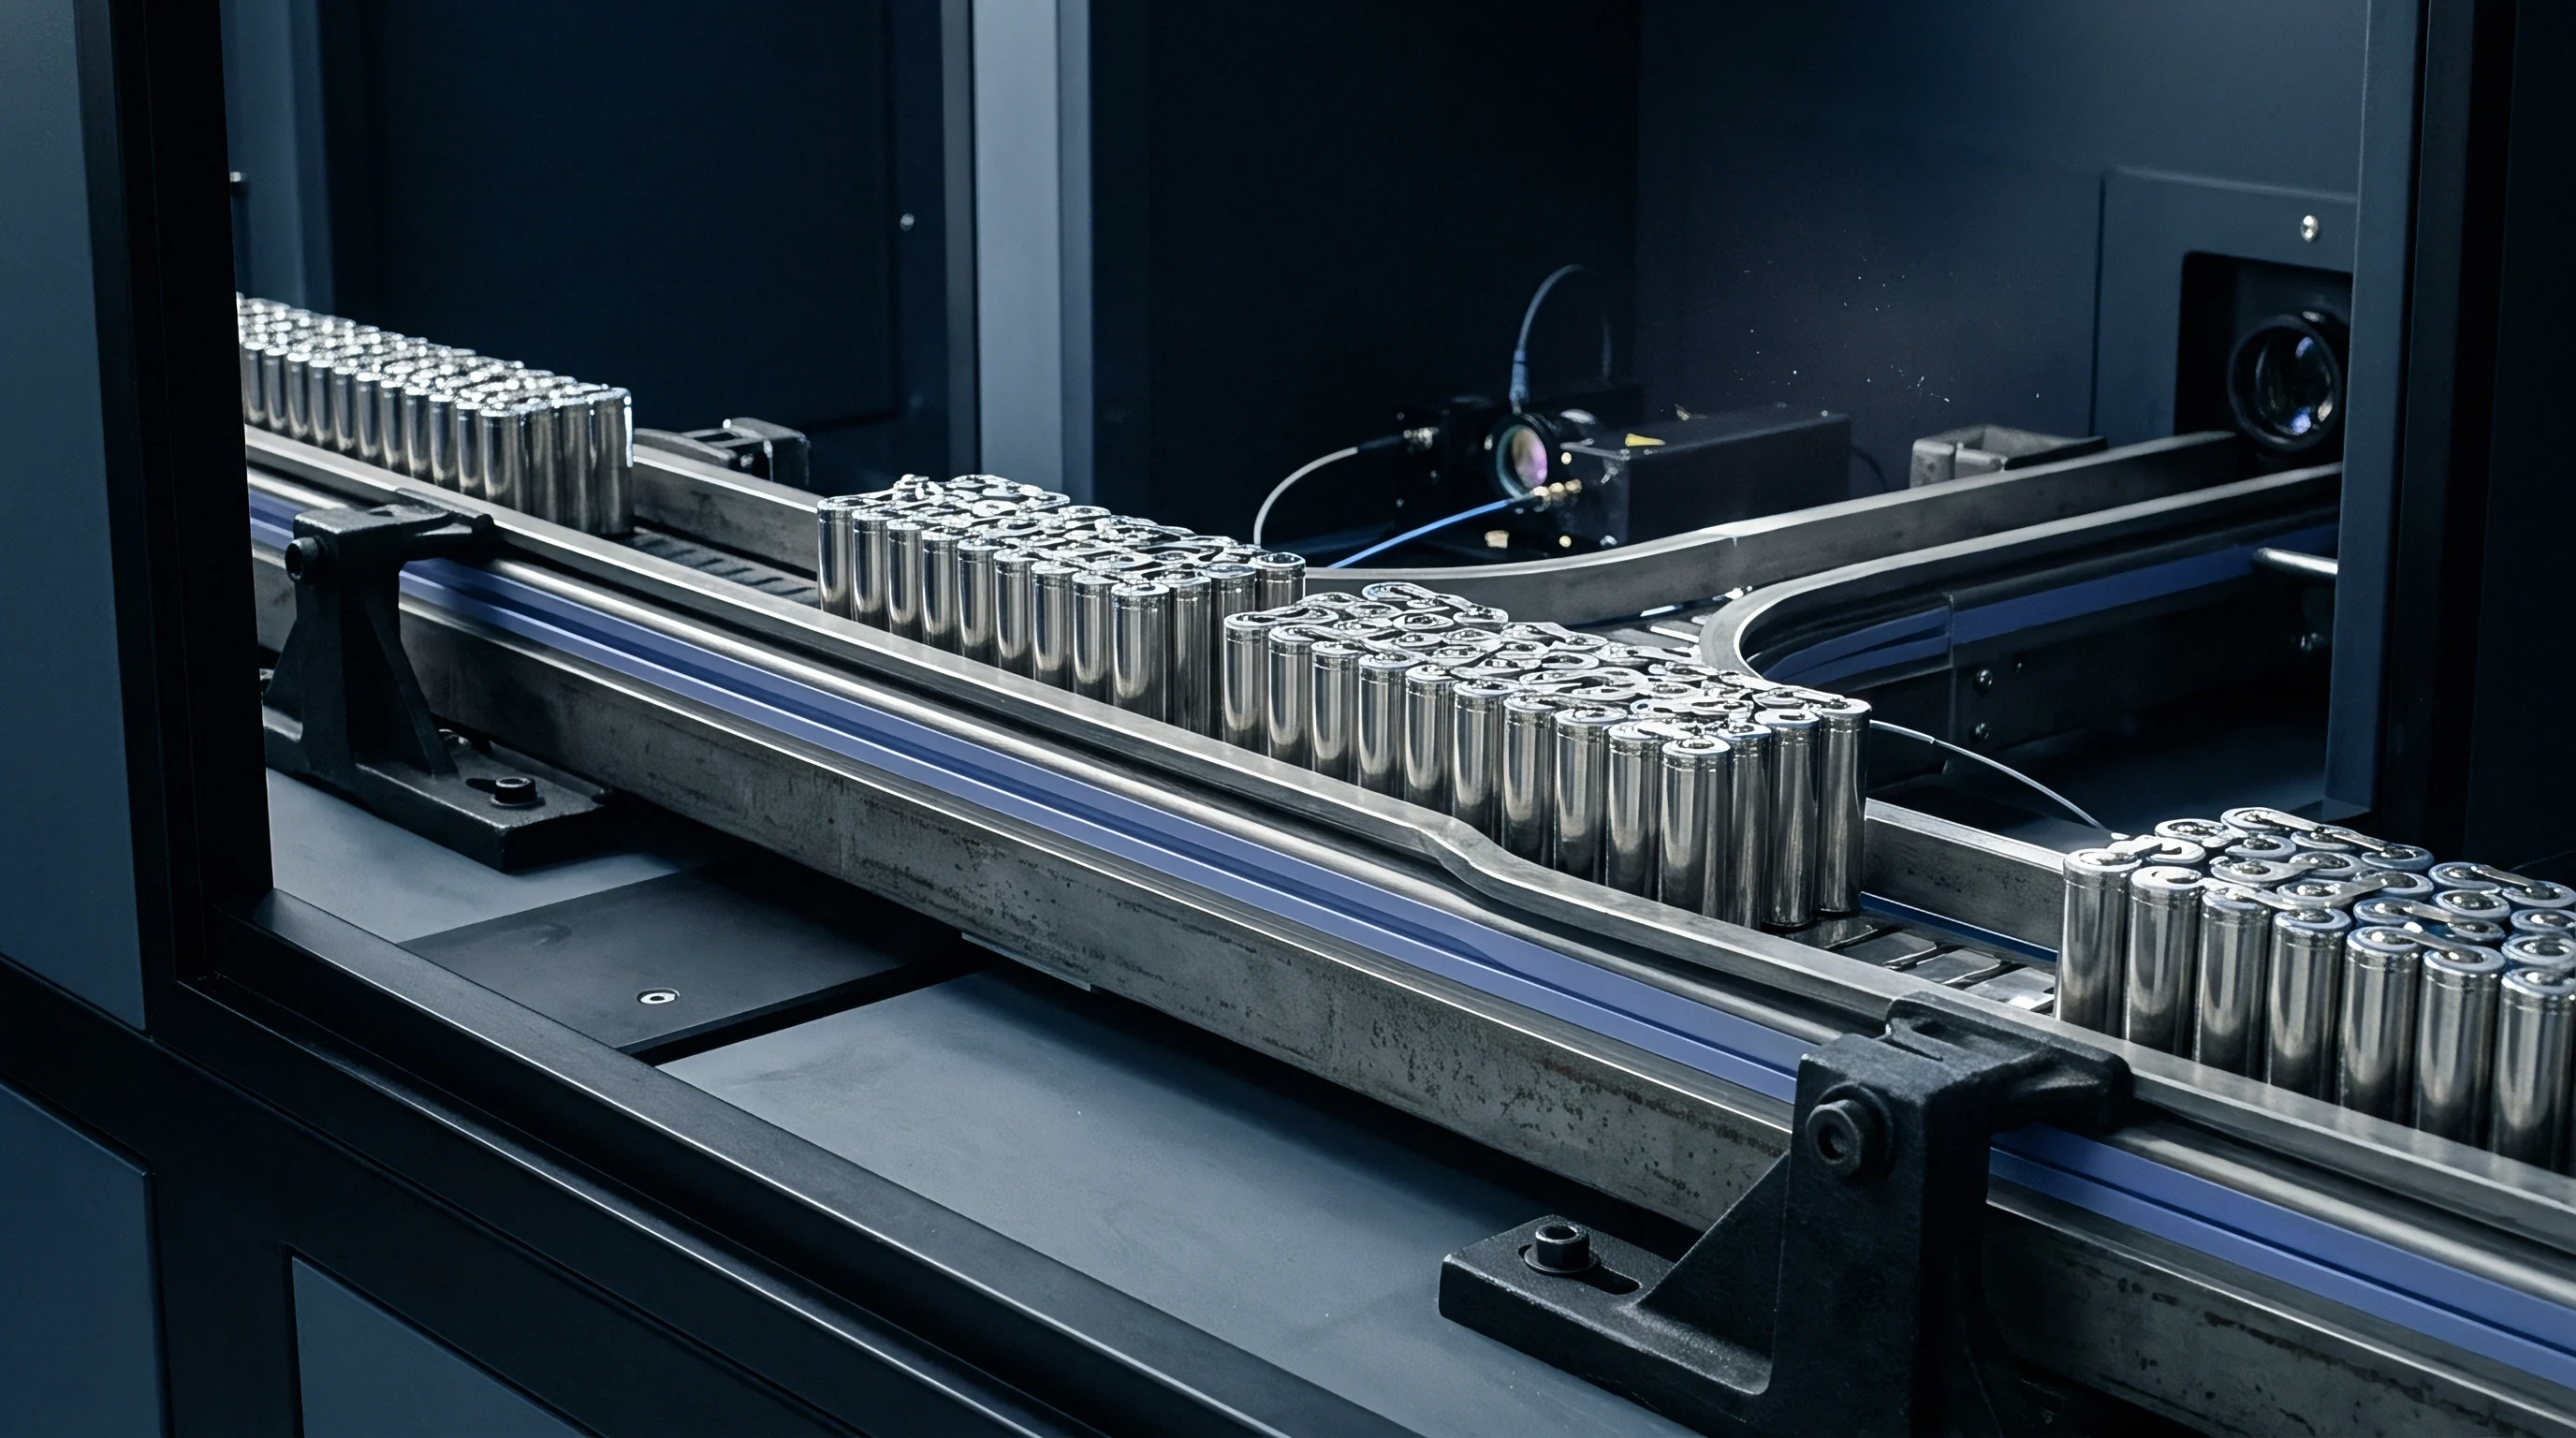
Automated sorting channels on a high-throughput factory floor evaluate thousands of freshly formed prismatic and cylindrical units every hour. Voltage drop curves, room-temperature capacity readings, and high-frequency internal resistance values set the commercial grade of each physical unit before laser etching adds a permanent serial code. Cells that hit every tight tolerance for capacity, internal impedance, and voltage retention over a fourteen-day room-temperature quarantine earn a Grade A classification.
These pristine units go straight to electric vehicle OEMs and tier-one grid storage integrators, who pay contract premiums for minimal variance across manufacturing batches.
Manufacturing yields never reach one hundred percent. Slight variations in slurry thickness, separator porosity, foil tension, or electrolyte fill volume scatter performance metrics across any production lot. Cells missing the strict Grade A window drop into lower tiers, routed by factory sorting software based on how far ~ and in what way ~ they miss nominal specs.
A cell with a two percent capacity deficit but normal internal resistance might go to residential energy storage or light electric vehicles. Higher self-discharge rates or wide impedance swings pose a bigger liability, so those exit the main factory through secondary liquidators.
Secondary cell markets thrive on the arbitrage between nominal factory ratings and reconditioned commercial classifications. Independent trading houses buy lower-tier inventory, production overruns, cancelled OEM orders, and decommissioned test modules by the metric ton. Their sorting operations can match primary factories in scale, though their objectives differ.
Primary manufacturers grade cells to keep lots uniform and protect their brand. Secondary traders grade them to push as many units as possible into higher-value classifications, taking advantage of the gaps between standard commercial test procedures and actual operating conditions.
The nominal discharge capacity of a reconditioned lithium iron phosphate cell increases by 3.8 percent when tested at 40 degrees Celsius instead of the standard 25 degrees Celsius reference temperature.
Thermal manipulation during capacity sorting is the easiest way to inflate numbers on degraded or lower-tier inventory. Heat speeds up electrochemical kinetics, lowering electrolyte viscosity and helping lithium ions move faster through porous electrode structures. A cell suffering from capacity loss due to isolated active material or lost lithium yields higher numbers when heated during test cycles.
Secondary traders exploit this by running sorting channels at ambient temperatures between 35 and 40 degrees Celsius, pushing measured capacity above the official 25 degrees Celsius standard defined in IEC 61960. A unit delivering ninety-six percent of rated capacity at 38 degrees Celsius drops to ninety-one percent when installed in a pack running at normal room temperature.
Lowering the discharge rate offers another lever for bumping cells into higher commercial brackets. Primary manufacturers certify Grade A specifications using standardized continuous rates of 0.5C or 1C depending on the application. Secondary sorters frequently drop the rate to 0.2C or 0.1C during testing.
Lower current density cuts the ohmic voltage drop across internal resistance, so the cell runs longer before hitting its lower cutoff voltage. That logs a higher total ampere-hour figure on the automated test rig. A cell sold as a one-hundred-ampere-hour unit under 0.2C test conditions delivers only ninety-two ampere-hours under a realistic 1C continuous load.
| Factory Grade | Initial Capacity Variance | 1 kHz AC IR Deviation | 14-Day Delta-V Standard | Secondary Market Relabel Target |
|---|---|---|---|---|
| Grade A Prime | Plus or minus 1.5 percent nominal | Within 0.15 milliohms of spec | Less than 1.5 millivolts total | Original Manufacturer Grade A |
| Grade A Minus | Minus 2.0 to 3.5 percent nominal | Within 0.30 milliohms of spec | 1.5 to 3.0 millivolts total | Relabeled Grade A Prime |
| Grade B Capacity | Minus 3.5 to 8.0 percent nominal | Within 0.50 milliohms of spec | 3.0 to 6.0 millivolts total | Grade A Nominal at 0.2C Rate |
| Grade B Impedance | Within 2.0 percent nominal | 0.50 to 1.20 milliohms high | 3.0 to 8.0 millivolts total | Grade A for Low-C Duty |
| Grade C / Off-Spec | Greater than 8.0 percent deficit | Greater than 1.20 milliohms high | Greater than 8.0 millivolts total | Re-sorted Grade B or Surplus |
Timing and method in impedance testing create another gap between trading desk promises and real-world performance. Standard factory sorters record internal resistance using a 1 kHz alternating current signal, reporting RAC. That quick reading captures ohmic resistance across current collectors, tabs, electrolyte, and contact points, but misses charge transfer resistance at the electrode-electrolyte interface.
A degraded secondary cell can show a low 1 kHz AC resistance while suffering from severe interfacial breakdown and heavy solid electrolyte interphase growth. Measuring direct current internal resistance (RDC) with high-current pulses reveals the true internal losses, but secondary suppliers rarely publish RDC metrics on their offer sheets.
Poor storage conditions worsen the defects that sent these cells to secondary channels in the first place. Millions of units sit in unconditioned warehouses for months or years awaiting buyers. Heat speeds up parasitic side reactions at the electrode surface, thickening the solid electrolyte interphase and tying up active lithium ions.
Storing cells at a high state of charge adds mechanical stress to cathode particle lattices, causing micro-cracking and transition metal dissolution. When liquidators buy these aged lots, they run quick re-sorting passes to mask the storage damage ~ balancing cells to a thirty percent state of charge, cleaning the outer casings, and printing datasheets built on heat-flattered test numbers.
The supply pipeline for these cells runs through several hands. Primary manufacturers sell rejected lots to licensed scrap handlers under agreements requiring destruction or non-compete industrial reuse. In practice, scrap handlers often sell intact inventory to overseas trading companies.
These traders handle sorting, cosmetic touch-ups, re-sleeving, and code re-etching before listing the inventory on global business-to-business platforms. From there, cells enter regional distribution networks where smaller pack assemblers, off-grid equipment makers, and system integrators buy them at discounts ranging from thirty to sixty percent off primary factory prices.
Understanding secondary inventory means tracking why a cell failed factory inspection in the first place. Prismatic cells rejected for minor shell scratches or pole alignment tolerances remain electrochemically identical to prime units. Those pulled for formation channel aborts, electrolyte fill errors, or insulation breakdown carry latent safety risks.
Secondary market grading protocols regularly mix cosmetic rejects with electrochemically impaired units inside the same sales batch. The buyer gets a log showing consistent external dimensions and resting voltages, but receives a mixed bag of sound and unstable cells.
Commercial re-sorting plants use high-density multi-channel cyclers to process thousands of incoming secondary units per day. Automated scripts run rapid charge and discharge profiles, fitting measured parameters to target curves and assigning individual units to bins marked by internal alphanumeric codes. Binning criteria vary widely between trading operations.
Some sort strictly by open-circuit voltage after a twenty-four-hour rest period. Others use multi-factor matrices combining high-rate capacity, AC resistance, and mass. Without industry standards for secondary cell classification, buyers remain dependent on whatever testing setup an individual trading desk decides to run.
When buyers spot capacity shortfalls after delivery, sellers usually dismiss them as normal factory variance. They point to differences in test channels, cable calibration, clamping pressure, or ambient lab temperature, insisting the delivered units comply with secondary grade descriptions agreed on before shipment.

Impedance
Measuring AC resistance at a single frequency shows only a fraction of the total opposition to current flow in a lithium-ion cell. A 1 kHz AC fixture applies a sinusoidal excitation current and records the immediate phase shift and voltage response. That rapid test bypasses the slower electrochemical processes governing mass transport and charge transfer.
The resulting RAC value reflects electronic conductivity through current collectors, tab welds, liquid electrolyte, and particle contact points ~ nothing more. A secondary cell displaying an acceptable RAC reading of 0.3 milliohms can still exhibit severe polarization, capacity drop, and heat generation under continuous direct current discharge in an operational pack.
Direct current internal resistance (RDC) measurements capture the full voltage drop resulting from ohmic losses, charge transfer resistance, and concentration polarization. Running a cell under a 1C continuous discharge pulse for ten seconds forces lithium ions across the solid electrolyte interphase, through the active electrode material, and across particle boundaries. The initial voltage drop in the first few milliseconds represents pure ohmic resistance, while ongoing voltage decay reflects interfacial charge transfer kinetics and concentration gradients within electrolyte pores.
Secondary cells with thick, irregular SEI layers show substantial RDC growth even when RAC values match prime specifications.
Interfacial degradation develops quickly during bad storage or cyclic aging. Elevated temperatures accelerate chemical reactions between liquid electrolyte and active electrode materials. Polymeric species, lithium fluoride, and alkyl carbonate salts precipitate onto the anode surface, thickening the passivation film.
As this film grows, lithium ions require higher activation energy to desolvation and pass into the graphite or silicon-graphite lattice, driving up charge transfer resistance (Rct). On an electrochemical impedance spectroscopy Nyquist plot, this manifests as a broadening and shifting high-to-medium frequency arc, long before any change appears at the high-frequency real-axis intercept representing ohmic resistance.
Electrochemical impedance spectroscopy (EIS) offers the diagnostic resolution necessary to separate physical aging processes from surface-level measurement anomalies. Sweeping the excitation frequency from 10 kilohertz down to 10 millihertz isolates the distinct kinetic steps governing cell performance. The high-frequency intercept on the real axis pinpoints pure ohmic resistance.
The first semicircle measures ion migration through passivation layers; the second captures charge transfer resistance at electrode interfaces. The tailing low-frequency line ~ the Warburg impedance ~ models solid-state diffusion within the active material host matrix. Degraded secondary cells show marked growth in the charge transfer semicircle and a steeper, depressed Warburg slope indicating reduced ionic diffusion.

Can EIS Isolate Storage History from Cycle Damage?
Distinguishing calendar aging from cycle damage requires analyzing the ratio between solid electrolyte interphase resistance and charge transfer resistance across multiple state-of-charge setpoints. High-temperature calendar aging consumes active lithium through side reactions, growing a thick passivation layer on the anode while leaving the cathode crystal lattice relatively intact. Cycle aging subjects cathode material to mechanical expansion and contraction stress, driving phase transitions, transition metal dissolution, and particle cracking.
When cathode particles crack, fresh unpassivated surfaces interact with electrolyte, spurring resistance spikes and capacity loss. Mapping impedance spectra across states of charge from ten percent to ninety percent isolates these distinct degradation profiles.
Self-discharge behavior provides another clear indicator of internal cell health. High-quality prime cells hold stable open-circuit voltages over months of storage, losing less than one to two percent state of charge per month at 25 degrees Celsius. Secondary cells frequently display elevated self-discharge rates, driven by parasitic chemical side reactions or micro-shorts across the separator.
Micro-shorts form when metallic contaminants, copper dendrites, or plated lithium bridge the separator gap between anode and cathode. Even microampere currents across these bridges cause open-circuit voltage to decay rapidly during resting periods.
- Fourteen-day voltage drop testing measures open-circuit voltage on days one and fourteen post-formation, calculating the daily voltage decay rate (Δ V/Δ t) to identify latent micro-shorts.
- Potentiostatic hold current profiling holds the cell at a precise constant voltage near full charge while logging the trickle current needed to offset internal self-discharge.
- Differential capacity analysis converts charge and discharge voltage curves into dQ/dV derivative peaks that reveal specific electrochemical phase transitions and active mass loss modes.
- High-resolution thermal imaging during discharge pinpoints localized internal current concentration points and tab weld defects under continuous high-C loads.
Lithium plating is a dangerous degradation mode found in secondary cells subjected to aggressive fast-charging protocols or cold-temperature operation by previous users. When anode potential drops below zero volts relative to the lithium reference potential during charge, metallic lithium deposits directly onto the graphite surface instead of intercalating into the lattice. Metallic lithium forms high-surface-area dendrites that react aggressively with organic electrolyte solvents.
This reaction consumes liquid electrolyte, drives gas generation, and risks penetrating the separator membrane. Plated lithium also breaks away from the conductive network, turning into isolated metallic deposits known as dead lithium.
Dead lithium accumulation permanently reduces usable discharge capacity while raising internal thermal dissipation. As active lithium ions become trapped in metallic form, cell stoichiometry shifts, forcing the cathode to operate at higher states of charge relative to its original design point. Operating the cathode at elevated potentials accelerates transition metal dissolution, particularly in nickel-rich chemistries like NMC 811 or NMC 622.
Dissolved manganese, nickel, or cobalt ions cross the separator to the anode, where they catalyze the breakdown of the solid electrolyte interphase film. This triggers continuous passivation layer reformation, consuming liquid electrolyte and steadily elevating cell resistance.
| Diagnostic Parameter | Prime Grade A | Secondary Tier 1 | Secondary Tier 2 | Severe Degradation |
|---|---|---|---|---|
| 1 kHz AC Resistance (RAC) | 0.25 to 0.35 mΩ | 0.32 to 0.42 mΩ | 0.40 to 0.65 mΩ | Greater than 0.80 mΩ |
| 10-Second DC Resistance (RDC) | 0.50 to 0.65 mΩ | 0.70 to 0.95 mΩ | 0.90 to 1.50 mΩ | Greater than 2.10 mΩ |
| Charge Transfer Resistance (Rct) | 0.15 to 0.25 mΩ | 0.30 to 0.55 mΩ | 0.50 to 1.10 mΩ | Greater than 1.80 mΩ |
| 28-Day Delta-V Decay | Less than 3.0 mV | 3.0 to 8.0 mV | 8.0 to 18.0 mV | Greater than 25.0 mV |
| Coulombic Efficiency (0.5C) | 99.92 to 99.98 % | 99.80 to 99.90 % | 99.50 to 99.78 % | Less than 99.30 % |
Capacity fade kinetics follow non-linear trajectories over extended operation. Early in cell life, degradation proceeds predictably as a function of the square root of time or cycle count, driven by uniform solid electrolyte interphase growth. Once mechanical damage, transition metal dissolution, or lithium plating reach critical thresholds, degradation accelerates rapidly into a rollover or knee point.
Secondary market cells often sit near this threshold. A unit purchased at eighty-five percent remaining state of health may retain linear behavior for fifty cycles before entering exponential capacity loss, dropping to sixty percent capacity within two hundred additional cycles.
Coulombic efficiency measurements give early warning of impending collapse long before gross capacity loss manifests on high-current cyclers. Coulombic efficiency defines the precise ratio of discharge capacity to charge capacity within a single complete cycle. Prime units exhibit coulombic efficiencies exceeding 99.95 percent under controlled laboratory conditions, indicating that minimal current goes toward parasitic side reactions.
Secondary cells with active interfacial breakdown drop to coulombic efficiencies of 99.80 percent or lower. A 0.15 percent difference sounds small on a single cycle, but it represents massive continuous electrolyte consumption and rapid active lithium loss over operational lifespans.
Testing these kinetic parameters requires strict environmental temperature control. Electrochemical reaction rates exhibit strong temperature dependence modeled by the Arrhenius equation. A five-degree Celsius fluctuation in ambient laboratory temperature alters measured direct current resistance by eight to twelve percent, completely obscuring structural differences between prime and secondary cell populations.
Sourcing practices that rely on field testing without thermal chamber isolation consistently fail to detect subtle interfacial degradation. Validating secondary cell shipments requires stabilizing test samples within precise environmental chambers held at twenty-five degrees Celsius plus or minus 0.5 degrees prior to applying excitation loads.
Differential voltage analysis (dV/dQ) complements capacity and impedance measurements by tracking phase transitions within individual active materials. Plotting dV/dQ against discharge capacity yields distinct voltage peaks corresponding to structural phase changes in the intercalating host lattices. Shifts in peak position and spacing identify whether lost capacity stems from loss of lithium inventory or loss of active electrode material.
When a secondary cell lot shows compressed dV/dQ peak spacing along the anode phase transition region, the primary degradation mechanism is active lithium trapping within thick surface films, suggesting the remaining host structure could support higher capacity if relabeled or reconditioned under non-standard profiles.
Higher impedance alters thermal dissipation dynamics during high-rate operation. Internal heat generation scales directly with direct current resistance according to Joule’s Law, where power loss equals the square of current multiplied by resistance (P = I2 R). A secondary cell with double the RDC of a prime unit generates twice as much thermal energy under identical load currents.
That elevated heat raises internal cell temperatures, driving faster parasitic reaction rates and creating a destructive thermal feedback loop inside enclosed battery modules that lack adequate heat sinking.
Whether electrochemical impedance spectroscopy signatures measured at room temperature can reliably predict thermal runaway onset temperatures under severe overcharge conditions remains uncertain, as published research data shows significant scatter across different cathode chemistries.

Sleeve
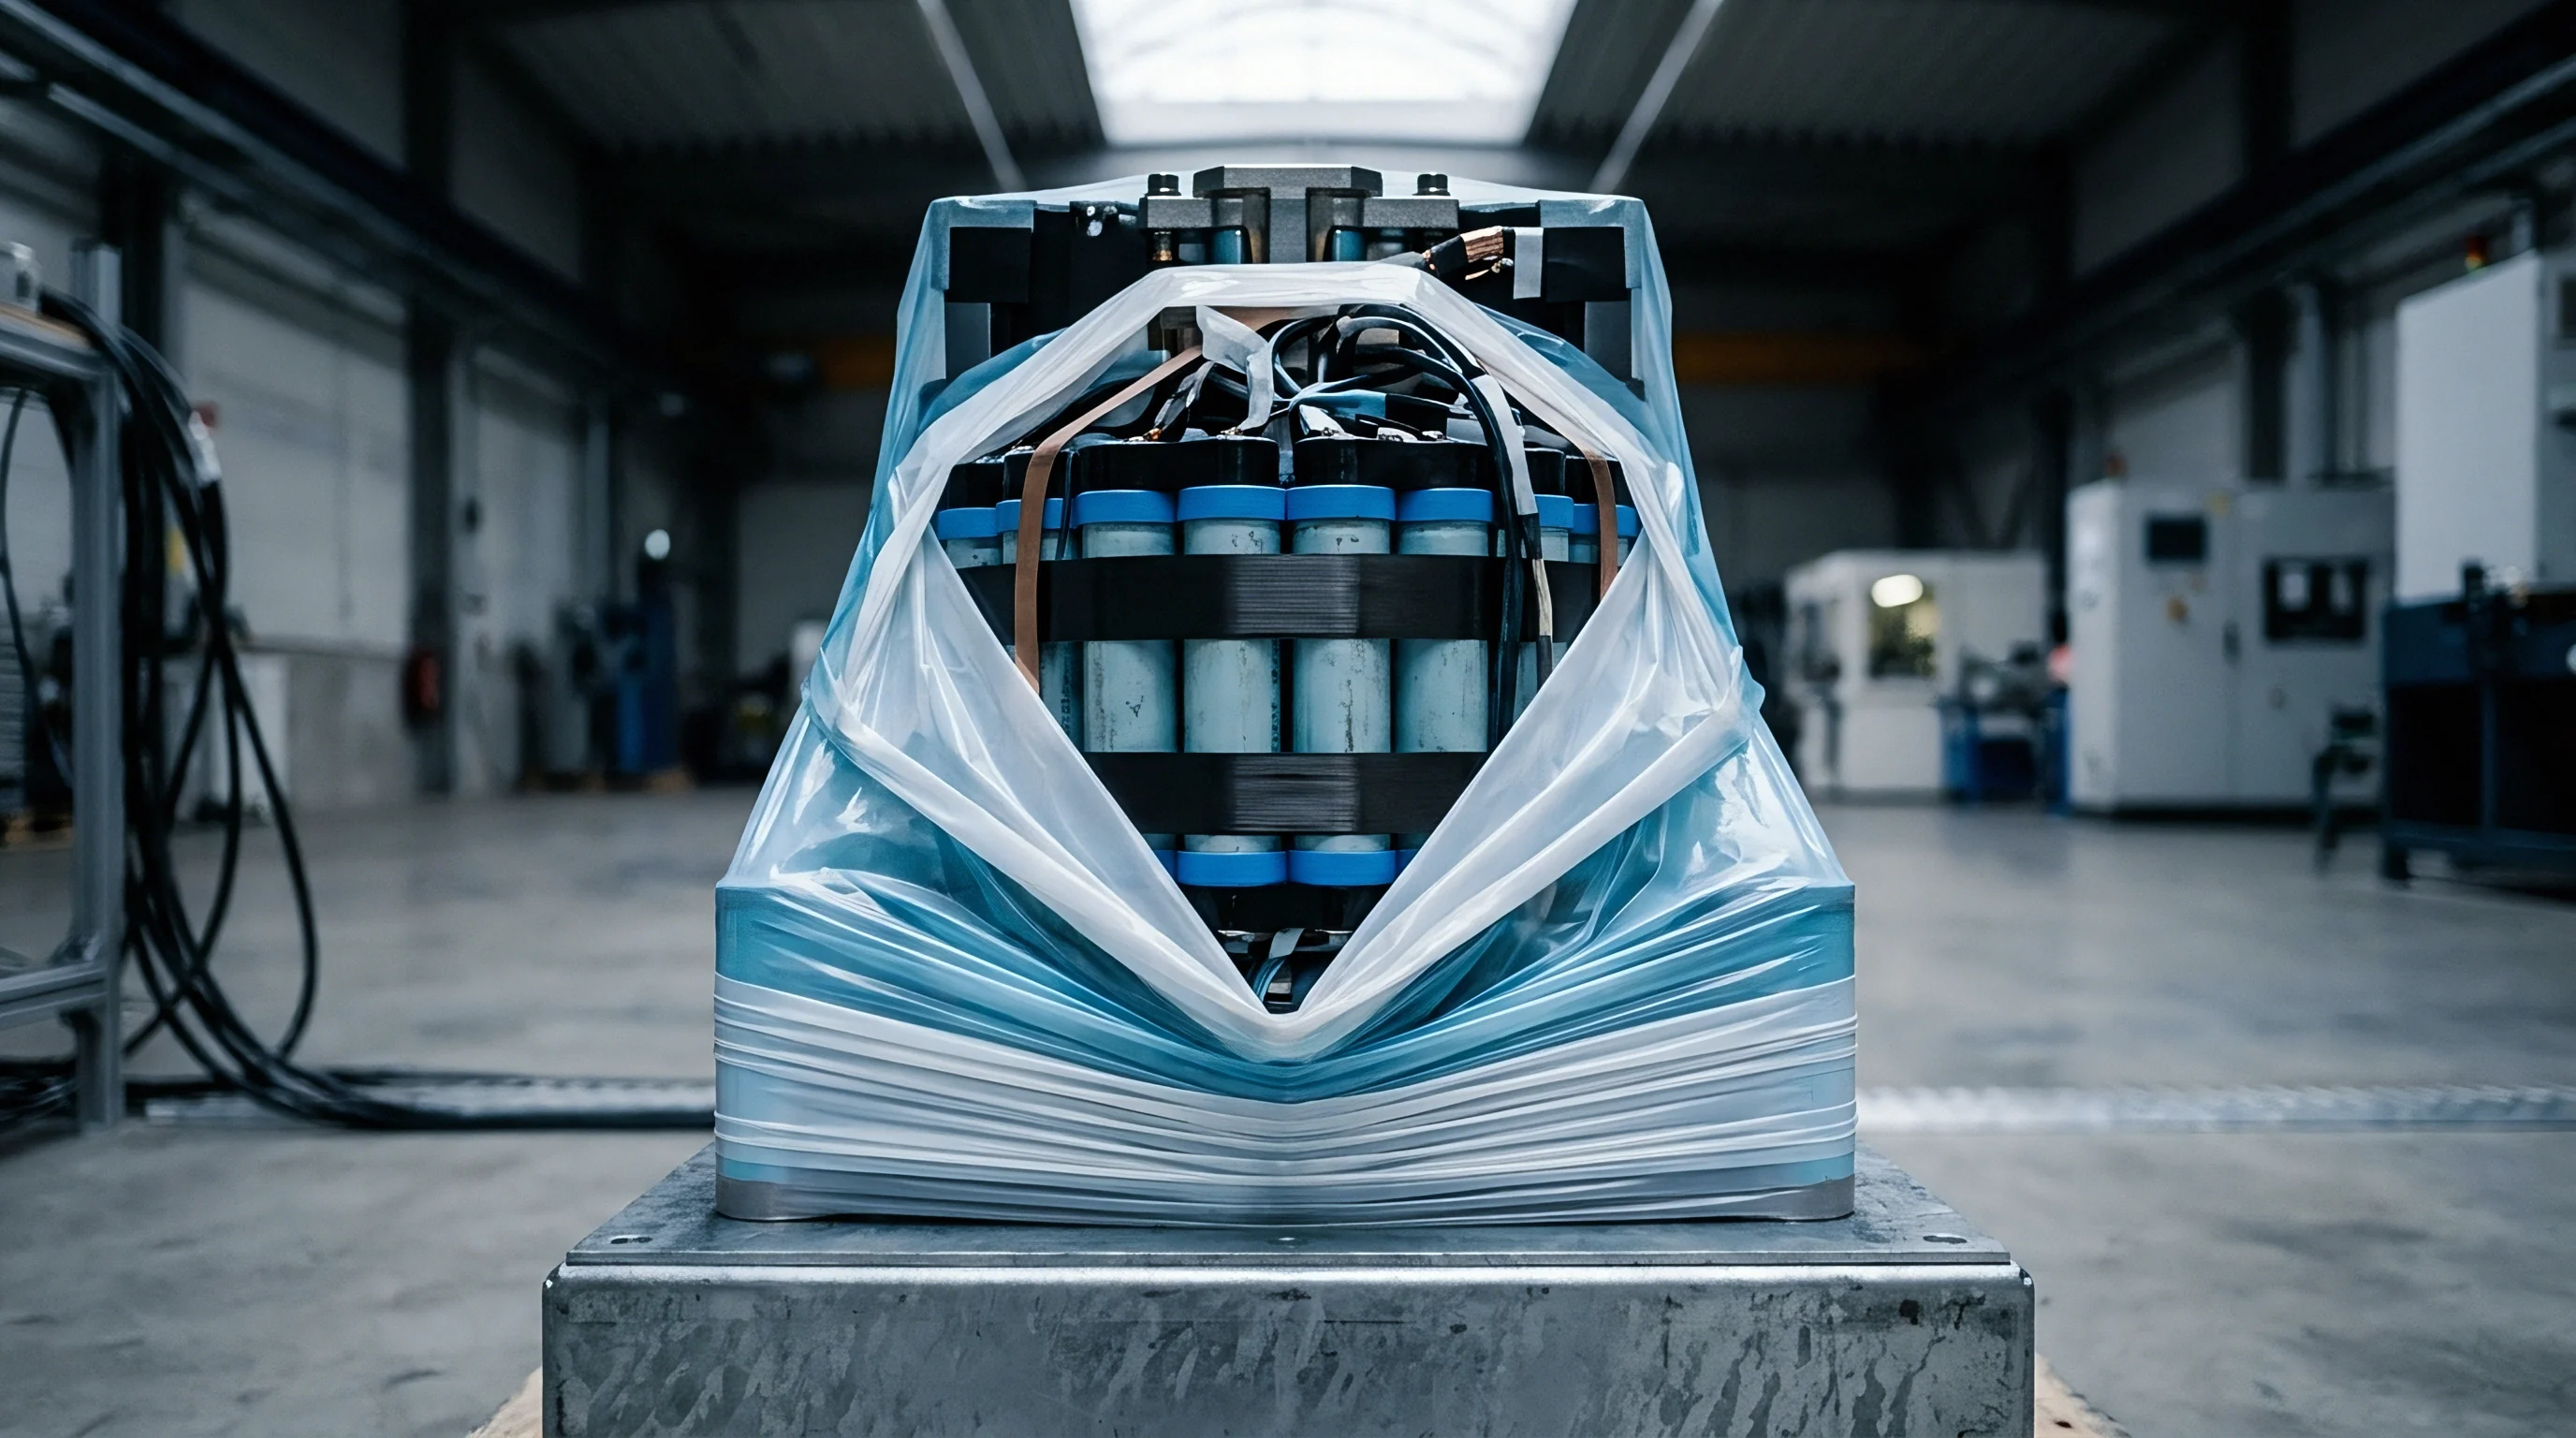
Physical modifications applied to secondary cells obscure original factory markings, manufacturing dates, and quality control tier stamps. The outer polymer insulation tube wraps the cylindrical or prismatic steel shell, protecting the cell body from electrical short circuits against adjacent aluminum busbars or frame structures. Secondary traders regularly strip off worn, scratched, or factory-graded original outer wraps and replace them with fresh heat-shrink tubing made of polyvinyl chloride or polyethylene terephthalate.
These replacement sleeves carry newly silk-screened logos, fake batch codes, elevated capacity ratings, and fraudulent safety certification marks designed to mimic prime tier-one manufacturing output.
Visual inspection under standard lighting often fails to expose a high-quality rewrap operation. Automated sleeving machines on secondary reconditioning lines apply shrink tubes with clean edge margins, uniform top ring compression, and precise bottom fold radii. Spotting sleeve replacement requires close examination under specialized lighting and magnification.
Original factory sleeves utilize distinct polymer formulations, specific wall thicknesses measured down to the micrometer, and characteristic thermal contraction seam lines. Secondary replacement sleeves frequently display minor thickness variations, altered surface gloss levels, or improper top insulation ring alignments where manual or semi-automated tools applied the replacement sleeve.
Ultraviolet fluorescence illumination highlights surface abrasion patterns, adhesive residues, and chemical washing traces hidden under new outer polymer sleeves. Primary production lines apply insulation tubes directly over clean, factory-formed metal casings inside cleanroom environments. When a secondary trader strips an old sleeve, solvent washing or mechanical scraping leaves microscopic scratch networks and chemical residues on the bare metal canister.
Under 365-nanometer ultraviolet light, these hidden surface artifacts fluoresce clearly through transparent or semi-transparent outer replacement sleeves, confirming that the cell underwent physical sleeve removal and surface cleaning post-manufacturing.
Laser matrix code inspection represents a primary defense against relabeled secondary cells. Tier-one cell manufacturers etch high-density two-dimensional matrix codes directly onto the metal casing before applying outer insulation tubes, or etch through the sleeve using precise UV laser marking systems. These codes encode the manufacturing plant identifier, production line number, exact date and time of formation, batch chemical lot, and internal factory grade sequence.
Secondary reconditioning operations attempt to erase or alter these markings ~ polishing the metal casing to buff out original laser etches, applying heavy opaque ink layers, or using low-power laser markers to burn new, falsified matrix codes over abraded surfaces.
Microscopic analysis of laser etch geometry reveals tampering with absolute clarity. Genuine factory laser markings present clean depth profiles, crisp edge definitions, and consistent oxidation colors within the etched micro-grooves. Buffed and re-etched surfaces show residual metal smoothing marks, altered wall profiles, uneven burn depths, and telltale heat-affected zones surrounding the alphanumeric characters.
Secondary operators who re-etch codes often alter manufacturing date digits to make aged warehouse stock appear as freshly produced current-year inventory, hiding several years of calendar aging and electrolyte degradation from unsuspecting buyers.
Terminal surface examination provides direct physical proof of prior cell usage, module assembly, or weld removal. Secondary cells salvaged from disassembled battery packs, electric vehicle test modules, or rejected energy storage strings carry residual weld artifacts on their positive and negative poles. Reconditioning workshops polish these terminal faces using rotary abrasive tools or precision milling cutters to erase fiber laser spot welds or ultrasonic nickel tab weld marks.
This machining leaves parallel micro-grooves, reduced terminal flange thicknesses, and subtle height variations across the pole faces that differ fundamentally from untouched, factory-fresh terminal surfaces.
Polished terminal welds introduce variable contact resistance across grey-market lots, pushing 1 kHz AC impedance standard deviations to three times the datasheet limit.
- Terminal surface machining traces manifest as non-concentric polishing lines, reduced pole height profiles, and microscopic copper or aluminum swirl patterns left by mechanical refinishing tools.
- Safety vent disk score line corrosion appears as localized oxidation, discoloration, or chemical etching along the thin pressure-relief metal diaphragm on the top cap.
- Insulation ring displacement reveals manual re-assembly through uneven washer margins, non-uniform adhesive overflow, or mismatched top disk diameter dimensions.
- Cannister midline swelling measures structural mechanical deformation caused by internal gas generation, electrode expansion, or elevated cell pressure during prior thermal excursions.
- Terminal flange discoloration indicates localized thermal spikes from excessive current draw, poor weld conductivity, or high-resistance electrical connections during previous operation.
Dimensional profiling using optical comparator systems or digital micrometer networks exposes structural physical changes associated with cell degradation and aging. Cylindrical cells subjected to high internal pressures or aggressive cycling undergo mechanical canister expansion. The outer diameter near the center of the cell body swells beyond original manufacturing drawing tolerances.
Prismatic cell bodies exhibit bulging along their broad side faces, expanding thickness dimensions by several tenths of a millimeter. While secondary traders use mechanical clamping jigs to flatten swollen prismatic cells before applying new sleeves, internal electrode lattice warping remains permanent, creating non-uniform internal pressure distributions once released from the jig.
Safety vent structures located on the top cap of cylindrical cells or between terminal poles on prismatic units represent sensitive physical indicators of operational stress. Factory vents consist of precisely scored thin metal diaphragms engineered to rupture at designated internal gas pressures, preventing explosive canister fragmentation during thermal events. Overcharge, high-temperature storage, or continuous parasitic electrolyte decomposition generates internal gas that bows the vent diaphragm outward.
Secondary sorters attempt to press bowed vents back into flat alignment using manual punch tools. Optical surface profilometry identifies this manual deformation by detecting micro-cracks, uneven surface curvature, and stress-softened metal regions along the score lines.
Standardized physical qualification mandates verifying dimensional integrity against original engineering drawings across sample populations drawn from incoming shipments. ISO 2859-1 normal inspection plans define single sampling tables based on Acceptable Quality Levels for visual and mechanical attributes. A rigorous quality control protocol sets zero-defect acceptance thresholds for physical rewrap indicators, altered laser matrix codes, terminal refacing marks, or vent distortion.
Uncovering even one rewrapped or re-etched unit within a statistically representative sample lot justifies rejecting the entire commercial shipment and initiating channel return procedures.
Scanning electron microscopy coupled with energy-dispersive X-ray spectroscopy offers definitive chemical analysis when non-destructive optical methods yield ambiguous results. Scanning the outer metal surface near an altered serial code reveals micro-structural deformation and localized thermal oxidation induced by secondary laser processing. Energy-dispersive X-ray spectroscopy identifies microscopic metallic contamination, trace polishing compound residues, non-standard sleeve polymer compositions, and alternative adhesive chemistry formulations that never exist on primary factory production lines.
Destructive teardowns of selected sample units validate physical findings observed on the exterior sleeve and terminals. Performing cell dissection inside an argon-filled glovebox prevents moisture and oxygen from reacting with air-sensitive electrode materials and liquid electrolyte components. Carefully unwinding or unstacking the internal jellyroll exposes active material distribution, separator condition, and current collector integrity.
Secondary cells often present distinct physical defects inside, including lithium metal plating along electrode edges, separator thermal shrinking or discoloration, dry un-wetted electrode zones, and localized current collector corrosion that no exterior visual touch-up can conceal.
UL 1642 section 13 mandates impact and crush testing without prior mechanical sleeve modification or altered insulation ring geometry.
Casing wall thickness measurement via high-frequency ultrasonic thickness gauges provides non-destructive detection of mechanical surface grinding. Secondary operators who sand metal casings to remove deep original laser etches or corrosion spots reduce structural wall thickness below safety thresholds. Thin shell walls lower the mechanical burst strength of cylindrical and prismatic containers, reducing their resistance to external physical impacts, side puncture risks, and internal pressure spikes.
A cell casing reduced from a nominal 0.50-millimeter wall thickness down to 0.41 millimeters poses an unacceptably high risk of structural failure during automated module assembly or pack vibration testing.
Traceability documentation cross-referencing must accompany physical cell inspection. Tier-one manufacturers maintain central database logs linking serial matrix codes to detailed formation data, lot chemistry records, and factory exit inspection results. Sourcing desks with direct access to manufacturer database validation portals can query incoming code strings against official factory production logs.
If a batch of delivered cells presents valid matrix codes that point to formation dates three years prior, or lists an original factory destination as a scrap handler rather than an authorized distributor, physical sleeve authenticity loses all relevance. The paperwork itself proves secondary channel intervention.
Handling and packaging materials furnish additional indirect evidence of cell origin and secondary market processing. Prime Grade A cells ship in specialized, anti-static, factory-sealed trays engineered specifically for automated robotic pickup. These trays carry high-temperature resistant lot tracking labels, factory seal tapes, and precise weight certifications.
Secondary traders routinely pack re-sorted and rewrapped cells in non-standard, generic molded pulp or expanded polystyrene trays that show signs of manual handling, incorrect pocket dimensions, missing anti-static coatings, or altered outer carton shipping marks. These packaging anomalies signal that the units passed through manual reconditioning channels after leaving the primary manufacturing facility.
If a secondary rewrapping facility absorbs significant tooling costs to replicate original factory sleeve textures, laser etch profiles, and tray specifications, visual anomalies vanish ~ making non-destructive structural inspection alone incapable of catching the relabeled lot.

Mismatch
Integrating secondary cells with wide performance variances into high-voltage, high-capacity battery packs triggers severe dynamic imbalance during real-world operation. A series string of cells behaves as a single continuous electrical circuit where every unit carries identical current during charge and discharge. Usable energy capacity across the entire series string is dictated entirely by the weakest cell in the chain.
When a pack contains cells with variable state of health, different initial capacities, and divergent direct current resistance values, individual units reach voltage operating limits at wildly different times, forcing the battery management system to cut off charge or discharge long before healthier cells exhaust their stored energy.
Discharge operations in an imbalanced series pack illustrate the severe capacity penalty imposed by cell mismatch. As the pack delivers current to the load, the cell with the lowest remaining capacity or highest direct current resistance experiences the fastest voltage drop. High internal resistance adds an additional I × RDC voltage drop to the electrochemical voltage decay curve.
This weak unit hits the lower discharge cutoff voltage limit while adjacent prime units retain twenty to thirty percent remaining capacity. The battery management system terminates pack discharge to protect the depleted cell from destructive reverse-voltage inversion, leaving substantial energy locked inside the remaining healthy cells and reducing total system efficiency.
Charge operations suffer from symmetric constraints that compound usable capacity loss over time. During constant-current charging, the weakest cell with elevated internal resistance displays accelerated voltage rise due to internal polarization (Vcell = Voc + I × RDC). This unit reaches the upper charge cutoff threshold first, prompting the battery management system to transition the entire pack prematurely from constant-current mode to constant-voltage taper mode, or to terminate charging outright.
Healthy cells within the string never achieve full state of charge, operating in a continuously undercharged state that reduces available pack energy and accelerates localized electrode degradation profiles.
Active and passive cell balancing systems attempt to mitigate voltage variance across series strings, but their correction rates remain constrained by thermal and physical hardware limits. Passive balancing dissipates excess energy from high-voltage cells through switched resistor networks, converting state-of-charge variance into waste heat inside the pack enclosure. Standard passive balancing topologies support bleed currents ranging from 30 to 200 milliamperes.
When secondary cell lots exhibit capacity variances of three to five ampere-hours or self-discharge rate spreads exceeding tens of millivolts per day, passive balancing circuits lack the current throughput necessary to realign the cells during brief charging windows.
Thermal stress generated by passive balancing networks introduces localized hot spots within the battery module enclosure. Switched resistor arrays operating continuously at maximum bleed current elevate localized circuit board temperatures to 60 or 70 degrees Celsius. This heat transfers directly into adjacent cells, accelerating their rate of calendar degradation and creating self-reinforcing thermal gradients across the pack structure.
Secondary cells positioned next to continuously firing balance resistors experience faster capacity fade and resistance growth, widening overall string imbalance and placing even greater workload on the balancing hardware in subsequent cycles.
String capacity equals the capacity of the lowest-performing cell multiplied by the series cell count minus cumulative balancing thermal losses.
Active balancing architectures utilize capacitive or inductive energy transfer circuits to move charge from high-voltage cells to low-voltage cells with significantly higher energy efficiency. Active balancing systems deliver equalization currents between 1 and 5 amperes, making them far more capable of managing secondary cell variance. This capability comes at high material cost, increased hardware complexity, and elevated component count.
Integrating complex active balancing circuitry to enable the use of low-cost secondary cells often consumes the entire financial savings achieved on the initial cell purchase, while introducing additional points of electrical failure within the management architecture.
Parallel string configurations present distinct physical hazards when secondary cells with divergent internal resistance values are connected directly across common busbars. Cells in parallel automatically equalize their terminal voltages. When two parallel cells exhibit different direct current resistances, current splits unevenly between them inversely proportional to their impedance (I1 × R1 = I2 × R2).
The low-resistance cell absorbs a disproportionate share of total charge or discharge current, operating at elevated continuous C-rates while the high-resistance secondary cell remains underutilized. This high current draw heats the low-resistance cell, lowering its internal resistance further and shifting an even greater share of system current through its structure.
- Screen every incoming cell batch for 1 kHz AC resistance and 10-second DC resistance, establishing strict statistical distribution cuts that reject units sitting outside a plus or minus three sigma window.
- Group accepted secondary units into tightly matched module sets using multi-parameter sorting algorithms that optimize for matched capacity, resistance, and self-discharge slope simultaneously.
- Derate maximum continuous charge and discharge current limits by thirty to fifty percent relative to nominal cell ratings to prevent high-resistance units from generating excessive localized heat.
- Implement multi-point thermal monitoring across module arrays, placing dedicated temperature sensors directly on high-resistance units and balancing resistor banks.
- Expand battery management system safety protection windows by tightening upper cell voltage cutoff limits and raising lower voltage thresholds to provide safety margins against dynamic cell divergence.
Delta-state-of-charge creep describes the progressive drift in relative state of charge between series cells over hundreds of un-balanced or inadequately balanced operational cycles. Variances in coulombic efficiency represent the primary driver of delta-SOC creep. If Cell A operates with a coulombic efficiency of 99.95 percent while Cell B operates with 99.70 percent due to secondary interfacial degradation, Cell B loses 0.25 percent more active lithium capacity on every cycle.
Over two hundred cycles, Cell B drifts fifty percent out of alignment relative to Cell A. No standard balancing system can correct for this magnitude of continuous efficiency loss without running balance cycles during long vehicle or equipment idle periods.
Thermal runaway risks scale non-linearly when secondary cells operate within imbalanced pack configurations. Accelerated degradation lowers the onset temperature for self-sustaining exothermic reactions (T1). Degraded secondary cells with active metal plating, compromised separators, or thick unstable solid electrolyte interphase layers enter thermal runaway at temperatures as low as 120 degrees Celsius, compared to 160 degrees Celsius or higher for prime units.
In an imbalanced pack where high internal resistance drives localized temperatures past safe limits, a degraded secondary cell acts as an internal thermal trigger, initiating violent thermal runaway that propagates across adjacent module cells.
Gas generation during high-stress operational cycles occurs far earlier in secondary cell populations. Parasitic decomposition of organic carbonate solvents generates volatile gases including carbon monoxide, carbon dioxide, methane, ethylene, and hydrogen. In sealed pouch or prismatic cell modules, gas accumulation increases internal stack pressure, physically deforming module restraint plates, misaligning thermal interface material contact points, and increasing interfacial thermal resistance between cell faces and cooling plates.
Reduced cooling effectiveness accelerates thermal buildup, pushing degraded cells rapidly toward catastrophic thermal breakdown.
Pack design safety margins must absorb structural uncertainties when secondary cells are used in grid storage or industrial equipment applications. System integrators building with Grade A prime cells routinely design thermal management systems around nominal heat generation figures published on official datasheets. When secondary cells are substituted, thermal management systems engineered for prime units become under-designed.
Cooling fans, liquid cold plate flow rates, and HVAC chiller capacities fall short of the thermal load generated by high-resistance cell arrays, forcing the system to operate under continuous thermal derating modes that severely limit deliverable pack power output.
Validating long-term string stability requires conducting multi-cell module degradation testing under accelerated life cycle conditions before committing capital to large-scale secondary pack production. Operating a twelve-cell series module through five hundred fast-charge, high-rate discharge cycles inside a environmental test chamber exposes real-world dynamic imbalance rates. Logging individual cell voltages, temperature profiles, dynamic resistance growth, and balance energy consumption throughout the test run provides the empirical baseline necessary to calculate realistic warranty exposure limits and system failure probabilities.
A simple operational rule dictates that battery pack life always tracks the degradation slope of its worst constituent cell regardless of management sophistication.

Margin
Initial cell purchase costs represent a fraction of the total levelized cost of energy storage over the operational lifespan of a commercial or industrial battery system. Secondary cells attract system integrators by offering upfront price discounts ranging from thirty to sixty percent compared to primary factory Grade A units. A system builder purchasing prismatic lithium iron phosphate cells might secure prime units at sixty-five dollars per kilowatt-hour, while secondary channel trading desks offer re-sorted or secondary inventory at thirty-eight dollars per kilowatt-hour.
On a one-megawatt-hour energy storage installation, this purchase price delta creates an apparent initial capital savings of twenty-seven thousand dollars.
Commercial risk models that evaluate initial purchase price without accounting for landed costs, operational degradation rates, and warranty exposure obscure true financial returns. Secondary cell purchases carry elevated freight compliance costs, higher incoming inspection burdens, reduced energy round-trip efficiency, and shortened cycle life expectancies that erode initial purchase discounts. A comprehensive financial analysis translates physical degradation kinetics into landed cost metrics, expressing performance variations as effective cost per delivered kilowatt-hour over total operational lifespan (LCOS = Total Landed Caπtal Expenditure / Total Lifetime Delivered Energy).
Incoming inspection and quality assurance testing represent substantial operational expenses when sourcing through secondary distribution channels. Accepting prime Grade A cells from primary tier-one manufacturers requires minimal incoming quality control sampling, as suppliers provide verified batch test certificates, traceable formation data, and contractual defect replacement guarantees. Sourcing secondary cells requires running one-hundred-percent testing protocols for capacity, internal resistance, self-discharge rate, and dimensional tolerances.
Operating multi-channel test cyclers, maintaining temperature-controlled test environments, employing qualification engineers, and scraping non-compliant units adds three to six dollars per kilowatt-hour directly to landed cell costs.
Dangerous goods transport regulations impose strict legal and financial liabilities on importers, freight forwarders, and system builders shipping lithium-ion secondary cells. International regulations governed by UN 3480 and UN 3481 mandate that all lithium cells shipped via air, sea, or ground must possess valid UN 38.3 test summary documentation proving successful completion of altitude simulation, thermal testing, vibration, shock, external short circuit, impact, overcharge, and forced discharge evaluations. Secondary cells that have undergone rewrapping, terminal machining, sleeve replacement, or internal structural degradation void their original factory UN 38.3 test certifications.
Shipping secondary cells carrying falsified or invalid UN 38.3 test summaries exposes buyers to severe regulatory penalties, cargo seizure, and catastrophic insurance invalidation. In the event of a thermal event during ocean freight transit or port terminal storage, marine insurance underwriters immediately demand verified UN 38.3 test documentation matching the exact laser matrix code prefixes and batch records of the shipped inventory. If investigation reveals that the cells were rewrapped secondary units carrying fraudulent documentation, insurance carriers deny coverage completely, leaving the importer fully liable for vessel damage, port cleanup expenses, and third-party loss claims.
| Cost Component / Financial Metric | Prime Tier-1 Sourcing | Authorized Secondary | Grey Market Secondary |
|---|---|---|---|
| Base Cell Purchase Price (per kWh) | $65.00 | $48.00 | $36.00 |
| Incoming Testing & QA Cost (per kWh) | $0.75 | $2.50 | $5.50 |
| Yield Loss & Scrap Rate Allocation | 0.2 % ($0.13) | 2.5 % ($1.20) | 8.5 % ($3.06) |
| Landed & Certified Cost (per kWh) | $68.50 | $55.00 | $49.50 |
| Expected Cycles to 80% SOH (1C/25°C) | 4,000 cycles | 2,400 cycles | 1,100 cycles |
| Lifetime Delivered Energy (MWh per kWh cap) | 3.40 MWh | 1.97 MWh | 0.86 MWh |
| Levelized Cost per Delivered kWh | $0.0201 / kWh | $0.0279 / kWh | $0.0575 / kWh |
Yield losses during incoming sorting eliminate projected profit margins on low-cost secondary shipments. When an importer purchases a container containing ten thousand secondary prismatic cells, incoming testing frequently identifies five to twelve percent of the lot as non-compliant due to low capacity, high internal resistance, severe self-discharge, or mechanical swelling. Secondary trading houses rarely honor defect return policies or require complex, costly overseas return freight arrangements that make returning defective units financially unfeasible.
The buyer absorbs the full cost of rejected units, amortizing the financial loss across the remaining usable cells and driving up effective landed unit costs.
Request for Quotation (RFQ) documentation and cell purchase agreements must contain precise technical specifications and legal enforcement mechanisms to protect buyers against secondary cell substitution. Standard generic contracts specifying nominal voltage, physical dimensions, and basic capacity figures leave buyers vulnerable to relabeled lower-tier inventory. A bulletproof purchase specification defines exact test conditions, acceptable statistical distributions, and legal liability chains down to the individual serial matrix code level.
- Unambiguous capacity test criteria defining exact discharge current rates, upper and lower voltage cutoffs, rest periods, and ambient reference temperatures stabilized at twenty-five degrees Celsius.
- Direct current internal resistance limits specifying maximum acceptable ten-second pulse resistance values (RDC) alongside traditional 1 kHz AC resistance limits (RAC).
- Statistical lot distribution tolerances mandating that three-sigma capacity and impedance distributions fall within strictly defined band limits, with clear batch rejection rights if standard deviations exceed specifications.
- Traceability requirements obligating the seller to provide full factory formation logs, batch material chemical data, and original UN 38.3 test summary documents traceable to the manufacturer matrix code prefix.
- Independent laboratory arbitration clauses establishing that designated certified testing facilities will resolve technical disputes using agreed-upon electrochemical test protocols.
Warranty exposure calculations highlight the severe long-term financial liabilities generated by integrating secondary cells into commercial products. System integrators selling energy storage units or industrial battery packs typically issue three-to-ten-year performance warranties guaranteeing minimum deliverable capacity levels. Prime Grade A cells follow predictable degradation curves, allowing actuary teams to model warranty reserve funds accurately at one to three percent of total pack value.
Secondary cells exhibit unpredictable degradation trajectories, premature knee-point transitions, and elevated field failure rates.
Field failures of secondary cells trigger catastrophic warranty costs that far outweigh initial cell purchase savings. Replacing a failed battery module inside a field-deployed grid storage system requires dispatching certified service technicians, paying specialized dangerous goods transport fees, replacing ruined adjacent modules, and absorbing customer downtime non-performance penalties. A single field service incident can cost thousands of dollars, completely wiping out the initial capital savings achieved across an entire system build using discounted secondary cells.
Levelized cost of storage calculations clearly demonstrate the economic superiority of high-grade prime cells over lifetime system operations. A prime cell delivering four thousand cycles to eighty percent state of health at sixty-eight dollars landed cost per kilowatt-hour yields a levelized energy cost of approximately two cents per delivered kilowatt-hour. A secondary cell purchased at thirty-six dollars per kilowatt-hour that hits a degradation knee point at eleven hundred cycles yields an effective levelized energy cost exceeding five and a half cents per delivered kilowatt-hour.
The apparent upfront bargain produces nearly triple the long-term energy cost.
System integrators building for low-duty, short-life, or low-power applications can utilize secondary cells successfully if they implement strict incoming qualification, rigorous cell matching, and derated operational boundaries. Sourcing secondary cells safely requires treating the procurement process as an engineering qualification challenge rather than a simple commercial price negotiation. System builders who build sophisticated incoming inspection lines, master statistical binning logic, and design conservative thermal management architectures can successfully harvest secondary market price discounts while constraining operational and safety liabilities.
A standard legal purchase clause mandates that any cell displaying abraded laser matrix codes, non-original replacement insulation sleeves, or unverified UN 38.3 paperwork triggers immediate batch rejection and returns the entire shipment liability directly to the seller.