Hard Carbon Anode Precursor Thermal Processing and Structural Interlayer Spacing
Thermal processing of hard carbon precursors regulates d002 interlayer spacing and closed microporosity to optimize sodium storage capacity and coulombic efficiency.

Precursor
Raw material selection dictates the architecture of non-graphitizable carbon materials used in sodium-ion cell anodes. Unlike graphite anodes, where petroleum coke or natural flake graphite provides predictable crystalline domains, hard carbon synthesis relies on precursor polymers that resist ordering during high-temperature thermal processing. Chemical composition, functional group density, and cross-linking behavior determine whether the pyrolyzed matrix achieves the structural interlayer spacing required for fast sodium cation insertion.
Synthetic resins and bio-based polymers serve as the main industrial feedstocks, each presenting distinct thermal decomposition behaviors, impurity profiles, and yield economics.
Fluctuating oxygen content across precursor harvest batches alters cross-linking density during low-temperature air stabilization. Chemical structures rich in hydroxyl, carboxyl, and ether bridges promote thermosetting behavior during pyrolysis. These oxygenated cross-links prevent aromatic carbon fragments from aligning into parallel graphene sheets, preserving a turbostratic architecture that resists graphitization even at temperatures above 1300 °C. Synthetic polymers such as phenolic resins supply uniform molecular building blocks with high purity, whereas bio-based precursors like coconut shells, hardwood lignins, and agricultural wastes introduce structural variances that require strict incoming feedstock qualification.
Biomass Feedstocks and Polymeric Resins
Coconut shells, hardwood lignins, and agricultural wastes supply high-carbon structures with inherently oxygen-rich backbones. Coconut shell precursors have dense cellular walls that convert into high-purity hard carbon with high tap density after thermal carbonization. Hardwood lignins contain complex phenylpropanoid networks that yield highly disordered turbostratic domains.
Bio-based feeds exhibit intrinsic porosity that requires processing to eliminate open surface macropores, which would otherwise reduce initial coulombic efficiency during early cell cycling.
Synthetic phenolic resins offer repeatable cross-linked polymer networks with negligible inorganic ash content. Polyacrylonitrile and furfural-based resins allow precise tuning of thermosetting characteristics before carbonization. This synthetic route bypasses natural variations in precursor oxygen content, yielding consistent structural interlayer spacing across production runs.
Higher procurement costs for phenolic resins restrict their economic fit to specialized sodium-ion applications where batch-to-batch repeatability matters more than raw material cost.

Chemical Heteroatoms and Cross-Linking Density
Oxygen, nitrogen, and sulfur incorporated within raw organic molecules establish rigid three-dimensional bridges during thermal treatment. High cross-linking density prevents precursor melting, holding an isotropic disordered state that stops graphene layers from collapsing into dense graphitic stacks. Ash contents dictate gasification rates.
Precursors with low initial oxygen levels tend to undergo thermoplastic melting, forming aligned graphitic domains that limit sodium storage to low capacities.
Cross-linking prevents structural collapse during pyrolysis. Chemical steps like air stabilization or acid washing add extra oxygenated functional groups into low-oxygen pitch precursors. Nitrogen doping via melamine or urea addition alters local electron density, accelerating sodium ion adsorption kinetics along carbon sheet edges.
The balance between native and introduced heteroatoms governs the proportion of open surface defects relative to internal closed nano-voids formed after thermal decomposition.
Higher precursor oxygen content increases cross-linking density during stabilization, yielding rigid turbostratic domains that resist graphitization at high carbonization temperatures.

Contaminant Profiles and Inorganic Ash
Metallic impurities such as iron, silicon, calcium, and sodium disrupt lattice formation and trigger parasitic chemical reactions during cell cycling. Inorganic ash constituents in biomass feedstocks catalyze localized graphitization during high-temperature pyrolysis, forming ordered graphitic pockets that narrow interlayer spacing. Heavy metal ions embedded within the carbon matrix can dissolve into liquid electrolytes, degrading the solid electrolyte interphase and promoting metallic dendrite formation over cycle life.
Raw material specifications set strict threshold limits for incoming precursors to prevent operational problems downstream. Processing lines use chemical washing steps to reduce inherent mineral content prior to thermal treatment.
- Biomass Inorganic Ash creates localized catalytic graphitization sites that shrink interlayer spacing below threshold requirements.
- High Volatile Content reduces solid carbon yield during pyrolysis and generates excessive volatile gas volumes that burden kiln scrubbing systems.
- Heterogeneous Oxygen Distribution leads to non-uniform cross-linking density, creating mixed regions of graphitic and disordered carbon architectures.
- Trace Transition Metals catalyze liquid electrolyte breakdown, increasing irreversible capacity loss during early formation cycles.
Lot-to-lot variations in initial coulombic efficiency stem from seasonal fluctuations in raw material moisture and oxygen content or uncalibrated kiln thermal profiles.
Pyrolysis
Controlled thermal decomposition converts organic polymer networks into rigid, non-graphitic carbon skeletons. The pyrolysis sequence involves low-temperature stabilization in an oxidizing atmosphere, high-temperature carbonization under inert gas flow, and optional surface passivation through chemical vapor deposition. Each thermal phase alters the structural interlayer spacing, crystallite dimensions, and closed pore volume of the hard carbon anode.
Furnace atmosphere purity, heating ramp rates, and peak soak duration dictate the physical parameters that govern sodium cation storage.
Thermal processing parameters control the balance between open surface area and internal nano-void development. Devolatilization of low-molecular-weight organic species forms microscopic pathways that either stay open or collapse into closed micro-cavities depending on the heating profile. Pure argon purges eliminate oxygen.
Precise control over peak carbonization temperature allows tuning of the interlayer d002 spacing between 0.360 nanometers and 0.390 nanometers, optimized for sodium transport.
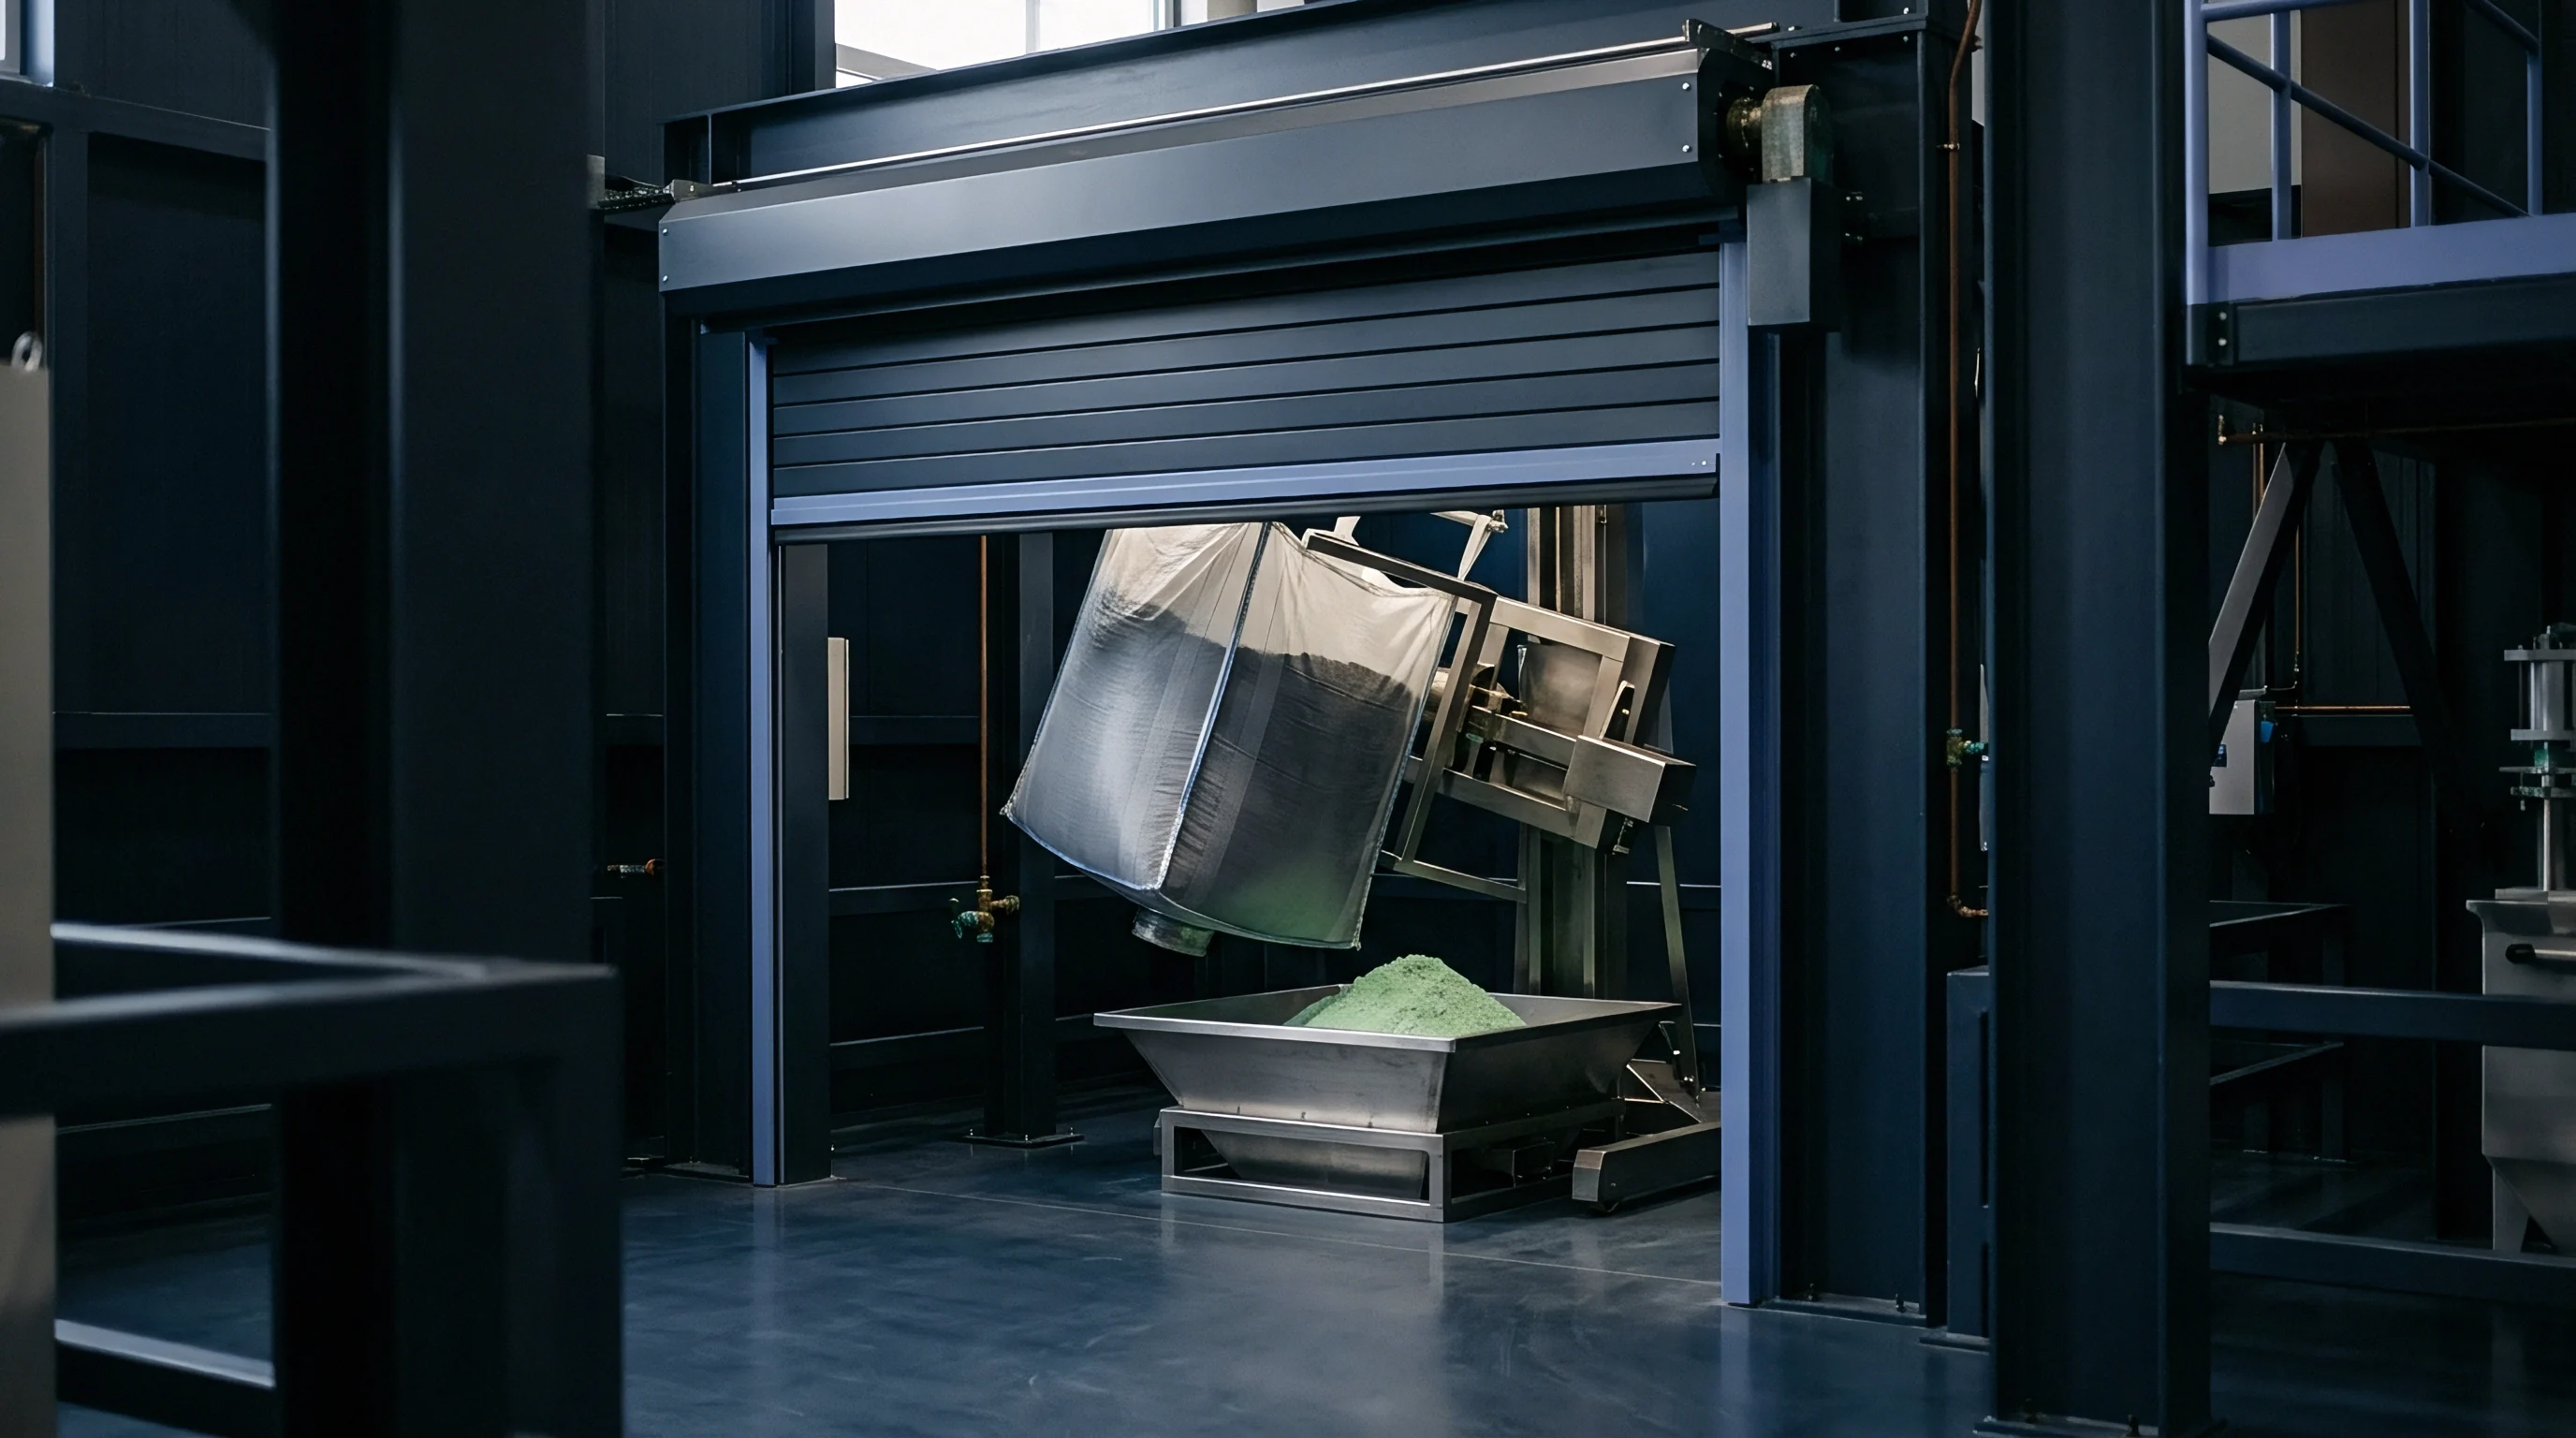
Stabilization Mechanics and Low-Temperature Oxidation
Heating organic raw materials in air at 200 °C to 350 °C induces oxygen cross-linking that prevents melting during subsequent inert processing. Air stabilization introduces oxygen bridges, such as ether and carbonyl linkages, across polymer chains. These bonds convert thermoplastic precursors into non-melting thermosetting matrices.
Without stabilization, coal or petroleum pitches fuse into liquid mesophase during carbonization, producing ordered graphite rather than disordered hard carbon.
Stabilization residence times range from two to six hours depending on precursor particle size and oxygen diffusion depth. Excessive oxidation causes high surface defect densities that lower initial coulombic efficiency, while insufficient stabilization leads to particle agglomeration and localized graphitization. Process gas oxygen concentration must be tightly regulated within continuous rotary kilns to maintain uniform cross-linking kinetics throughout the material flow.

High-Temperature Carbonization and Off-Gas Kinetics
Elevating furnace temperatures from 900 °C to 1400 °C under nitrogen or argon purges drives out volatile oxygenated compounds, tars, and light hydrocarbons. Thermal soak time drives crystallite growth. Releasing water vapor, carbon monoxide, carbon dioxide, and methane during devolatilization generates a porous carbon network.
As carbonization temperature rises toward 1300 °C, small graphene fragments coalesce into short-range stacked turbostratic domains, and internal closed nano-voids form between misaligned stacks.
- Pre-bake incoming stabilization mass in continuous rotary dryers at 150 °C for two hours to reduce surface moisture contamination below 0.5 weight percent.
- Transfer precursor mass into an inert rotary kiln under high-purity argon purging with oxygen concentrations maintained below 5 parts per million.
- Ramp furnace temperature at 5 °C per minute to an intermediate devolatilization dwell stage at 600 °C for ninety minutes to release primary volatile organic species.
- Increase furnace temperature at 3 °C per minute to peak carbonization temperature of 1250 °C and hold for a four-hour thermal soak period.
- Cool pyrolyzed carbon powder under continuous inert gas flow to temperatures below 80 °C before discharging into sealed handling bins.
Pushing peak temperature beyond 1400 °C triggers structural realignment, shrinking closed nano-voids and driving interlayer spacing down toward the graphitic limit of 0.335 nanometers. Thermal processing between 1200 °C and 1300 °C maximizes structural interlayer spacing while minimizing active surface defect density.
| Processing Phase | Temperature Range (°C) | Chamber Atmosphere | Solid Yield (%) | Interlayer Spacing d002 (nm) | BET Surface Area (m²/g) |
|---|---|---|---|---|---|
| Air Stabilization | 200 ~ 320 | Compressed Air | 88 ~ 95 | Unstructured | 12 ~ 25 |
| Low Carbonization | 600 ~ 900 | Nitrogen (>99.99%) | 45 ~ 58 | 0.395 ~ 0.410 | 250 ~ 450 |
| High Carbonization | 1100 ~ 1350 | Argon (>99.999%) | 32 ~ 42 | 0.365 ~ 0.382 | 2.5 ~ 8.0 |
| CVD Passivation | 700 ~ 850 | Methane / Nitrogen | 96 ~ 98 | 0.365 ~ 0.380 | 0.8 ~ 2.0 |
| Data measured using wide-angle X-ray diffraction and nitrogen physisorption on coconut shell precursor batches. | |||||
Surface Passivation and Chemical Vapor Deposition
Flowing hydrocarbon gases like methane or toluene over calcined carbon granules at 700 °C seals surface macro-pores and eliminates active surface defects. Chemical vapor deposition deposits a thin layer of disordered soft carbon over the hard carbon core, passivating surface sites that would otherwise react with liquid electrolyte during initial formation cycles. Pore sizes shift during activation, and toluene washing removes residual volatile tars.
This secondary coating process reduces Brunauer-Emmett-Teller surface area from over 10 m²/g down to under 2 m²/g without sacrificing internal closed nano-void volume. Lower surface area directly suppresses solid electrolyte interphase consumption of active sodium cations, pushing initial coulombic efficiency above 88 percent. Deposition duration and precursor gas concentration dictate soft carbon shell thickness, balancing surface passivation against sodium migration resistance across the core-shell interface.
Pyrolysis of coconut shell precursor at 1250 °C under pure argon yields a d002 interlayer spacing of 0.374 nm with an initial coulombic efficiency of 86.4 percent in sodium half-cells.
Inadequate thermal soak times during final high-temperature carbonization leave unreacted heteroatom functional groups that degrade liquid electrolyte over time, causing severe gas generation and cell swelling in pouch formats.


Spacing
The physical separation between parallel graphene sheets defines the thermodynamic and kinetic parameters for sodium ion intercalation. Graphite exhibits an interlayer spacing of 0.335 nanometers, which cannot accommodate solvated or un-solvated sodium cations (ionic radius of 0.102 nanometers) without severe volume expansion and structural breakdown. Non-graphitizable hard carbons maintain an expanded interlayer d002 spacing ranging from 0.360 nanometers to 0.400 nanometers, creating robust structural channels for reversible sodium cation migration.
Expanding interlayer spacing from 0.365 nanometers to 0.382 nanometers lowers the kinetic barrier for sodium cation transport across domain boundaries by 14 kilojoules per mole. Expanding the lattice beyond 0.370 nanometers shifts sodium insertion potentials closer to 0.1 volts versus sodium metal, producing flat, low-potential discharge plateaus that maximize cell energy density. Tailoring structural interlayer spacing requires aligning precursor cross-linking density with peak pyrolysis thermal profiles.

X-Ray Diffraction Peak Deconvolution and Bragg Law Calculations
Wide-angle X-ray scattering profile fitting resolves overlapping crystalline reflections to extract lattice parameters. X-ray diffraction patterns of hard carbon display broad, low-intensity 002 diffraction peaks near 24 degrees two-theta when measured using copper K-alpha radiation. Applying Bragg’s law to the deconvoluted 002 peak position yields the average interlayer distance d002 across stacked turbostratic carbon sheets.
Peak deconvolution requires separating the sharp graphitic 002 component from broader amorphous carbon halo signals using Gaussian-Lorentzian cross-product functions. Asymmetric peak broadening indicates a distribution of interlayer spacings across distinct structural domains in the powder sample. Crystallite height along the c-axis (Lc) is derived from full-width at half-maximum analysis using the Scherrer equation with a shape factor K of 0.89.
Hard carbons with optimal sodium storage typically show Lc values between 1.2 nanometers and 2.0 nanometers, corresponding to stacked arrays of three to six graphene layers.
| Pyrolysis Temp (°C) | d002 Spacing (nm) | Lc Crystallite Height (nm) | La Grain Size (nm) | Na Intercalation Energy (eV) |
|---|---|---|---|---|
| 1000 | 0.388 | 1.15 | 1.85 | -0.12 |
| 1150 | 0.378 | 1.38 | 2.10 | -0.28 |
| 1250 | 0.372 | 1.62 | 2.45 | -0.35 |
| 1350 | 0.364 | 1.95 | 2.90 | -0.18 |
| 1500 | 0.352 | 2.60 | 3.80 | +0.15 |
Why Does Thermal Soak Time Shift Interlayer Spacing?
Holding furnace hot zones at peak processing temperatures forces localized structural rearrangement in distorted aromatic domains. Extended thermal soak times supply the kinetic energy needed for mobile carbon atoms to migrate and align, causing adjacent, distorted graphene sheets to flatten and draw closer together. Graphite lattices resist sodium insertion.
Prolonged thermal exposure decreases the average interlayer distance d002 toward graphitic values while increasing crystallite height Lc.
Soak durations must balance crystal defect annealing against structural shrinkage. A two-hour dwell at 1250 °C removes unstable edge defects while keeping d002 spacing above 0.370 nanometers. Extending that dwell to twelve hours reduces d002 spacing to 0.358 nanometers, narrowing sodium insertion channels and increasing kinetic polarization during high-rate discharge.
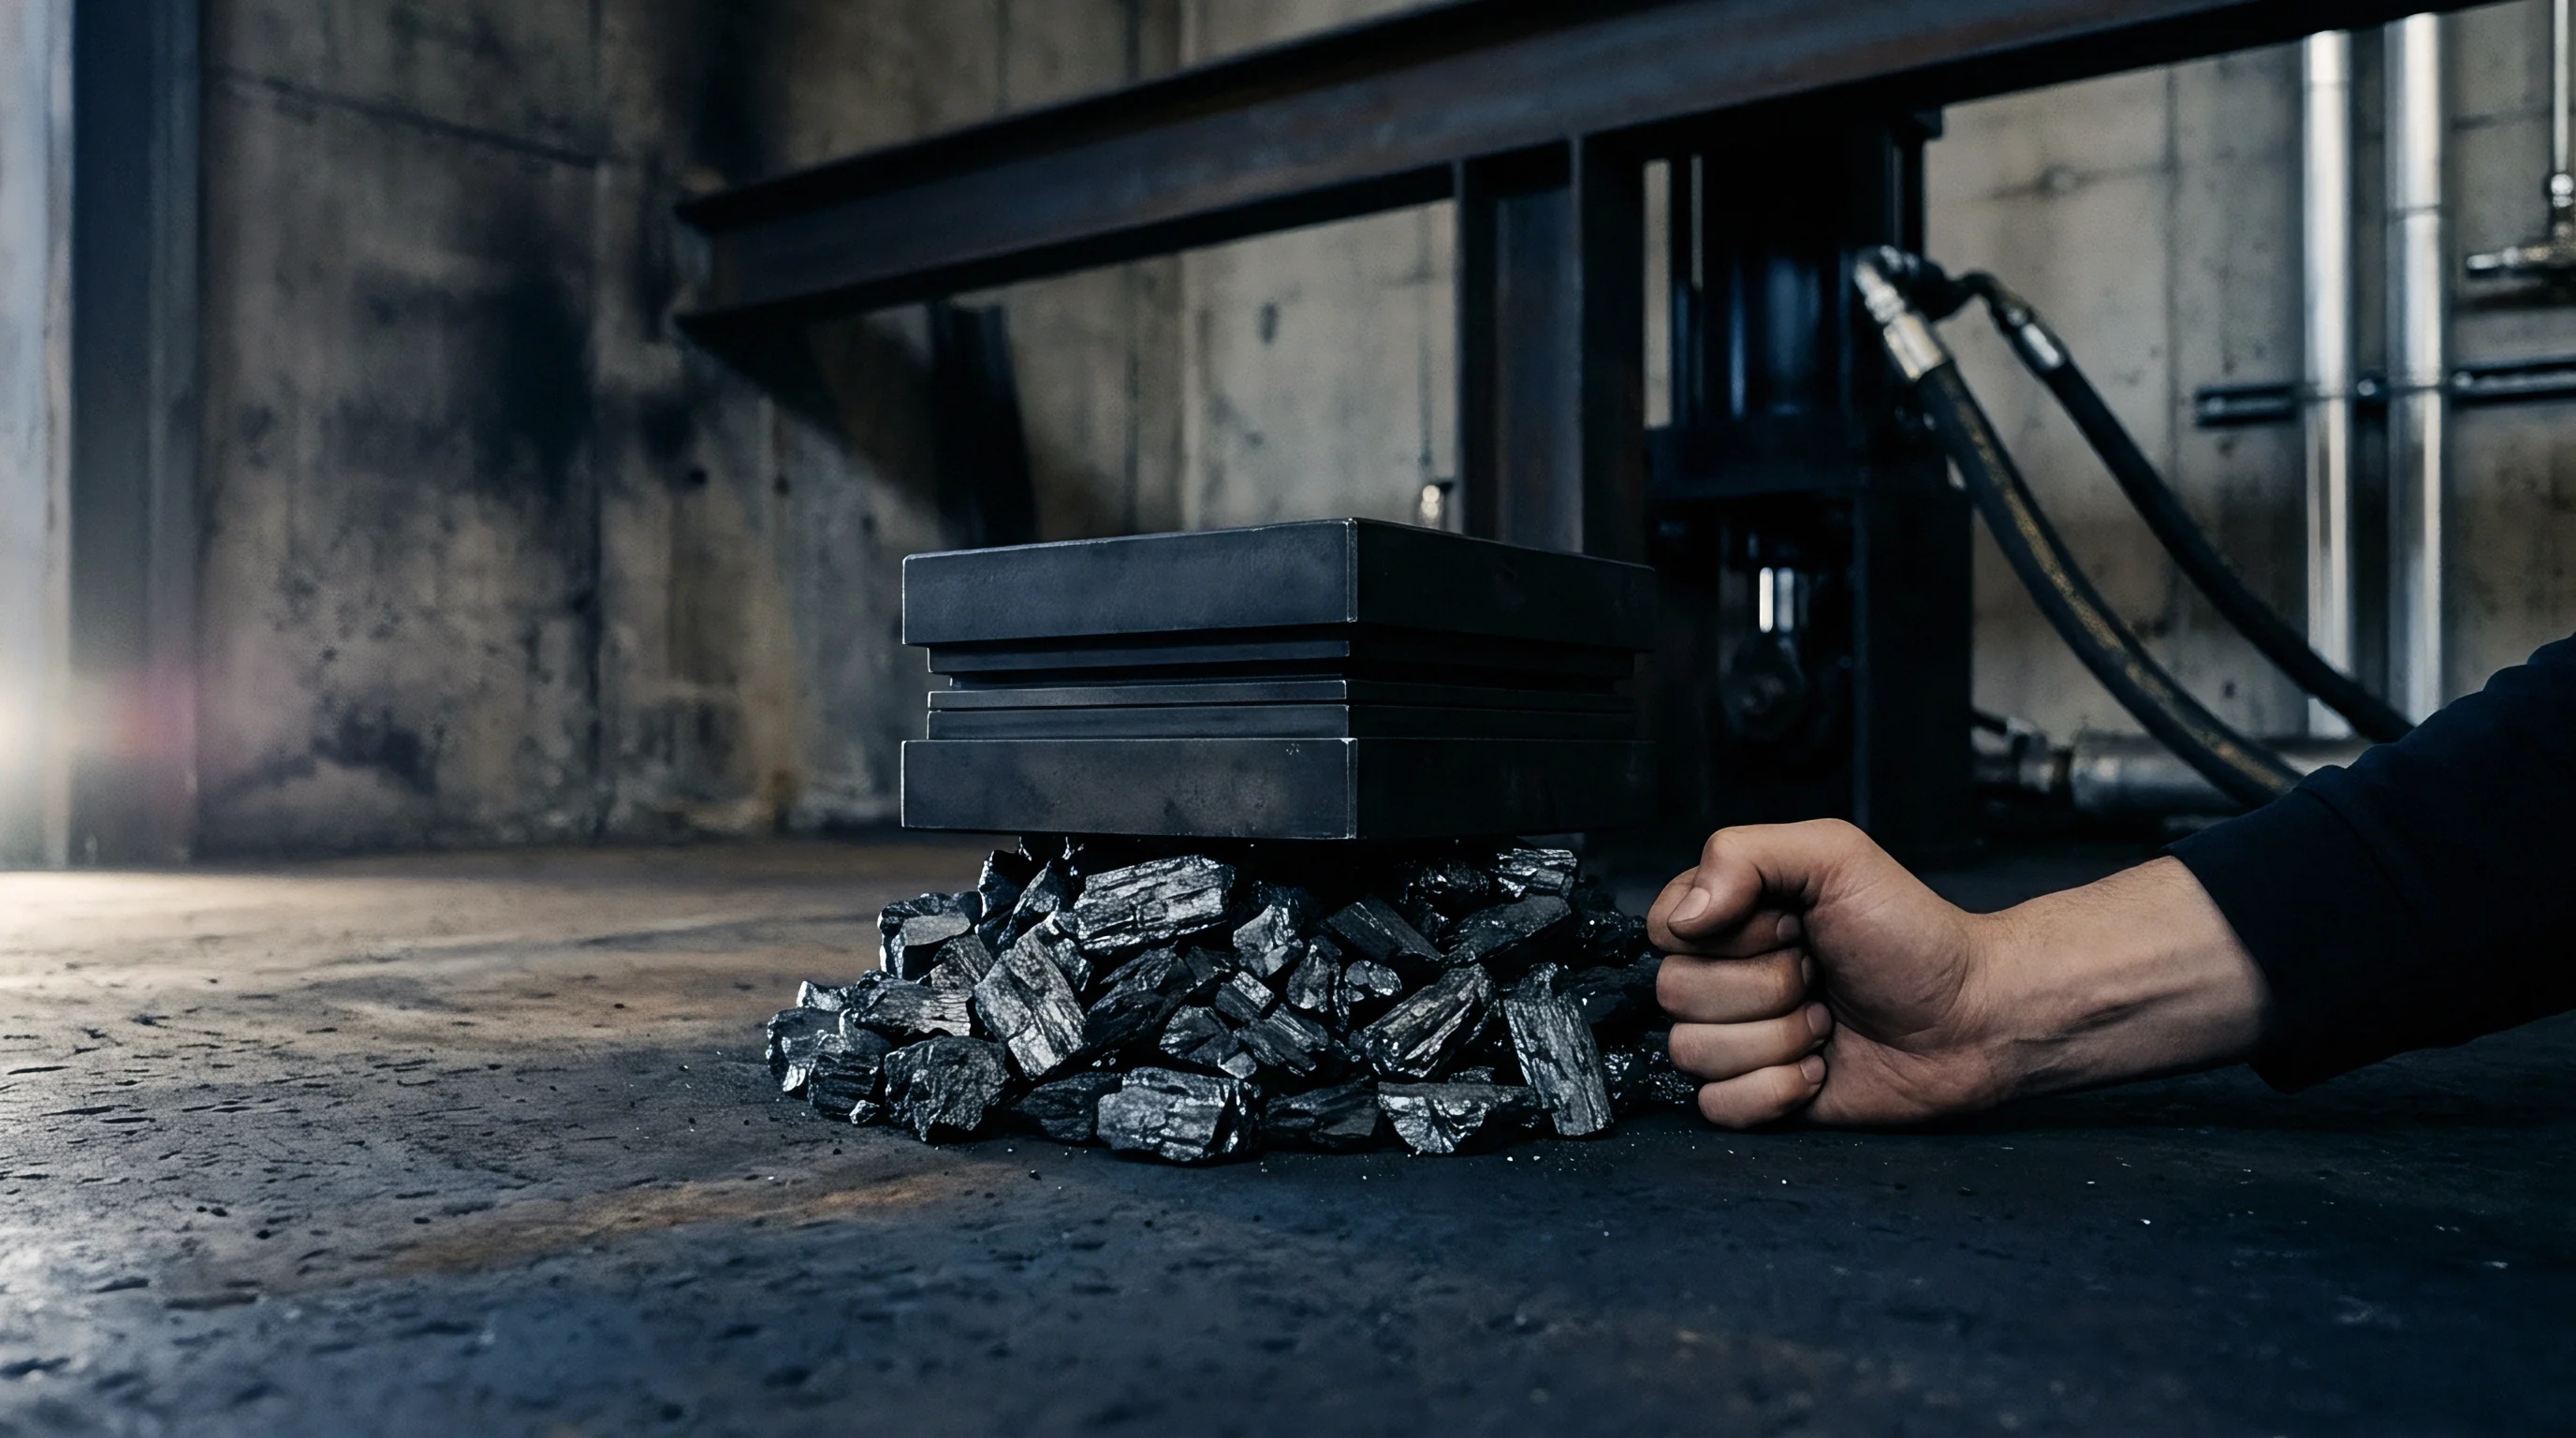
Turbostratic Lattice Expansion Mechanics
Randomly oriented graphene fragments form short-range stacked crystallites separated by disordered regions that resist parallel alignment. Structural curvature caused by pentagonal or heptagonal ring defects in the graphene networks forces adjacent sheets apart, preventing close planar packing. Interlayer expansion arises from electrostatic repulsion between unorganized pi-electron clouds and steric hindrance from cross-linked carbon chains anchored at domain boundaries.
The turbostratic structure resists parallel consolidation because cross-linking carbon atoms act as rigid structural pillars. These pillars lock adjacent graphene sheets into misaligned, rotated orientations without long-range order along the c-axis. Inserting sodium cations into expanded turbostratic spaces induces minimal lattice strain compared to graphite, preventing structural exfoliation and supporting long cycle life in non-aqueous electrolytes.
Whether mechanical strain from repeated sodium ion insertion into expanded turbostratic layers permanently degrades d002 lattice dimensions over three thousand deep cycles remains an active area of investigation.


Defect
Structural irregularities within hard carbon crystallites govern irreversible capacity losses and mass transfer rates. Carbon lattice architectures contain point defects, edge vacancies, grain boundaries, and internal closed nano-voids formed during thermal devolatilization. Characterizing open surface defects versus enclosed micropores demands orthogonal measurement techniques, since each defect type alters sodium storage through a different electrochemical mechanism.
Minimizing surface defect area while maximizing closed nano-void volume is the main goal in precursor processing.
Fitting Guinier-Porod models to small-angle scattering curves of hard carbon powders isolates closed nano-void radii from residual surface roughness. Uncoated surfaces consume active sodium. Open surface defects adsorb sodium ions during the initial charge cycle, forming irreversible chemical bonds with electrolyte decomposition products.
Closed nano-voids provide non-interacting cavity volume where sodium cations condense into quasi-metallic clusters during low-potential plateau operation, giving reversible capacity without triggering electrolyte breakdown.

Raman Spectroscopy and Graphitization Ratios
Laser excitation at 532 nanometers produces vibrational spectra that reveal the ratio of disordered edge sites to ordered sp2 networks. The Raman spectrum of hard carbon shows two main features: the D-band centered near 1350 cm⁻¹, corresponding to sp3 structural defects and disordered domain boundaries, and the G-band near 1580 cm⁻¹, representing in-plane stretching of sp2 hybridized carbon-carbon bonds.
Deconvoluting Raman spectra using Gaussian spectral fitting yields the integrated intensity ratio ID/IG. Hard carbon anodes with balanced performance show ID/IG ratios between 0.95 and 1.25. High ID/IG values correlate with elevated surface defect densities that degrade initial coulombic efficiency.
Thermal carbonization above 1200 °C systematically lowers the ID/IG ratio by annealing point defects, sharpening the G-band reflection, and reducing unorganized edge carbon sites.

Closed Nano-Void Measurements via Small-Angle Scattering
X-ray and neutron scattering profiles below two degrees two-theta quantify internal micropore distributions inaccessible to nitrogen gas adsorption. Small-angle X-ray scattering measures electron density fluctuations between solid carbon walls and enclosed empty cavities, yielding pore radius distributions, pore surface area, and total enclosed pore volume.
Heteroatom doping dictates charge transfer. Hard carbon formulations optimized for sodium storage have closed pore volumes ranging from 0.12 cm³/g to 0.22 cm³/g with mean pore radii between 0.8 nanometers and 1.5 nanometers. Small-angle neutron scattering complements X-ray techniques by using contrast variation with deuterated solvents to isolate fully enclosed internal voids from open surface pores accessible to liquid electrolyte.

Surface Area Reduction and Passivation Audits
Brunauer-Emmett-Teller gas physisorption testing verifies open surface reduction achieved during secondary coating steps. Nitrogen gas physisorption at liquid nitrogen temperatures measures exposed surface area and open pore distributions across the micro- and meso-pore regimes. Precursors carbonized without surface passivation frequently demonstrate high BET surface areas exceeding 100 m²/g due to open devolatilization channels.
Process engineering audits evaluate hard carbon powders using a strict sequence of analytical checks to confirm structural suitability before slurry compounding.
- BET Surface Area Measurement confirms open surface area remains below 2.0 m²/g to limit first-cycle solid electrolyte interphase consumption.
- Raman ID/IG Ratio Analysis verifies structural disorder levels and confirms adequate surface defect annealing following thermal carbonization.
- SAXS Pore Volume Quantification establishes that internal closed nano-void volume exceeds 0.15 cm³/g for lower-plateau capacity optimization.
- True Density Helium Pycnometry checks that skeletal carbon density ranges between 1.45 g/cm³ and 1.65 g/cm³, indicating abundant internal void space relative to graphite at 2.26 g/cm³.
Chemical vapor deposition using toluene gas passivates open surface defects without collapsing internal closed nano-voids required for sodium storage.
Hard carbon batches demonstrating lower Raman defect ratios consistently yield higher initial coulombic efficiency when paired with ester-based liquid electrolytes.

Electrochemistry
Galvanostatic charge and discharge profiles of hard carbon anodes show a characteristic two-step voltage curve. The high-potential sloping region, extending from 1.2 volts down to 0.1 volts versus sodium metal, corresponds to sodium cation adsorption at edge sites, surface functional groups, and expanded interlayer regions. The flat lower plateau operating between 0.1 volts and 0.001 volts represents sodium cation intercalation into expanded d002 layers combined with sodium cluster condensation inside closed nano-voids.
Balancing the capacity contribution of these two regions governs high-rate transport and overall energy density.
Analyzing voltage profiles of sodium half-cells separates edge-adsorption capacities from internal pore-filling contributions. Sloping capacity supplies fast sodium migration kinetics with low volume expansion, while lower plateau capacity provides the dense charge storage needed to maximize pack-level energy storage. High-temperature carbonization shifts capacity toward the lower plateau by reducing surface defect sites while promoting closed nano-void formation.
Sloping Capacity versus Flat Plateau Mechanisms
Sodium ion storage above 0.1 volts occurs through adsorption at surface defects and edge sites, whereas low-potential storage involves intercalation and pore-filling. Disordered regions and open edges bind sodium cations with varied adsorption energies, creating a sloped voltage output during galvanostatic discharge. Sloping discharge capacity exhibits minimal kinetic impedance and strong low-temperature performance down to -40 °C.
Plateau discharge capacity operates near the metallic sodium deposition potential. Sodium cations migrate through expanded d002 channels and condense into metallic nano-clusters within internal closed pores, producing a flat voltage profile that mirrors lithium intercalation in graphite. Excessive lower-plateau utilization at high C-rates risks localized metallic sodium plating on particle surfaces, which requires precise voltage cut-off thresholds in battery management algorithms.
Rate Capability and Kinetic Migration Barriers
Solid-state diffusion within enlarged crystallite channels dictates the high-rate performance of sodium-ion cell formulations. Sodium cations have a larger ionic radius than lithium cations, raising the kinetic migration barrier through standard carbon lattices. Expanded d002 interlayer spacings above 0.370 nanometers lower the activation energy for sodium transport, supporting continuous 5C fast charging without capacity loss.
Particle size distribution controls diffusion path length. Spherical hard carbon morphology with d50 particle sizes between 4 micrometers and 8 micrometers minimizes solid-state diffusion distance while maintaining sufficient packing density. Surface coatings that eliminate tortuous surface pores prevent kinetic bottlenecks at the electrode-electrolyte interface during fast discharge pulses.

Solid Electrolyte Interphase Formation and Coulombic Efficiency
Initial charge cycles consume active sodium cations to establish a passivating surface film over exposed carbon edges. Solid electrolyte interphase decomposition products include sodium carbonate, sodium alkyl carbonates, sodium fluoride, and organic polymers derived from electrolyte solvent reduction. Defect concentrations govern initial efficiency.
Quality assurance qualification relies on standard documentation parameters that mandate specific chemical and structural verification thresholds before material release.
- Initial Coulombic Efficiency Limit mandates a minimum first-cycle efficiency of 87.0 percent measured in standardized sodium half-cells at a 0.1C rate.
- Reversible Specific Capacity Threshold enforces a lower limit of 300 mAh/g total capacity with at least 180 mAh/g delivered on the flat lower plateau below 0.1 volts.
- Particle Size Distribution Tolerance defines strict d10, d50, and d90 boundaries to prevent excessive fine particles that increase active surface area.
- Moisture Content Cap specifies residual water levels below 200 parts per million measured via Karl Fischer titration prior to electrode slurry mixing.
Contractual specification limits capping ash content at 0.15 weight percent prevent local thermal runaways and unexpected gas evolution during initial formation cycling.
Inserting a technical clause in supply agreements requiring a minimum lower-plateau capacity proportion of sixty percent forces manufacturers to maintain rigorous pyrolysis temperature controls during furnace operations.


Economics
Commercial viability for sodium-ion active anode materials hinges on precursor raw material yield, energy consumption during high-temperature thermal treatment, and final qualification standards. Hard carbon anode costs currently account for 12 to 18 percent of total sodium-ion cell manufacturing expense. Precursor selection governs raw material expenditures, while continuous rotary kiln processing temperatures establish electrical utility costs per metric ton of finished active material.
Yield losses inflate landed costs. Bio-based precursors offer low raw material procurement costs near $600 per metric ton but suffer from low solid carbon yields during pyrolysis, effectively tripling the true raw material cost per finished ton. Synthetic phenolic resins incur initial feedstock expenses exceeding $3,200 per metric ton, offset by higher purity, predictable processing performance, and superior initial coulombic efficiency that eliminates costly electrolyte additive requirements.

Precursor Yield Losses and Mass Balance Arithmetic
Raw biomass and polymer feeds experience significant weight reductions through devolatilization during thermal stabilization and carbonization steps. Mass balance calculations track solid carbon recovery through each conversion phase. Coconut shell precursors yield approximately 30 to 35 percent solid hard carbon relative to dry raw input weight after carbonization at 1250 °C.
Phenolic resin precursors deliver solid carbon yields between 45 and 55 percent due to higher initial fixed carbon content and tight cross-linked polymer matrices. Process economic models incorporate the mass loss differential alongside gas scrubbers and volatile tar recovery operations. Capturing and combusting off-gasses like methane and carbon monoxide to preheat rotary kilns lowers total net energy consumption per kilogram of produced hard carbon.
Thermal Kiln Power Consumption and Landed Cost Breakdown
Operating electric rotary kilns or push-slab furnaces at elevated temperatures is the dominant operational cost component in hard carbon manufacturing. High-temperature carbonization at 1250 °C consumes between 8 and 14 kilowatt-hours of electrical energy per kilogram of processed hard carbon powder, depending on kiln insulation, throughput rate, and inert gas heat recovery integration.
| Cost Component | Coconut Shell Precursor ($/kg) | Hardwood Lignin ($/kg) | Phenolic Resin ($/kg) | |||
|---|---|---|---|---|---|---|
| Raw Feedstock Procurement | 0.65 | 0.45 | 3.50 | |||
| Chemical Pre-treatment & Washing | 0.40 | 0.60 | 0.10 | |||
| Thermal Stabilization Energy | 0.35 | 0.40 | 0.30 | |||
| High-Temp Carbonization Energy | 1.80 | 2.10 | 1.40 | |||
| CVD Surface Passivation Gas | 0.50 | 0.50 | 0.30 | |||
| Milling, Classification & Packaging | 0.40 | 0.45 | 0.40 | |||
| Finished Hard Carbon Cost | 4.10 | 4.50 | 6.00 | |||
| Calculated based on industrial electricity pricing of $0.08 per kWh and mass yield balance figures verified across regional rotary kiln operations. | ||||||

Procurement Specifications and Quality Verification Dossiers
Cell manufacturers set strict incoming inspection limits covering particle size distribution, tap density, d002 interlayer distance, and residual moisture content. Moisture contamination alters surface energy. Sourcing teams enforce lot-to-lot consistency protocols to ensure landed hard carbon matches the electrochemical performance established during early cell qualification trials.
Testing protocols require suppliers to furnish wide-angle X-ray diffraction patterns, Raman spectra, and automated gas physisorption data with every delivered production lot. Price negotiation models link raw material cost adjustments to verified d002 interlayer spacing compliance, establishing financial penalties when lot parameters deviate beyond specified tolerance bands. Adjusting furnace throughput to optimize precursor yield balances raw material utilization against energy consumption, establishing the landed cost per delivered kilowatt-hour over full battery operational life.